
 Login Sign Up


| |||||
 |  | ||||

| 12Stocks.com Market Intelligence |
Best Asia Stocks
|
|
| Quick Read: Top Asia Stocks By Performances & Trends: Daily, Weekly, Year-to-Date, Market Cap (Size) & Technical Trends | |||
| Best Asia Views: Quick Browse View, Summary & Slide Show | |||
| 12Stocks.com Asia Stocks Performances & Trends Daily | |||||||||
|
|  The overall market intelligence score is 100 (0-bearish to 100-bullish) which puts Asia index in short term bullish trend. The market intelligence score from previous trading session is 60 and hence an improvement of trend.
| ||||||||
Here are the market intelligence trend scores of the most requested Asia stocks at 12Stocks.com (click stock name for detailed review):
|


| Consider signing up for our daily 12Stocks.com "Best Stocks Newsletter". You will never ever miss a big stock move again! |
| 12Stocks.com: Top Performing Asia Index Stocks | |||||||||||||||||||||||||||||||||||||||||||||||
 The top performing Asia Index stocks year to date are
Now, more recently, over last week, the top performing Asia Index stocks on the move are


|
|||||||||||||||||||||||||||||||||||||||||||||||
| 12Stocks.com: Investing in Asia Index with Stocks | |
|
The following table helps investors and traders sort through current performance and trends (as measured by market intelligence score) of various
stocks in the Asia Index. Quick View: Move mouse or cursor over stock symbol (ticker) to view short-term technical chart and over stock name to view long term chart. Click on  to add stock symbol to your watchlist and to add stock symbol to your watchlist and  to view watchlist. Click on any ticker or stock name for detailed market intelligence report for that stock. to view watchlist. Click on any ticker or stock name for detailed market intelligence report for that stock. |
12Stocks.com Performance of Stocks in Asia Index
| Ticker | Stock Name | Watchlist | Category | Recent Price | Market Intelligence Score | Change % | YTD Change% |
| NCTY | The9 |   | Technology | 7.78 | 60 | 2.23 | -46.49% |
| HTHT | Huazhu | | Services & Goods | 35.93 | 100 | 2.19 | 12.31% |
| STG | Sunlands | | Services & Goods | 9.84 | 50 | 2.18 | 74.16% |
| CANG | Cango | | Technology | 4.69 | 70 | 2.18 | 6.59% |
| IQ | iQIYI | | Technology | 2.35 | 100 | 2.17 | 16.92% |
| UCAR | U Power | | Services & Goods | 1.98 | 68 | 2.06 | -70.14% |
| RDY | Dr. Reddy | | Health Care | 14.42 | 80 | 2.05 | -8.22% |
| API | Agora | | Technology | 3.54 | 10 | 2.02 | -14.90% |
| AGMH | AGM | | Technology | 2.06 | 30 | 1.98 | -97.27% |
| RERE | ATRenew | | Services & Goods | 4.65 | 60 | 1.97 | 61.46% |
| RGC | Regencell Bioscience | | Health Care | 12.56 | 50 | 1.87 | NA |
| VIPS | Vipshop | | Services & Goods | 16.96 | 90 | 1.80 | 30.68% |
| SOHU | Sohu.com | | Technology | 15.53 | 70 | 1.77 | 17.83% |
| FAMI | Farmmi | | Consumer Staples | 1.74 | 50 | 1.75 | -51.68% |
| INFY | Infosys | | Technology | 17.34 | 70 | 1.70 | -19.88% |
| MOMO | Momo | | Technology | 8.13 | 70 | 1.63 | 11.50% |
| ATAT | Atour Lifestyle | | Services & Goods | 34.49 | 51 | 1.56 | 30.01% |
| EM | Smart Share | | Services & Goods | 1.34 | 70 | 1.52 | 86.11% |
| AIXI | Xiao-I | | Technology | 1.45 | 43 | 1.47 | -74.85% |
| ZLAB | Zai Lab | | Health Care | 33.99 | 50 | 1.46 | 29.78% |
| HCM | Hutchison China | | Health Care | 16.11 | 30 | 1.45 | 11.80% |
| APWC | Asia Pacific | | Industrials | 1.75 | 50 | 1.45 | 18.59% |
| ZH | Zhihu | | Services & Goods | 4.96 | 60 | 1.43 | 40.11% |
| ZCMD | Zhongchao | | Health Care | 0.90 | 10 | 1.38 | -44.38% |
| SOL | ReneSola | | Technology | 1.88 | 40 | 1.35 | -7.39% |
| To view more stocks, click on Next / Previous arrows or select different range: 0 - 25 , 25 - 50 , 50 - 75 , 75 - 100 , 100 - 125 , 125 - 150 , 150 - 175 , 175 - 200 | ||
 | Click To Change The Sort Order: By Market Cap or Company Size Performance: Year-to-date, Week and Day |  |
|
Get the most comprehensive stock market coverage daily at 12Stocks.com ➞ Best Stocks Today ➞ Best Stocks Weekly ➞ Best Stocks Year-to-Date ➞ Best Stocks Trends ➞  Best Stocks Today 12Stocks.com Best Nasdaq Stocks ➞ Best S&P 500 Stocks ➞ Best Tech Stocks ➞ Best Biotech Stocks ➞ |
| Detailed Overview of Asia Stocks |
| Asia Technical Overview, Leaders & Laggards, Top Asia ETF Funds & Detailed Asia Stocks List, Charts, Trends & More |
| Asia: Technical Analysis, Trends & YTD Performance | |
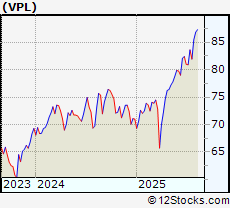
 VPL Weekly Chart |
|
| Long Term Trend: Very Good | |
| Medium Term Trend: Very Good | |
 VPL Daily Chart |
|
| Short Term Trend: Very Good | |
| Overall Trend Score: 100 | |
| YTD Performance: 21.07% | |
| **Trend Scores & Views Are Only For Educational Purposes And Not For Investing | |
| 12Stocks.com: Investing in Asia Index using Exchange Traded Funds | |
|
The following table shows list of key exchange traded funds (ETF) that
help investors play Asia stock market. For detailed view, check out our ETF Funds section of our website. Quick View: Move mouse or cursor over ETF symbol (ticker) to view short-term technical chart and over ETF name to view long term chart. Click on ticker or stock name for detailed view. Click on to add stock symbol to your watchlist and to view watchlist. |
12Stocks.com List of ETFs that track Asia Index
| Ticker | ETF Name | Watchlist | Recent Price | Market Intelligence Score | Change % | Week % | Year-to-date % |
| VPL | Pacific | | 87.25 | 100 | 1.78 | 0.48 | 21.07% |
| EEMA | Emerging Markets Asia | | 85.21 | 90 | -0.18 | -0.32 | 19.2% |
| AIA | Asia 50 | | 83.96 | 90 | -0.29 | -1.9 | 25.07% |
| AAXJ | All Country Asia | | 85.59 | 90 | -0.07 | -0.35 | 19.41% |
| GMF | Emerging Asia Pacific | | 130.85 | 100 | -0.14 | 0.09 | 13.23% |
| EPP | Pacific ex Japan | | 51.11 | 100 | 0.33 | 0.06 | 18.73% |
| ASEA | Southeast Asia | | 17.31 | 90 | -0.17 | -0.63 | 10.91% |
| DVYA | Asia/Pacific Dividend | | 41.78 | 100 | 0.69 | 0.36 | 19.96% |
| IPAC | Core Pacific | | 72.13 | 100 | -0.66 | 0.19 | 19.54% |
| FXI | China Large-Cap | | 39.24 | 100 | 2.27 | 2.35 | 23.05% |
| EWY | South Korea | | 73.5 | 70 | 3.2 | 0.15 | 36.19% |
| EWT | Taiwan | | 59.65 | 50 | 1.84 | -1.27 | 15.94% |
| EWJ | Japan | | 79.98 | 80 | 1.63 | -0.21 | 18.03% |
| EWH | Hong Kong | | 21.48 | 90 | 1.46 | 1.37 | 33% |
| EWS | Singapore | | 28.27 | 100 | 2.13 | 1.91 | 27.47% |
| EWM | Malaysia | | 25.72 | 100 | 2.1 | 2.96 | 9.82% |
| EPHE | Philippines | | 26.15 | 60 | -0.76 | -0.49 | 5.72% |
| EIDO | Indonesia | | 18.44 | 90 | -0.86 | -1.02 | 2.45% |
| THD | Thailand | | 57.19 | 90 | -0.49 | -1.09 | -3.2% |
| VNM | Vietnam | | 17.60 | 50 | -0.51 | -0.9 | 53.31% |
| 12Stocks.com: Charts, Trends, Fundamental Data and Performances of Asia Stocks | |
|
We now take in-depth look at all Asia stocks including charts, multi-period performances and overall trends (as measured by market intelligence score). One can sort Asia stocks (click link to choose) by Daily, Weekly and by Year-to-Date performances. Also, one can sort by size of the company or by market capitalization. |
| Select Your Default Chart Type: | |||||
| |||||
| Click on stock symbol or name for detailed view. Click on to add stock symbol to your watchlist and to view watchlist. Quick View: Move mouse or cursor over "Daily" to quickly view daily technical stock chart and over "Weekly" to view weekly technical stock chart. | |||||

 | NCTY The9 Limited |
| Sector: Technology | |
| SubSector: Multimedia & Graphics Software | |
| MarketCap: 19.7586 Millions | |
| Recent Price: 7.78 Market Intelligence Score: 60 | |
| Day Percent Change: 2.23% Day Change: 0.17 | |
| Week Change: -4.89% Year-to-date Change: -46.5% | |
| NCTY Links: Profile News Message Board | |
| Charts:- Daily , Weekly | |
| Add NCTY to Watchlist: View: Get Complete NCTY Trend Analysis ➞ | |
 | HTHT Huazhu Group Limited |
| Sector: Services & Goods | |
| SubSector: Lodging | |
| MarketCap: 9164.46 Millions | |
| Recent Price: 35.93 Market Intelligence Score: 100 | |
| Day Percent Change: 2.19% Day Change: 0.77 | |
| Week Change: 8.16% Year-to-date Change: 12.3% | |
| HTHT Links: Profile News Message Board | |
| Charts:- Daily , Weekly | |
| Add HTHT to Watchlist: View: Get Complete HTHT Trend Analysis ➞ | |
 | STG Sunlands Technology Group |
| Sector: Services & Goods | |
| SubSector: Education & Training Services | |
| MarketCap: 295.706 Millions | |
| Recent Price: 9.84 Market Intelligence Score: 50 | |
| Day Percent Change: 2.18% Day Change: 0.21 | |
| Week Change: -2.57% Year-to-date Change: 74.2% | |
| STG Links: Profile News Message Board | |
| Charts:- Daily , Weekly | |
| Add STG to Watchlist: View: Get Complete STG Trend Analysis ➞ | |
 | CANG Cango Inc. |
| Sector: Technology | |
| SubSector: Internet Information Providers | |
| MarketCap: 947.48 Millions | |
| Recent Price: 4.69 Market Intelligence Score: 70 | |
| Day Percent Change: 2.18% Day Change: 0.1 | |
| Week Change: -2.9% Year-to-date Change: 6.6% | |
| CANG Links: Profile News Message Board | |
| Charts:- Daily , Weekly | |
| Add CANG to Watchlist: View: Get Complete CANG Trend Analysis ➞ | |
 | IQ iQIYI, Inc. |
| Sector: Technology | |
| SubSector: Internet Information Providers | |
| MarketCap: 13591.5 Millions | |
| Recent Price: 2.35 Market Intelligence Score: 100 | |
| Day Percent Change: 2.17% Day Change: 0.05 | |
| Week Change: 23.04% Year-to-date Change: 16.9% | |
| IQ Links: Profile News Message Board | |
| Charts:- Daily , Weekly | |
| Add IQ to Watchlist: View: Get Complete IQ Trend Analysis ➞ | |
 | UCAR U Power Limited |
| Sector: Services & Goods | |
| SubSector: Auto & Truck Dealerships | |
| MarketCap: 372 Millions | |
| Recent Price: 1.98 Market Intelligence Score: 68 | |
| Day Percent Change: 2.06% Day Change: 0.04 | |
| Week Change: -0.5% Year-to-date Change: -70.1% | |
| UCAR Links: Profile News Message Board | |
| Charts:- Daily , Weekly | |
| Add UCAR to Watchlist: View: Get Complete UCAR Trend Analysis ➞ | |
 | RDY Dr. Reddy s Laboratories Limited |
| Sector: Health Care | |
| SubSector: Drug Manufacturers - Other | |
| MarketCap: 6590.23 Millions | |
| Recent Price: 14.42 Market Intelligence Score: 80 | |
| Day Percent Change: 2.05% Day Change: 0.29 | |
| Week Change: 2.2% Year-to-date Change: -8.2% | |
| RDY Links: Profile News Message Board | |
| Charts:- Daily , Weekly | |
| Add RDY to Watchlist: View: Get Complete RDY Trend Analysis ➞ | |
 | API Agora, Inc. |
| Sector: Technology | |
| SubSector: Software Application | |
| MarketCap: 42787 Millions | |
| Recent Price: 3.54 Market Intelligence Score: 10 | |
| Day Percent Change: 2.02% Day Change: 0.07 | |
| Week Change: -3.01% Year-to-date Change: -14.9% | |
| API Links: Profile News Message Board | |
| Charts:- Daily , Weekly | |
| Add API to Watchlist: View: Get Complete API Trend Analysis ➞ | |
 | AGMH AGM Group Holdings Inc. |
| Sector: Technology | |
| SubSector: Application Software | |
| MarketCap: 320.362 Millions | |
| Recent Price: 2.06 Market Intelligence Score: 30 | |
| Day Percent Change: 1.98% Day Change: 0.04 | |
| Week Change: -10.43% Year-to-date Change: -97.3% | |
| AGMH Links: Profile News Message Board | |
| Charts:- Daily , Weekly | |
| Add AGMH to Watchlist: View: Get Complete AGMH Trend Analysis ➞ | |
 | RERE ATRenew Inc. |
| Sector: Services & Goods | |
| SubSector: Internet Retail | |
| MarketCap: 672 Millions | |
| Recent Price: 4.65 Market Intelligence Score: 60 | |
| Day Percent Change: 1.97% Day Change: 0.09 | |
| Week Change: 9.67% Year-to-date Change: 61.5% | |
| RERE Links: Profile News Message Board | |
| Charts:- Daily , Weekly | |
| Add RERE to Watchlist: View: Get Complete RERE Trend Analysis ➞ | |
 | RGC Regencell Bioscience Holdings Limited |
| Sector: Health Care | |
| SubSector: Drug Manufacturers - Specialty & Generic | |
| MarketCap: 284 Millions | |
| Recent Price: 12.56 Market Intelligence Score: 50 | |
| Day Percent Change: 1.87% Day Change: 0.23 | |
| Week Change: -1.1% Year-to-date Change: 9,561.5% | |
| RGC Links: Profile News Message Board | |
| Charts:- Daily , Weekly | |
| Add RGC to Watchlist: View: Get Complete RGC Trend Analysis ➞ | |
 | VIPS Vipshop Holdings Limited |
| Sector: Services & Goods | |
| SubSector: Catalog & Mail Order Houses | |
| MarketCap: 10496.2 Millions | |
| Recent Price: 16.96 Market Intelligence Score: 90 | |
| Day Percent Change: 1.8% Day Change: 0.3 | |
| Week Change: -2.14% Year-to-date Change: 30.7% | |
| VIPS Links: Profile News Message Board | |
| Charts:- Daily , Weekly | |
| Add VIPS to Watchlist: View: Get Complete VIPS Trend Analysis ➞ | |
 | SOHU Sohu.com Limited |
| Sector: Technology | |
| SubSector: Internet Information Providers | |
| MarketCap: 243.48 Millions | |
| Recent Price: 15.53 Market Intelligence Score: 70 | |
| Day Percent Change: 1.77% Day Change: 0.27 | |
| Week Change: -0.19% Year-to-date Change: 17.8% | |
| SOHU Links: Profile News Message Board | |
| Charts:- Daily , Weekly | |
| Add SOHU to Watchlist: View: Get Complete SOHU Trend Analysis ➞ | |
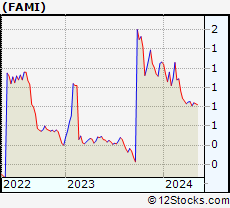 | FAMI Farmmi, Inc. |
| Sector: Consumer Staples | |
| SubSector: Processed & Packaged Goods | |
| MarketCap: 5.62748 Millions | |
| Recent Price: 1.74 Market Intelligence Score: 50 | |
| Day Percent Change: 1.75% Day Change: 0.03 | |
| Week Change: 6.01% Year-to-date Change: -51.7% | |
| FAMI Links: Profile News Message Board | |
| Charts:- Daily , Weekly | |
| Add FAMI to Watchlist: View: Get Complete FAMI Trend Analysis ➞ | |
 | INFY Infosys Limited |
| Sector: Technology | |
| SubSector: Information Technology Services | |
| MarketCap: 33819.1 Millions | |
| Recent Price: 17.34 Market Intelligence Score: 70 | |
| Day Percent Change: 1.7% Day Change: 0.29 | |
| Week Change: 4.71% Year-to-date Change: -19.9% | |
| INFY Links: Profile News Message Board | |
| Charts:- Daily , Weekly | |
| Add INFY to Watchlist: View: Get Complete INFY Trend Analysis ➞ | |
 | MOMO Momo Inc. |
| Sector: Technology | |
| SubSector: Internet Software & Services | |
| MarketCap: 4796.71 Millions | |
| Recent Price: 8.13 Market Intelligence Score: 70 | |
| Day Percent Change: 1.63% Day Change: 0.13 | |
| Week Change: 0.99% Year-to-date Change: 11.5% | |
| MOMO Links: Profile News Message Board | |
| Charts:- Daily , Weekly | |
| Add MOMO to Watchlist: View: Get Complete MOMO Trend Analysis ➞ | |
 | ATAT Atour Lifestyle Holdings Limited |
| Sector: Services & Goods | |
| SubSector: Lodging | |
| MarketCap: 2120 Millions | |
| Recent Price: 34.49 Market Intelligence Score: 51 | |
| Day Percent Change: 1.56% Day Change: 0.53 | |
| Week Change: 0.03% Year-to-date Change: 30.0% | |
| ATAT Links: Profile News Message Board | |
| Charts:- Daily , Weekly | |
| Add ATAT to Watchlist: View: Get Complete ATAT Trend Analysis ➞ | |
 | EM Smart Share Global Limited |
| Sector: Services & Goods | |
| SubSector: Personal Services | |
| MarketCap: 238 Millions | |
| Recent Price: 1.34 Market Intelligence Score: 70 | |
| Day Percent Change: 1.52% Day Change: 0.02 | |
| Week Change: 14.53% Year-to-date Change: 86.1% | |
| EM Links: Profile News Message Board | |
| Charts:- Daily , Weekly | |
| Add EM to Watchlist: View: Get Complete EM Trend Analysis ➞ | |
 | AIXI Xiao-I Corporation |
| Sector: Technology | |
| SubSector: Software - Application | |
| MarketCap: 431 Millions | |
| Recent Price: 1.45 Market Intelligence Score: 43 | |
| Day Percent Change: 1.47% Day Change: 0.02 | |
| Week Change: -6.39% Year-to-date Change: -74.9% | |
| AIXI Links: Profile News Message Board | |
| Charts:- Daily , Weekly | |
| Add AIXI to Watchlist: View: Get Complete AIXI Trend Analysis ➞ | |
 | ZLAB Zai Lab Limited |
| Sector: Health Care | |
| SubSector: Biotechnology | |
| MarketCap: 3970.35 Millions | |
| Recent Price: 33.99 Market Intelligence Score: 50 | |
| Day Percent Change: 1.46% Day Change: 0.49 | |
| Week Change: -2.69% Year-to-date Change: 29.8% | |
| ZLAB Links: Profile News Message Board | |
| Charts:- Daily , Weekly | |
| Add ZLAB to Watchlist: View: Get Complete ZLAB Trend Analysis ➞ | |
 | HCM Hutchison China MediTech Limited |
| Sector: Health Care | |
| SubSector: Drug Manufacturers - Major | |
| MarketCap: 2324.43 Millions | |
| Recent Price: 16.11 Market Intelligence Score: 30 | |
| Day Percent Change: 1.45% Day Change: 0.23 | |
| Week Change: 1.51% Year-to-date Change: 11.8% | |
| HCM Links: Profile News Message Board | |
| Charts:- Daily , Weekly | |
| Add HCM to Watchlist: View: Get Complete HCM Trend Analysis ➞ | |
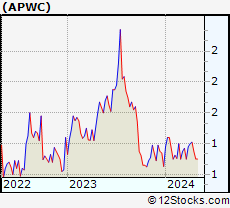 | APWC Asia Pacific Wire & Cable Corporation Limited |
| Sector: Industrials | |
| SubSector: Industrial Electrical Equipment | |
| MarketCap: 13.4879 Millions | |
| Recent Price: 1.75 Market Intelligence Score: 50 | |
| Day Percent Change: 1.45% Day Change: 0.03 | |
| Week Change: -10.05% Year-to-date Change: 18.6% | |
| APWC Links: Profile News Message Board | |
| Charts:- Daily , Weekly | |
| Add APWC to Watchlist: View: Get Complete APWC Trend Analysis ➞ | |
 | ZH Zhihu Inc. |
| Sector: Services & Goods | |
| SubSector: Internet Content & Information | |
| MarketCap: 741 Millions | |
| Recent Price: 4.96 Market Intelligence Score: 60 | |
| Day Percent Change: 1.43% Day Change: 0.07 | |
| Week Change: 18.1% Year-to-date Change: 40.1% | |
| ZH Links: Profile News Message Board | |
| Charts:- Daily , Weekly | |
| Add ZH to Watchlist: View: Get Complete ZH Trend Analysis ➞ | |
 | ZCMD Zhongchao Inc. |
| Sector: Health Care | |
| SubSector: Health Information Services | |
| MarketCap: 41487 Millions | |
| Recent Price: 0.90 Market Intelligence Score: 10 | |
| Day Percent Change: 1.38% Day Change: 0.01 | |
| Week Change: -7.11% Year-to-date Change: -44.4% | |
| ZCMD Links: Profile News Message Board | |
| Charts:- Daily , Weekly | |
| Add ZCMD to Watchlist: View: Get Complete ZCMD Trend Analysis ➞ | |
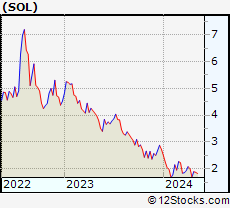 | SOL ReneSola Ltd |
| Sector: Technology | |
| SubSector: Semiconductor - Specialized | |
| MarketCap: 45.366 Millions | |
| Recent Price: 1.88 Market Intelligence Score: 40 | |
| Day Percent Change: 1.35% Day Change: 0.03 | |
| Week Change: -1.05% Year-to-date Change: -7.4% | |
| SOL Links: Profile News Message Board | |
| Charts:- Daily , Weekly | |
| Add SOL to Watchlist: View: Get Complete SOL Trend Analysis ➞ | |
| To view more stocks, click on Next / Previous arrows or select different range: 0 - 25 , 25 - 50 , 50 - 75 , 75 - 100 , 100 - 125 , 125 - 150 , 150 - 175 , 175 - 200 | ||
| Click To Change The Sort Order: By Market Cap or Company Size Performance: Year-to-date, Week and Day | |
| Select Chart Type: | ||
|
Best Stocks Today 12Stocks.com |
© 2025 12Stocks.com Terms & Conditions Privacy Contact Us
All Information Provided Only For Education And Not To Be Used For Investing or Trading. See Terms & Conditions


One More Thing ... Get Best Stocks Delivered Daily!
Never Ever Miss A Move With Our Top Ten Stocks Lists
Find Best Stocks In Any Market - Bull or Bear Market
Take A Peek At Our Top Ten Stocks Lists: Daily, Weekly, Year-to-Date & Top Trends
Find Best Stocks In Any Market - Bull or Bear Market
Take A Peek At Our Top Ten Stocks Lists: Daily, Weekly, Year-to-Date & Top Trends
Asia Stocks With Best Up Trends [0-bearish to 100-bullish]: XPeng [100], NIO [100], MINISO [100], Pinduoduo [100], Huazhu [100], iQIYI [100], Melco Resorts[100], Toyota Motor[100], ORIX [100], Honda Motor[100], Full Truck[90]
Best Asia Stocks Year-to-Date:
Regencell Bioscience[9561.54%], I Mab[454.12%], So-Young [384.74%], QuantaSing [269.91%], Xunlei [264.32%], OneConnect Financial[205.35%], Sify [187.76%], Niu [159.78%], Viomi [154.48%], Yatsen Holding[141.21%], Tencent Music[120.18%] Best Asia Stocks This Week:
Xunlei [43.56%], Burning Rock[41.87%], NIO [24.49%], iQIYI [23.04%], Zhihu [18.1%], XPeng [17.39%], Smart Share[14.53%], Cheetah Mobile[13.59%], MINISO [13.58%], QuantaSing [13.01%], Full Truck[12.26%] Best Asia Stocks Daily:
X Financial[15.73%], XPeng [11.68%], Full Truck[9.81%], Viomi [9.39%], NIO [9.27%], CNFinance [7.77%], Lixiang Education[7.32%], Kanzhun [6.61%], MINISO [6.38%], Burning Rock[6.02%], FinVolution [5.55%]