
 Login Sign Up


| |||||
 |  | ||||

| 12Stocks.com Market Intelligence |
Best Asia Stocks
|
|
| Quick Read: Top Asia Stocks By Performances & Trends: Daily, Weekly, Year-to-Date, Market Cap (Size) & Technical Trends | |||
| Best Asia Views: Quick Browse View, Summary & Slide Show | |||
| 12Stocks.com Asia Stocks Performances & Trends Daily | |||||||||
|
|  The overall market intelligence score is 100 (0-bearish to 100-bullish) which puts Asia index in short term bullish trend. The market intelligence score from previous trading session is 60 and hence an improvement of trend.
| ||||||||
Here are the market intelligence trend scores of the most requested Asia stocks at 12Stocks.com (click stock name for detailed review):
|


| Consider signing up for our daily 12Stocks.com "Best Stocks Newsletter". You will never ever miss a big stock move again! |
| 12Stocks.com: Top Performing Asia Index Stocks | |||||||||||||||||||||||||||||||||||||||||||||||
 The top performing Asia Index stocks year to date are
Now, more recently, over last week, the top performing Asia Index stocks on the move are


|
|||||||||||||||||||||||||||||||||||||||||||||||
| 12Stocks.com: Investing in Asia Index with Stocks | |
|
The following table helps investors and traders sort through current performance and trends (as measured by market intelligence score) of various
stocks in the Asia Index. Quick View: Move mouse or cursor over stock symbol (ticker) to view short-term technical chart and over stock name to view long term chart. Click on  to add stock symbol to your watchlist and to add stock symbol to your watchlist and  to view watchlist. Click on any ticker or stock name for detailed market intelligence report for that stock. to view watchlist. Click on any ticker or stock name for detailed market intelligence report for that stock. |
12Stocks.com Performance of Stocks in Asia Index
| Ticker | Stock Name | Watchlist | Category | Recent Price | Market Intelligence Score | Change % | YTD Change% |
| LXEH | Lixiang Education |   | Consumer Staples | 1.32 | 30 | 7.32% | -73.99% |
| AIXI | Xiao-I | | Technology | 1.45 | 43 | 1.47% | -74.85% |
| TAOP | Taoping | | Technology | 3.12 | 60 | -2.19% | -75.37% |
| SDA | SunCar | | Services & Goods | 2.29 | 30 | -0.87% | -76.27% |
| TANH | Tantech | | Materials | 1.93 | 80 | 2.57% | -77.13% |
| RETO | ReTo Eco- | | Industrials | 1.91 | 30 | -3.05% | -78.54% |
| WIMI | WiMi Hologram | | Technology | 3.74 | 70 | 0.54% | -79.78% |
| AIHS | Senmiao | | Financials | 2.12 | 20 | 4.87% | -80.19% |
| CREG | China Recycling | | Industrials | 1.40 | 40 | -5.41% | -81.77% |
| DUO | Fangdd Network | | Financials | 1.36 | 50 | 3.41% | -85.79% |
| BHAT | Fujian Blue | | Technology | 1.61 | 20 | -0.62% | -88.29% |
| QH | Quhuo | | Technology | 0.06 | 20 | -40.21% | -95.75% |
| AGMH | AGM | | Technology | 2.06 | 30 | 1.98% | -97.27% |
| HOLO | MicroCloud Hologram | | Technology | 4.42 | 66 | 0.45% | -97.76% |
| GDHG | Golden Heaven | | Services & Goods | 0.35 | 51 | -5.67% | -99.40% |
| To view more stocks, click on Next / Previous arrows or select different range: 0 - 25 , 25 - 50 , 50 - 75 , 75 - 100 , 100 - 125 , 125 - 150 , 150 - 175 , 175 - 200 | ||
 | Click To Change The Sort Order: By Market Cap or Company Size Performance: Year-to-date, Week and Day |  |
|
Get the most comprehensive stock market coverage daily at 12Stocks.com ➞ Best Stocks Today ➞ Best Stocks Weekly ➞ Best Stocks Year-to-Date ➞ Best Stocks Trends ➞  Best Stocks Today 12Stocks.com Best Nasdaq Stocks ➞ Best S&P 500 Stocks ➞ Best Tech Stocks ➞ Best Biotech Stocks ➞ |
| Detailed Overview of Asia Stocks |
| Asia Technical Overview, Leaders & Laggards, Top Asia ETF Funds & Detailed Asia Stocks List, Charts, Trends & More |
| Asia: Technical Analysis, Trends & YTD Performance | |
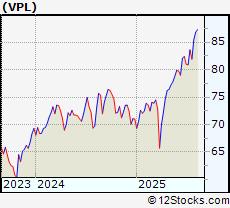
 VPL Weekly Chart |
|
| Long Term Trend: Very Good | |
| Medium Term Trend: Very Good | |
 VPL Daily Chart |
|
| Short Term Trend: Very Good | |
| Overall Trend Score: 100 | |
| YTD Performance: 21.07% | |
| **Trend Scores & Views Are Only For Educational Purposes And Not For Investing | |
| 12Stocks.com: Investing in Asia Index using Exchange Traded Funds | |
|
The following table shows list of key exchange traded funds (ETF) that
help investors play Asia stock market. For detailed view, check out our ETF Funds section of our website. Quick View: Move mouse or cursor over ETF symbol (ticker) to view short-term technical chart and over ETF name to view long term chart. Click on ticker or stock name for detailed view. Click on to add stock symbol to your watchlist and to view watchlist. |
12Stocks.com List of ETFs that track Asia Index
| Ticker | ETF Name | Watchlist | Recent Price | Market Intelligence Score | Change % | Week % | Year-to-date % |
| VPL | Pacific | | 87.25 | 100 | 1.78 | 0.48 | 21.07% |
| EEMA | Emerging Markets Asia | | 85.21 | 90 | -0.18 | -0.32 | 19.2% |
| AIA | Asia 50 | | 83.96 | 90 | -0.29 | -1.9 | 25.07% |
| AAXJ | All Country Asia | | 85.59 | 90 | -0.07 | -0.35 | 19.41% |
| GMF | Emerging Asia Pacific | | 130.85 | 100 | -0.14 | 0.09 | 13.23% |
| EPP | Pacific ex Japan | | 51.11 | 100 | 0.33 | 0.06 | 18.73% |
| ASEA | Southeast Asia | | 17.31 | 90 | -0.17 | -0.63 | 10.91% |
| DVYA | Asia/Pacific Dividend | | 41.78 | 100 | 0.69 | 0.36 | 19.96% |
| IPAC | Core Pacific | | 72.13 | 100 | -0.66 | 0.19 | 19.54% |
| FXI | China Large-Cap | | 39.24 | 100 | 2.27 | 2.35 | 23.05% |
| EWY | South Korea | | 73.5 | 70 | 3.2 | 0.15 | 36.19% |
| EWT | Taiwan | | 59.65 | 50 | 1.84 | -1.27 | 15.94% |
| EWJ | Japan | | 79.98 | 80 | 1.63 | -0.21 | 18.03% |
| EWH | Hong Kong | | 21.48 | 90 | 1.46 | 1.37 | 33% |
| EWS | Singapore | | 28.27 | 100 | 2.13 | 1.91 | 27.47% |
| EWM | Malaysia | | 25.72 | 100 | 2.1 | 2.96 | 9.82% |
| EPHE | Philippines | | 26.15 | 60 | -0.76 | -0.49 | 5.72% |
| EIDO | Indonesia | | 18.44 | 90 | -0.86 | -1.02 | 2.45% |
| THD | Thailand | | 57.19 | 90 | -0.49 | -1.09 | -3.2% |
| VNM | Vietnam | | 17.60 | 50 | -0.51 | -0.9 | 53.31% |
| 12Stocks.com: Charts, Trends, Fundamental Data and Performances of Asia Stocks | |
|
We now take in-depth look at all Asia stocks including charts, multi-period performances and overall trends (as measured by market intelligence score). One can sort Asia stocks (click link to choose) by Daily, Weekly and by Year-to-Date performances. Also, one can sort by size of the company or by market capitalization. |
| Select Your Default Chart Type: | |||||
| |||||
| Click on stock symbol or name for detailed view. Click on to add stock symbol to your watchlist and to view watchlist. Quick View: Move mouse or cursor over "Daily" to quickly view daily technical stock chart and over "Weekly" to view weekly technical stock chart. | |||||

 | LXEH Lixiang Education Holding Co., Ltd. |
| Sector: Consumer Staples | |
| SubSector: Education & Training Services | |
| MarketCap: 12347 Millions | |
| Recent Price: 1.32 Market Intelligence Score: 30 | |
| Day Percent Change: 7.32% Day Change: 0.09 | |
| Week Change: 4.76% Year-to-date Change: -74.0% | |
| LXEH Links: Profile News Message Board | |
| Charts:- Daily , Weekly | |
| Add LXEH to Watchlist: View: Get Complete LXEH Trend Analysis ➞ | |
 | AIXI Xiao-I Corporation |
| Sector: Technology | |
| SubSector: Software - Application | |
| MarketCap: 431 Millions | |
| Recent Price: 1.45 Market Intelligence Score: 43 | |
| Day Percent Change: 1.47% Day Change: 0.02 | |
| Week Change: -6.39% Year-to-date Change: -74.9% | |
| AIXI Links: Profile News Message Board | |
| Charts:- Daily , Weekly | |
| Add AIXI to Watchlist: View: Get Complete AIXI Trend Analysis ➞ | |
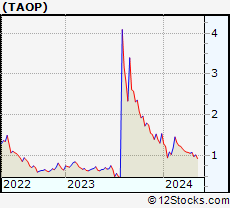 | TAOP Taoping Inc. |
| Sector: Technology | |
| SubSector: Information Technology Services | |
| MarketCap: 17.1468 Millions | |
| Recent Price: 3.12 Market Intelligence Score: 60 | |
| Day Percent Change: -2.19% Day Change: -0.07 | |
| Week Change: -20.45% Year-to-date Change: -75.4% | |
| TAOP Links: Profile News Message Board | |
| Charts:- Daily , Weekly | |
| Add TAOP to Watchlist: View: Get Complete TAOP Trend Analysis ➞ | |
 | SDA SunCar Technology Group Inc. |
| Sector: Services & Goods | |
| SubSector: Auto & Truck Dealerships | |
| MarketCap: 2680 Millions | |
| Recent Price: 2.29 Market Intelligence Score: 30 | |
| Day Percent Change: -0.87% Day Change: -0.02 | |
| Week Change: -2.97% Year-to-date Change: -76.3% | |
| SDA Links: Profile News Message Board | |
| Charts:- Daily , Weekly | |
| Add SDA to Watchlist: View: Get Complete SDA Trend Analysis ➞ | |
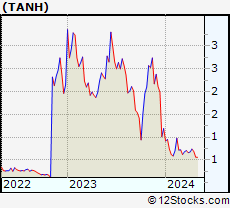 | TANH Tantech Holdings Ltd |
| Sector: Materials | |
| SubSector: Nonmetallic Mineral Mining | |
| MarketCap: 30.55 Millions | |
| Recent Price: 1.93 Market Intelligence Score: 80 | |
| Day Percent Change: 2.57% Day Change: 0.05 | |
| Week Change: 2.6% Year-to-date Change: -77.1% | |
| TANH Links: Profile News Message Board | |
| Charts:- Daily , Weekly | |
| Add TANH to Watchlist: View: Get Complete TANH Trend Analysis ➞ | |
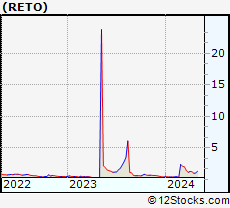 | RETO ReTo Eco-Solutions, Inc. |
| Sector: Industrials | |
| SubSector: General Building Materials | |
| MarketCap: 13.1953 Millions | |
| Recent Price: 1.91 Market Intelligence Score: 30 | |
| Day Percent Change: -3.05% Day Change: -0.06 | |
| Week Change: -1.55% Year-to-date Change: -78.5% | |
| RETO Links: Profile News Message Board | |
| Charts:- Daily , Weekly | |
| Add RETO to Watchlist: View: Get Complete RETO Trend Analysis ➞ | |
 | WIMI WiMi Hologram Cloud Inc. |
| Sector: Technology | |
| SubSector: Advertising Agencies | |
| MarketCap: 41837 Millions | |
| Recent Price: 3.74 Market Intelligence Score: 70 | |
| Day Percent Change: 0.54% Day Change: 0.02 | |
| Week Change: -8.33% Year-to-date Change: -79.8% | |
| WIMI Links: Profile News Message Board | |
| Charts:- Daily , Weekly | |
| Add WIMI to Watchlist: View: Get Complete WIMI Trend Analysis ➞ | |
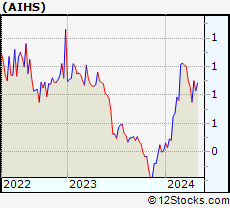 | AIHS Senmiao Technology Limited |
| Sector: Financials | |
| SubSector: Credit Services | |
| MarketCap: 11.8208 Millions | |
| Recent Price: 2.12 Market Intelligence Score: 20 | |
| Day Percent Change: 4.87% Day Change: 0.1 | |
| Week Change: -5.36% Year-to-date Change: -80.2% | |
| AIHS Links: Profile News Message Board | |
| Charts:- Daily , Weekly | |
| Add AIHS to Watchlist: View: Get Complete AIHS Trend Analysis ➞ | |
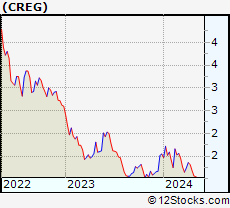 | CREG China Recycling Energy Corporation |
| Sector: Industrials | |
| SubSector: Waste Management | |
| MarketCap: 3.90988 Millions | |
| Recent Price: 1.40 Market Intelligence Score: 40 | |
| Day Percent Change: -5.41% Day Change: -0.08 | |
| Week Change: -4.11% Year-to-date Change: -81.8% | |
| CREG Links: Profile News Message Board | |
| Charts:- Daily , Weekly | |
| Add CREG to Watchlist: View: Get Complete CREG Trend Analysis ➞ | |
 | DUO Fangdd Network Group Ltd. |
| Sector: Financials | |
| SubSector: Property Management | |
| MarketCap: 783.142 Millions | |
| Recent Price: 1.36 Market Intelligence Score: 50 | |
| Day Percent Change: 3.41% Day Change: 0.04 | |
| Week Change: -17.58% Year-to-date Change: -85.8% | |
| DUO Links: Profile News Message Board | |
| Charts:- Daily , Weekly | |
| Add DUO to Watchlist: View: Get Complete DUO Trend Analysis ➞ | |
 | BHAT Fujian Blue Hat Interactive Entertainment Technology Ltd. |
| Sector: Technology | |
| SubSector: Multimedia & Graphics Software | |
| MarketCap: 28.3586 Millions | |
| Recent Price: 1.61 Market Intelligence Score: 20 | |
| Day Percent Change: -0.62% Day Change: -0.01 | |
| Week Change: -6.22% Year-to-date Change: -88.3% | |
| BHAT Links: Profile News Message Board | |
| Charts:- Daily , Weekly | |
| Add BHAT to Watchlist: View: Get Complete BHAT Trend Analysis ➞ | |
 | QH Quhuo Limited |
| Sector: Technology | |
| SubSector: Software Application | |
| MarketCap: 37787 Millions | |
| Recent Price: 0.06 Market Intelligence Score: 20 | |
| Day Percent Change: -40.21% Day Change: -0.04 | |
| Week Change: -45.57% Year-to-date Change: -95.8% | |
| QH Links: Profile News Message Board | |
| Charts:- Daily , Weekly | |
| Add QH to Watchlist: View: Get Complete QH Trend Analysis ➞ | |
 | AGMH AGM Group Holdings Inc. |
| Sector: Technology | |
| SubSector: Application Software | |
| MarketCap: 320.362 Millions | |
| Recent Price: 2.06 Market Intelligence Score: 30 | |
| Day Percent Change: 1.98% Day Change: 0.04 | |
| Week Change: -10.43% Year-to-date Change: -97.3% | |
| AGMH Links: Profile News Message Board | |
| Charts:- Daily , Weekly | |
| Add AGMH to Watchlist: View: Get Complete AGMH Trend Analysis ➞ | |
 | HOLO MicroCloud Hologram Inc. |
| Sector: Technology | |
| SubSector: Electronic Components | |
| MarketCap: 159 Millions | |
| Recent Price: 4.42 Market Intelligence Score: 66 | |
| Day Percent Change: 0.45% Day Change: 0.02 | |
| Week Change: -6.75% Year-to-date Change: -97.8% | |
| HOLO Links: Profile News Message Board | |
| Charts:- Daily , Weekly | |
| Add HOLO to Watchlist: View: Get Complete HOLO Trend Analysis ➞ | |
 | GDHG Golden Heaven Group Holdings Ltd. |
| Sector: Services & Goods | |
| SubSector: Leisure | |
| MarketCap: 230 Millions | |
| Recent Price: 0.35 Market Intelligence Score: 51 | |
| Day Percent Change: -5.67% Day Change: -0.02 | |
| Week Change: -19.69% Year-to-date Change: -99.4% | |
| GDHG Links: Profile News Message Board | |
| Charts:- Daily , Weekly | |
| Add GDHG to Watchlist: View: Get Complete GDHG Trend Analysis ➞ | |
| To view more stocks, click on Next / Previous arrows or select different range: 0 - 25 , 25 - 50 , 50 - 75 , 75 - 100 , 100 - 125 , 125 - 150 , 150 - 175 , 175 - 200 | ||
| Click To Change The Sort Order: By Market Cap or Company Size Performance: Year-to-date, Week and Day | |
| Select Chart Type: | ||
|
Best Stocks Today 12Stocks.com |
© 2025 12Stocks.com Terms & Conditions Privacy Contact Us
All Information Provided Only For Education And Not To Be Used For Investing or Trading. See Terms & Conditions


One More Thing ... Get Best Stocks Delivered Daily!
Never Ever Miss A Move With Our Top Ten Stocks Lists
Find Best Stocks In Any Market - Bull or Bear Market
Take A Peek At Our Top Ten Stocks Lists: Daily, Weekly, Year-to-Date & Top Trends
Find Best Stocks In Any Market - Bull or Bear Market
Take A Peek At Our Top Ten Stocks Lists: Daily, Weekly, Year-to-Date & Top Trends
Asia Stocks With Best Up Trends [0-bearish to 100-bullish]: XPeng [100], NIO [100], MINISO [100], Pinduoduo [100], Huazhu [100], iQIYI [100], Melco Resorts[100], Toyota Motor[100], ORIX [100], Honda Motor[100], Full Truck[90]
Best Asia Stocks Year-to-Date:
Regencell Bioscience[9561.54%], I Mab[454.12%], So-Young [384.74%], QuantaSing [269.91%], Xunlei [264.32%], OneConnect Financial[205.35%], Sify [187.76%], Niu [159.78%], Viomi [154.48%], Yatsen Holding[141.21%], Tencent Music[120.18%] Best Asia Stocks This Week:
Xunlei [43.56%], Burning Rock[41.87%], NIO [24.49%], iQIYI [23.04%], Zhihu [18.1%], XPeng [17.39%], Smart Share[14.53%], Cheetah Mobile[13.59%], MINISO [13.58%], QuantaSing [13.01%], Full Truck[12.26%] Best Asia Stocks Daily:
X Financial[15.73%], XPeng [11.68%], Full Truck[9.81%], Viomi [9.39%], NIO [9.27%], CNFinance [7.77%], Lixiang Education[7.32%], Kanzhun [6.61%], MINISO [6.38%], Burning Rock[6.02%], FinVolution [5.55%]