
 Login Sign Up


| |||||
 |  | ||||

| 12Stocks.com Market Intelligence |
Best SmallCap Stocks
|
| In a hurry? Small Cap Stock Lists: Performance Trends Table, Stock Charts
Sort Small Cap stocks: Daily, Weekly, Year-to-Date, Market Cap & Trends. Filter Small Cap stocks list by sector: Show all, Tech, Finance, Energy, Staples, Retail, Industrial, Materials, Utilities and HealthCare Filter Small Cap stocks list by size: All Large Medium Small and MicroCap |
| 12Stocks.com Small Cap Stocks Performances & Trends Daily | |||||||||
|
|  The overall Smart Investing & Trading Score is 44 (0-bearish to 100-bullish) which puts Small Cap index in short term neutral trend. The Smart Investing & Trading Score from previous trading session is 58 and hence a deterioration of trend.
| ||||||||
Here are the Smart Investing & Trading Scores of the most requested small cap stocks at 12Stocks.com (click stock name for detailed review):
|


| 12Stocks.com: Investing in Smallcap Index with Stocks | |
|
The following table helps investors and traders sort through current performance and trends (as measured by Smart Investing & Trading Score) of various
stocks in the Smallcap Index. Quick View: Move mouse or cursor over stock symbol (ticker) to view short-term technical chart and over stock name to view long term chart. Click on  to add stock symbol to your watchlist and to add stock symbol to your watchlist and  to view watchlist. Click on any ticker or stock name for detailed market intelligence report for that stock. to view watchlist. Click on any ticker or stock name for detailed market intelligence report for that stock. |
12Stocks.com Performance of Stocks in Smallcap Index
| Ticker | Stock Name | Watchlist | Category | Recent Price | Smart Investing & Trading Score | Change % | Weekly Change% |
| PLYM | Plymouth Industrial |   | Financials | 20.58 | 35 | -1.25% | 1.23% |
| BOH | Bank of Hawaii | | Financials | 59.11 | 40 | 0.75% | 1.22% |
| SEM | Select Medical | | Health Care | 27.39 | 61 | -1.19% | 1.22% |
| EVER | EverQuote | | Financials | 18.61 | 83 | -4.61% | 1.20% |
| FLNG | Flex LNG | | Energy | 26.10 | 49 | 0.77% | 1.20% |
| RVLV | Revolve Group | | Services & Goods | 19.43 | 68 | -1.87% | 1.20% |
| CERS | Cerus | | Health Care | 1.70 | 28 | 2.41% | 1.19% |
| LTC | LTC Properties | | Financials | 32.18 | 100 | -0.16% | 1.19% |
| AAT | American Assets | | Financials | 21.24 | 67 | -0.23% | 1.19% |
| BDC | Belden | | Industrials | 82.89 | 61 | -0.43% | 1.18% |
| FCBC | First Community | | Financials | 33.49 | 42 | -0.74% | 1.18% |
| BV | BrightView | | Industrials | 11.19 | 68 | -1.24% | 1.18% |
| JJSF | J & J Snack Foods | | Consumer Staples | 138.69 | 49 | -0.08% | 1.17% |
| SEER | Seer | | Health Care | 1.73 | 20 | -2.81% | 1.17% |
| MBWM | Mercantile Bank | | Financials | 36.49 | 35 | -1.08% | 1.16% |
| BOX | Box | | Technology | 26.98 | 76 | -1.10% | 1.16% |
| MOFG | MidWestOne Financial | | Financials | 20.99 | 35 | -2.14% | 1.16% |
| NL | NL Industries | | Services & Goods | 7.90 | 53 | -1.13% | 1.15% |
| SFM | Sprouts Farmers | | Services & Goods | 65.90 | 76 | 0.47% | 1.15% |
| EGAN | eGain | | Technology | 6.18 | 42 | -0.80% | 1.15% |
| IRMD | IRadimed | | Health Care | 41.47 | 76 | -2.29% | 1.15% |
| FRME | First Merchants | | Financials | 34.46 | 100 | -1.68% | 1.14% |
| CSTL | Castle Biosciences | | Health Care | 19.50 | 47 | -1.81% | 1.14% |
| TTI | TETRA | | Energy | 4.47 | 54 | 0.45% | 1.13% |
| MWA | Mueller Water | | Industrials | 16.15 | 93 | -0.80% | 1.13% |


| Too many stocks? View smallcap stocks filtered by marketcap & sector |
| Marketcap: All SmallCap Stocks (default-no microcap), Large, Mid-Range, Small |
| Smallcap Sector: Tech, Finance, Energy, Staples, Retail, Industrial, Materials, & Medical |
|
Get the most comprehensive stock market coverage daily at 12Stocks.com ➞ Best Stocks Today ➞ Best Stocks Weekly ➞ Best Stocks Year-to-Date ➞ Best Stocks Trends ➞  Best Stocks Today 12Stocks.com Best Nasdaq Stocks ➞ Best S&P 500 Stocks ➞ Best Tech Stocks ➞ Best Biotech Stocks ➞ |
| Detailed Overview of SmallCap Stocks |
| SmallCap Technical Overview, Leaders & Laggards, Top SmallCap ETF Funds & Detailed SmallCap Stocks List, Charts, Trends & More |
| Smallcap: Technical Analysis, Trends & YTD Performance | |
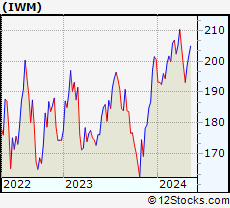
| SmallCap segment as represented by
IWM, an exchange-traded fund [ETF], holds basket of thousands of smallcap stocks from across all major sectors of the US stock market. The smallcap index (contains stocks like Riverbed & Sotheby's) is down by -2.11% and is currently underperforming the overall market by -7.27% year-to-date. Below is a quick view of technical charts and trends: | |
 IWM Weekly Chart |
|
| Long Term Trend: Good | |
| Medium Term Trend: Not Good | |
 IWM Daily Chart |
|
| Short Term Trend: Very Good | |
| Overall Trend Score: 44 | |
| YTD Performance: -2.11% | |
| **Trend Scores & Views Are Only For Educational Purposes And Not For Investing | |
| 12Stocks.com: Top Performing Small Cap Index Stocks | ||||||||||||||||||||||||||||||||||||||||||||||||
 The top performing Small Cap Index stocks year to date are
Now, more recently, over last week, the top performing Small Cap Index stocks on the move are


|
||||||||||||||||||||||||||||||||||||||||||||||||
| 12Stocks.com: Investing in Smallcap Index using Exchange Traded Funds | |
|
The following table shows list of key exchange traded funds (ETF) that
help investors track Smallcap index. The following list also includes leveraged ETF funds that track twice or thrice the daily returns of Smallcap indices. Short or inverse ETF funds move in the opposite direction to the index they track and are useful during market pullbacks or during bear markets. Quick View: Move mouse or cursor over ETF symbol (ticker) to view short-term technical chart and over ETF name to view long term chart. Click on ticker or stock name for detailed view. Click on to add stock symbol to your watchlist and to view watchlist. |
12Stocks.com List of ETFs that track Smallcap Index
| Ticker | ETF Name | Watchlist | Recent Price | Smart Investing & Trading Score | Change % | Week % | Year-to-date % |
| IWM | iShares Russell 2000 | | 196.48 | 44 | -0.61 | 1.73 | -2.11% |
| IJR | iShares Core S&P Small-Cap | | 104.86 | 78 | -0.80 | 1.59 | -3.13% |
| VTWO | Vanguard Russell 2000 ETF | | 79.45 | 63 | -0.60 | 1.75 | -2.03% |
| IWN | iShares Russell 2000 Value | | 150.18 | 68 | -0.73 | 1.62 | -3.32% |
| IWO | iShares Russell 2000 Growth | | 249.86 | 51 | -0.56 | 1.86 | -0.94% |
| IJS | iShares S&P Small-Cap 600 Value | | 96.69 | 60 | -1.04 | 1.13 | -6.19% |
| IJT | iShares S&P Small-Cap 600 Growth | | 125.06 | 63 | -0.25 | 2.33 | -0.06% |
| XSLV | PowerShares S&P SmallCap Low Volatil ETF | | 42.54 | 73 | -0.93 | 0.85 | -3.65% |
| SDD | ProShares UltraShort SmallCap600 | | 19.58 | 42 | 0.46 | -3.74 | 6.26% |
| SBB | ProShares Short SmallCap600 | | 16.50 | 40 | 0.79 | -2.02 | 3.58% |
| SMLV | SPDR SSGA US Small Cap Low Volatil ETF | | 107.33 | 73 | -1.01 | 1.17 | -4.61% |
| SAA | ProShares Ultra SmallCap600 | | 22.66 | 58 | -1.52 | 3.94 | -9.18% |
| 12Stocks.com: Charts, Trends, Fundamental Data and Performances of SmallCap Stocks | |
|
We now take in-depth look at all SmallCap stocks including charts, multi-period performances and overall trends (as measured by Smart Investing & Trading Score). One can sort SmallCap stocks (click link to choose) by Daily, Weekly and by Year-to-Date performances. Also, one can sort by size of the company or by market capitalization. |
| Select Your Default Chart Type: | |||||
| |||||
| Click on stock symbol or name for detailed view. Click on to add stock symbol to your watchlist and to view watchlist. Quick View: Move mouse or cursor over "Daily" to quickly view daily technical stock chart and over "Weekly" to view weekly technical stock chart. | |||||

 | PLYM Plymouth Industrial REIT, Inc. |
| Sector: Financials | |
| SubSector: REIT - Industrial | |
| MarketCap: 153.449 Millions | |
| Recent Price: 20.58 Smart Investing & Trading Score: 35 | |
| Day Percent Change: -1.25% Day Change: -0.26 | |
| Week Change: 1.23% Year-to-date Change: -14.5% | |
| PLYM Links: Profile News Message Board | |
| Charts:- Daily , Weekly | |
| Add PLYM to Watchlist: View: Get Complete PLYM Trend Analysis ➞ | |
 | BOH Bank of Hawaii Corporation |
| Sector: Financials | |
| SubSector: Regional - Pacific Banks | |
| MarketCap: 2305.19 Millions | |
| Recent Price: 59.11 Smart Investing & Trading Score: 40 | |
| Day Percent Change: 0.75% Day Change: 0.44 | |
| Week Change: 1.22% Year-to-date Change: -18.4% | |
| BOH Links: Profile News Message Board | |
| Charts:- Daily , Weekly | |
| Add BOH to Watchlist: View: Get Complete BOH Trend Analysis ➞ | |
 | SEM Select Medical Holdings Corporation |
| Sector: Health Care | |
| SubSector: Hospitals | |
| MarketCap: 1765.96 Millions | |
| Recent Price: 27.39 Smart Investing & Trading Score: 61 | |
| Day Percent Change: -1.19% Day Change: -0.33 | |
| Week Change: 1.22% Year-to-date Change: 16.6% | |
| SEM Links: Profile News Message Board | |
| Charts:- Daily , Weekly | |
| Add SEM to Watchlist: View: Get Complete SEM Trend Analysis ➞ | |
 | EVER EverQuote, Inc. |
| Sector: Financials | |
| SubSector: Regional - Southeast Banks | |
| MarketCap: 767.135 Millions | |
| Recent Price: 18.61 Smart Investing & Trading Score: 83 | |
| Day Percent Change: -4.61% Day Change: -0.90 | |
| Week Change: 1.2% Year-to-date Change: 52.0% | |
| EVER Links: Profile News Message Board | |
| Charts:- Daily , Weekly | |
| Add EVER to Watchlist: View: Get Complete EVER Trend Analysis ➞ | |
 | FLNG Flex LNG Ltd. |
| Sector: Energy | |
| SubSector: Oil & Gas Equipment & Services | |
| MarketCap: 220.261 Millions | |
| Recent Price: 26.10 Smart Investing & Trading Score: 49 | |
| Day Percent Change: 0.77% Day Change: 0.20 | |
| Week Change: 1.2% Year-to-date Change: -10.2% | |
| FLNG Links: Profile News Message Board | |
| Charts:- Daily , Weekly | |
| Add FLNG to Watchlist: View: Get Complete FLNG Trend Analysis ➞ | |
 | RVLV Revolve Group, Inc. |
| Sector: Services & Goods | |
| SubSector: Specialty Retail, Other | |
| MarketCap: 652.244 Millions | |
| Recent Price: 19.43 Smart Investing & Trading Score: 68 | |
| Day Percent Change: -1.87% Day Change: -0.37 | |
| Week Change: 1.2% Year-to-date Change: 17.2% | |
| RVLV Links: Profile News Message Board | |
| Charts:- Daily , Weekly | |
| Add RVLV to Watchlist: View: Get Complete RVLV Trend Analysis ➞ | |
 | CERS Cerus Corporation |
| Sector: Health Care | |
| SubSector: Biotechnology | |
| MarketCap: 607.185 Millions | |
| Recent Price: 1.70 Smart Investing & Trading Score: 28 | |
| Day Percent Change: 2.41% Day Change: 0.04 | |
| Week Change: 1.19% Year-to-date Change: -21.3% | |
| CERS Links: Profile News Message Board | |
| Charts:- Daily , Weekly | |
| Add CERS to Watchlist: View: Get Complete CERS Trend Analysis ➞ | |
 | LTC LTC Properties, Inc. |
| Sector: Financials | |
| SubSector: REIT - Healthcare Facilities | |
| MarketCap: 1369.24 Millions | |
| Recent Price: 32.18 Smart Investing & Trading Score: 100 | |
| Day Percent Change: -0.16% Day Change: -0.05 | |
| Week Change: 1.19% Year-to-date Change: 0.2% | |
| LTC Links: Profile News Message Board | |
| Charts:- Daily , Weekly | |
| Add LTC to Watchlist: View: Get Complete LTC Trend Analysis ➞ | |
 | AAT American Assets Trust, Inc. |
| Sector: Financials | |
| SubSector: REIT - Retail | |
| MarketCap: 1580.54 Millions | |
| Recent Price: 21.24 Smart Investing & Trading Score: 67 | |
| Day Percent Change: -0.23% Day Change: -0.05 | |
| Week Change: 1.19% Year-to-date Change: -5.6% | |
| AAT Links: Profile News Message Board | |
| Charts:- Daily , Weekly | |
| Add AAT to Watchlist: View: Get Complete AAT Trend Analysis ➞ | |
 | BDC Belden Inc. |
| Sector: Industrials | |
| SubSector: Industrial Electrical Equipment | |
| MarketCap: 1490.59 Millions | |
| Recent Price: 82.89 Smart Investing & Trading Score: 61 | |
| Day Percent Change: -0.43% Day Change: -0.36 | |
| Week Change: 1.18% Year-to-date Change: 7.3% | |
| BDC Links: Profile News Message Board | |
| Charts:- Daily , Weekly | |
| Add BDC to Watchlist: View: Get Complete BDC Trend Analysis ➞ | |
 | FCBC First Community Bankshares, Inc. |
| Sector: Financials | |
| SubSector: Regional - Mid-Atlantic Banks | |
| MarketCap: 393.459 Millions | |
| Recent Price: 33.49 Smart Investing & Trading Score: 42 | |
| Day Percent Change: -0.74% Day Change: -0.25 | |
| Week Change: 1.18% Year-to-date Change: -9.7% | |
| FCBC Links: Profile News Message Board | |
| Charts:- Daily , Weekly | |
| Add FCBC to Watchlist: View: Get Complete FCBC Trend Analysis ➞ | |
 | BV BrightView Holdings, Inc. |
| Sector: Industrials | |
| SubSector: General Contractors | |
| MarketCap: 973.763 Millions | |
| Recent Price: 11.19 Smart Investing & Trading Score: 68 | |
| Day Percent Change: -1.24% Day Change: -0.14 | |
| Week Change: 1.18% Year-to-date Change: 32.9% | |
| BV Links: Profile News Message Board | |
| Charts:- Daily , Weekly | |
| Add BV to Watchlist: View: Get Complete BV Trend Analysis ➞ | |
 | JJSF J & J Snack Foods Corp. |
| Sector: Consumer Staples | |
| SubSector: Processed & Packaged Goods | |
| MarketCap: 2706.28 Millions | |
| Recent Price: 138.69 Smart Investing & Trading Score: 49 | |
| Day Percent Change: -0.08% Day Change: -0.11 | |
| Week Change: 1.17% Year-to-date Change: -17.0% | |
| JJSF Links: Profile News Message Board | |
| Charts:- Daily , Weekly | |
| Add JJSF to Watchlist: View: Get Complete JJSF Trend Analysis ➞ | |
 | SEER Seer, Inc. |
| Sector: Health Care | |
| SubSector: Biotechnology | |
| MarketCap: 48287 Millions | |
| Recent Price: 1.73 Smart Investing & Trading Score: 20 | |
| Day Percent Change: -2.81% Day Change: -0.05 | |
| Week Change: 1.17% Year-to-date Change: -11.3% | |
| SEER Links: Profile News Message Board | |
| Charts:- Daily , Weekly | |
| Add SEER to Watchlist: View: Get Complete SEER Trend Analysis ➞ | |
 | MBWM Mercantile Bank Corporation |
| Sector: Financials | |
| SubSector: Regional - Midwest Banks | |
| MarketCap: 372.77 Millions | |
| Recent Price: 36.49 Smart Investing & Trading Score: 35 | |
| Day Percent Change: -1.08% Day Change: -0.40 | |
| Week Change: 1.16% Year-to-date Change: -9.6% | |
| MBWM Links: Profile News Message Board | |
| Charts:- Daily , Weekly | |
| Add MBWM to Watchlist: View: Get Complete MBWM Trend Analysis ➞ | |
 | BOX Box, Inc. |
| Sector: Technology | |
| SubSector: Application Software | |
| MarketCap: 2154.42 Millions | |
| Recent Price: 26.98 Smart Investing & Trading Score: 76 | |
| Day Percent Change: -1.10% Day Change: -0.30 | |
| Week Change: 1.16% Year-to-date Change: 5.4% | |
| BOX Links: Profile News Message Board | |
| Charts:- Daily , Weekly | |
| Add BOX to Watchlist: View: Get Complete BOX Trend Analysis ➞ | |
 | MOFG MidWestOne Financial Group, Inc. |
| Sector: Financials | |
| SubSector: Regional - Southwest Banks | |
| MarketCap: 345.265 Millions | |
| Recent Price: 20.99 Smart Investing & Trading Score: 35 | |
| Day Percent Change: -2.14% Day Change: -0.46 | |
| Week Change: 1.16% Year-to-date Change: -22.0% | |
| MOFG Links: Profile News Message Board | |
| Charts:- Daily , Weekly | |
| Add MOFG to Watchlist: View: Get Complete MOFG Trend Analysis ➞ | |
 | NL NL Industries, Inc. |
| Sector: Services & Goods | |
| SubSector: Industrial Equipment Wholesale | |
| MarketCap: 126.258 Millions | |
| Recent Price: 7.90 Smart Investing & Trading Score: 53 | |
| Day Percent Change: -1.13% Day Change: -0.09 | |
| Week Change: 1.15% Year-to-date Change: 40.8% | |
| NL Links: Profile News Message Board | |
| Charts:- Daily , Weekly | |
| Add NL to Watchlist: View: Get Complete NL Trend Analysis ➞ | |
 | SFM Sprouts Farmers Market, Inc. |
| Sector: Services & Goods | |
| SubSector: Grocery Stores | |
| MarketCap: 2495.85 Millions | |
| Recent Price: 65.90 Smart Investing & Trading Score: 76 | |
| Day Percent Change: 0.47% Day Change: 0.31 | |
| Week Change: 1.15% Year-to-date Change: 37.0% | |
| SFM Links: Profile News Message Board | |
| Charts:- Daily , Weekly | |
| Add SFM to Watchlist: View: Get Complete SFM Trend Analysis ➞ | |
 | EGAN eGain Corporation |
| Sector: Technology | |
| SubSector: Business Software & Services | |
| MarketCap: 201.458 Millions | |
| Recent Price: 6.18 Smart Investing & Trading Score: 42 | |
| Day Percent Change: -0.80% Day Change: -0.05 | |
| Week Change: 1.15% Year-to-date Change: -25.8% | |
| EGAN Links: Profile News Message Board | |
| Charts:- Daily , Weekly | |
| Add EGAN to Watchlist: View: Get Complete EGAN Trend Analysis ➞ | |
 | IRMD IRadimed Corporation |
| Sector: Health Care | |
| SubSector: Medical Appliances & Equipment | |
| MarketCap: 207.78 Millions | |
| Recent Price: 41.47 Smart Investing & Trading Score: 76 | |
| Day Percent Change: -2.29% Day Change: -0.97 | |
| Week Change: 1.15% Year-to-date Change: -12.6% | |
| IRMD Links: Profile News Message Board | |
| Charts:- Daily , Weekly | |
| Add IRMD to Watchlist: View: Get Complete IRMD Trend Analysis ➞ | |
 | FRME First Merchants Corporation |
| Sector: Financials | |
| SubSector: Regional - Midwest Banks | |
| MarketCap: 1490.4 Millions | |
| Recent Price: 34.46 Smart Investing & Trading Score: 100 | |
| Day Percent Change: -1.68% Day Change: -0.59 | |
| Week Change: 1.14% Year-to-date Change: -7.1% | |
| FRME Links: Profile News Message Board | |
| Charts:- Daily , Weekly | |
| Add FRME to Watchlist: View: Get Complete FRME Trend Analysis ➞ | |
 | CSTL Castle Biosciences, Inc. |
| Sector: Health Care | |
| SubSector: Medical Laboratories & Research | |
| MarketCap: 545 Millions | |
| Recent Price: 19.50 Smart Investing & Trading Score: 47 | |
| Day Percent Change: -1.81% Day Change: -0.36 | |
| Week Change: 1.14% Year-to-date Change: -9.6% | |
| CSTL Links: Profile News Message Board | |
| Charts:- Daily , Weekly | |
| Add CSTL to Watchlist: View: Get Complete CSTL Trend Analysis ➞ | |
 | TTI TETRA Technologies, Inc. |
| Sector: Energy | |
| SubSector: Oil & Gas Equipment & Services | |
| MarketCap: 56.9461 Millions | |
| Recent Price: 4.47 Smart Investing & Trading Score: 54 | |
| Day Percent Change: 0.45% Day Change: 0.02 | |
| Week Change: 1.13% Year-to-date Change: -1.1% | |
| TTI Links: Profile News Message Board | |
| Charts:- Daily , Weekly | |
| Add TTI to Watchlist: View: Get Complete TTI Trend Analysis ➞ | |
 | MWA Mueller Water Products, Inc. |
| Sector: Industrials | |
| SubSector: Industrial Equipment & Components | |
| MarketCap: 1321.09 Millions | |
| Recent Price: 16.15 Smart Investing & Trading Score: 93 | |
| Day Percent Change: -0.80% Day Change: -0.13 | |
| Week Change: 1.13% Year-to-date Change: 12.2% | |
| MWA Links: Profile News Message Board | |
| Charts:- Daily , Weekly | |
| Add MWA to Watchlist: View: Get Complete MWA Trend Analysis ➞ | |
| Too many stocks? View smallcap stocks filtered by marketcap & sector |
| Marketcap: All SmallCap Stocks (default-no microcap), Large, Mid-Range, Small & MicroCap |
| Sector: Tech, Finance, Energy, Staples, Retail, Industrial, Materials, Utilities & Medical |
|
Best Stocks Today 12Stocks.com |
© 2024 12Stocks.com Terms & Conditions Privacy Contact Us
All Information Provided Only For Education And Not To Be Used For Investing or Trading. See Terms & Conditions


One More Thing ... Get Best Stocks Delivered Daily!
Never Ever Miss A Move With Our Top Ten Stocks Lists
Find Best Stocks In Any Market - Bull or Bear Market
Take A Peek At Our Top Ten Stocks Lists: Daily, Weekly, Year-to-Date & Top Trends
Find Best Stocks In Any Market - Bull or Bear Market
Take A Peek At Our Top Ten Stocks Lists: Daily, Weekly, Year-to-Date & Top Trends
Smallcap Stocks With Best Up Trends [0-bearish to 100-bullish]: B. Riley[100], Central Pacific[100], California Water[100], Cricut [100], Carpenter [100], Haemonetics [100], Sanmina [100], Trustmark [100], Comstock Resources[100], EchoStar [100], Mueller Industries[100]
Best Smallcap Stocks Year-to-Date:
CareMax [490.72%], Janux [338.34%], Viking [270.02%], Alpine Immune[239.52%], Longboard [218%], Super Micro[177%], Arcutis Bio[166.56%], Avidity Biosciences[159.79%], Vera [149.94%], Hippo [128.87%], Stoke [122.15%] Best Smallcap Stocks This Week:
Matterport [168.97%], B. Riley[73.54%], Impinj [33.73%], ProKidney [32.84%], Seres [32.65%], Riot Blockchain[32.64%], Ribbon [25.58%], Cullinan Oncology[22.92%], P.A.M. Transportation[22.85%], NuScale Power[21.44%], Hibbett Sports[21.03%] Best Smallcap Stocks Daily:
Impinj [28.65%], P.A.M. Transportation[17.95%], B. Riley[16.61%], Strategic Education[16.28%], OptiNose [14.56%], JELD-WEN Holding[11.54%], Sonic Automotive[10.86%], Intevac [10.54%], SiTime [8.84%], Noodles & [8.08%], ProKidney [7.75%]