
 Login Sign Up


| |||||
 |  | ||||

| 12Stocks.com Market Intelligence |
Best SmallCap Stocks
|
| In a hurry? Small Cap Stock Lists: Performance Trends Table, Stock Charts
Sort Small Cap stocks: Daily, Weekly, Year-to-Date, Market Cap & Trends. Filter Small Cap stocks list by sector: Show all, Tech, Finance, Energy, Staples, Retail, Industrial, Materials, Utilities and HealthCare Filter Small Cap stocks list by size: All Large Medium Small and MicroCap |
| 12Stocks.com Small Cap Stocks Performances & Trends Daily | |||||||||
|
|  The overall Smart Investing & Trading Score is 58 (0-bearish to 100-bullish) which puts Small Cap index in short term neutral trend. The Smart Investing & Trading Score from previous trading session is 23 and hence an improvement of trend.
| ||||||||
Here are the Smart Investing & Trading Scores of the most requested small cap stocks at 12Stocks.com (click stock name for detailed review):
|


| 12Stocks.com: Investing in Smallcap Index with Stocks | |
|
The following table helps investors and traders sort through current performance and trends (as measured by Smart Investing & Trading Score) of various
stocks in the Smallcap Index. Quick View: Move mouse or cursor over stock symbol (ticker) to view short-term technical chart and over stock name to view long term chart. Click on  to add stock symbol to your watchlist and to add stock symbol to your watchlist and  to view watchlist. Click on any ticker or stock name for detailed market intelligence report for that stock. to view watchlist. Click on any ticker or stock name for detailed market intelligence report for that stock. |
12Stocks.com Performance of Stocks in Smallcap Index
| Ticker | Stock Name | Watchlist | Category | Recent Price | Smart Investing & Trading Score | Change % | Weekly Change% |
| SDGR | Schrodinger |   | Health Care | 24.49 | 10 | 0.74% | 0.74% |
| WEAV | Weave | | Technology | 10.89 | 18 | 0.74% | 0.74% |
| PFBC | Preferred Bank | | Financials | 74.84 | 90 | 0.73% | 0.73% |
| SWI | SolarWinds | | Technology | 10.98 | 32 | 0.73% | 0.73% |
| CARS | Cars.com | | Services & Goods | 16.56 | 42 | 0.73% | 0.73% |
| SITC | SITE Centers | | Financials | 13.75 | 68 | 0.73% | 0.73% |
| GIII | G-III Apparel | | Consumer Staples | 27.84 | 42 | 0.72% | 0.72% |
| UFPI | Universal Forest | | Industrials | 112.58 | 45 | 0.71% | 0.71% |
| CWST | Casella Waste | | Industrials | 94.09 | 76 | 0.71% | 0.71% |
| WTS | Watts Water | | Industrials | 204.66 | 83 | 0.71% | 0.71% |
| PRFT | Perficient | | Technology | 45.12 | 42 | 0.71% | 0.71% |
| CVLT | Commvault Systems | | Technology | 95.54 | 63 | 0.71% | 0.71% |
| QCRH | QCR | | Financials | 57.77 | 67 | 0.71% | 0.71% |
| MYRG | MYR Group | | Industrials | 159.84 | 49 | 0.71% | 0.71% |
| ONEW | OneWater Marine | | Services & Goods | 24.00 | 27 | 0.71% | 0.71% |
| VIGL | Vigil Neuroscience | | Health Care | 2.84 | 46 | 0.71% | 0.71% |
| RNST | Renasant | | Financials | 30.01 | 67 | 0.70% | 0.70% |
| CTBI | Community Trust | | Financials | 42.11 | 100 | 0.69% | 0.69% |
| SCL | Stepan | | Materials | 84.75 | 49 | 0.69% | 0.69% |
| FCF | First Commonwealth | | Financials | 13.29 | 67 | 0.68% | 0.68% |
| DHIL | Diamond Hill | | Financials | 151.86 | 74 | 0.68% | 0.68% |
| RGCO | RGC Resources | | Utilities | 19.36 | 61 | 0.68% | 0.68% |
| GPMT | Granite Point | | Financials | 4.42 | 42 | 0.68% | 0.68% |
| DBI | Designer Brands | | Services & Goods | 8.85 | 65 | 0.68% | 0.68% |
| AMTB | Amerant Bancorp | | Financials | 22.33 | 67 | 0.68% | 0.68% |


| Too many stocks? View smallcap stocks filtered by marketcap & sector |
| Marketcap: All SmallCap Stocks (default-no microcap), Large, Mid-Range, Small |
| Smallcap Sector: Tech, Finance, Energy, Staples, Retail, Industrial, Materials, & Medical |
|
Get the most comprehensive stock market coverage daily at 12Stocks.com ➞ Best Stocks Today ➞ Best Stocks Weekly ➞ Best Stocks Year-to-Date ➞ Best Stocks Trends ➞  Best Stocks Today 12Stocks.com Best Nasdaq Stocks ➞ Best S&P 500 Stocks ➞ Best Tech Stocks ➞ Best Biotech Stocks ➞ |
| Detailed Overview of SmallCap Stocks |
| SmallCap Technical Overview, Leaders & Laggards, Top SmallCap ETF Funds & Detailed SmallCap Stocks List, Charts, Trends & More |
| Smallcap: Technical Analysis, Trends & YTD Performance | |
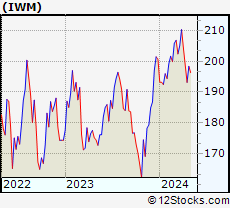
| SmallCap segment as represented by
IWM, an exchange-traded fund [ETF], holds basket of thousands of smallcap stocks from across all major sectors of the US stock market. The smallcap index (contains stocks like Riverbed & Sotheby's) is down by -2.7% and is currently underperforming the overall market by -7.09% year-to-date. Below is a quick view of technical charts and trends: | |
 IWM Weekly Chart |
|
| Long Term Trend: Good | |
| Medium Term Trend: Not Good | |
 IWM Daily Chart |
|
| Short Term Trend: Very Good | |
| Overall Trend Score: 58 | |
| YTD Performance: -2.7% | |
| **Trend Scores & Views Are Only For Educational Purposes And Not For Investing | |
| 12Stocks.com: Top Performing Small Cap Index Stocks | ||||||||||||||||||||||||||||||||||||||||||||||||
 The top performing Small Cap Index stocks year to date are
Now, more recently, over last week, the top performing Small Cap Index stocks on the move are


|
||||||||||||||||||||||||||||||||||||||||||||||||
| 12Stocks.com: Investing in Smallcap Index using Exchange Traded Funds | |
|
The following table shows list of key exchange traded funds (ETF) that
help investors track Smallcap index. The following list also includes leveraged ETF funds that track twice or thrice the daily returns of Smallcap indices. Short or inverse ETF funds move in the opposite direction to the index they track and are useful during market pullbacks or during bear markets. Quick View: Move mouse or cursor over ETF symbol (ticker) to view short-term technical chart and over ETF name to view long term chart. Click on ticker or stock name for detailed view. Click on to add stock symbol to your watchlist and to view watchlist. |
12Stocks.com List of ETFs that track Smallcap Index
| Ticker | ETF Name | Watchlist | Recent Price | Smart Investing & Trading Score | Change % | Week % | Year-to-date % |
| IWM | iShares Russell 2000 | | 195.30 | 58 | 1.12 | 1.12 | -2.7% |
| VTWO | Vanguard Russell 2000 ETF | | 78.92 | 58 | 1.08 | 1.08 | -2.69% |
| IWN | iShares Russell 2000 Value | | 149.51 | 63 | 1.17 | 1.17 | -3.75% |
| IJR | iShares Core S&P Small-Cap | | 103.47 | 45 | 0.24 | 0.24 | -4.42% |
| IWO | iShares Russell 2000 Growth | | 247.92 | 51 | 1.07 | 1.07 | -1.7% |
| IJS | iShares S&P Small-Cap 600 Value | | 96.43 | 32 | 0.86 | 0.86 | -6.44% |
| IJT | iShares S&P Small-Cap 600 Growth | | 123.36 | 70 | 0.94 | 0.94 | -1.42% |
| XSLV | PowerShares S&P SmallCap Low Volatil ETF | | 42.44 | 62 | 0.62 | 0.62 | -3.87% |
| SMLV | SPDR SSGA US Small Cap Low Volatil ETF | | 107.48 | 80 | 1.31 | 1.31 | -4.48% |
| SDD | ProShares UltraShort SmallCap600 | | 19.75 | 42 | -2.90 | -2.9 | 7.18% |
| SBB | ProShares Short SmallCap600 | | 16.62 | 42 | -1.31 | -1.31 | 4.33% |
| SAA | ProShares Ultra SmallCap600 | | 22.37 | 32 | 2.61 | 2.61 | -10.34% |
| 12Stocks.com: Charts, Trends, Fundamental Data and Performances of SmallCap Stocks | |
|
We now take in-depth look at all SmallCap stocks including charts, multi-period performances and overall trends (as measured by Smart Investing & Trading Score). One can sort SmallCap stocks (click link to choose) by Daily, Weekly and by Year-to-Date performances. Also, one can sort by size of the company or by market capitalization. |
| Select Your Default Chart Type: | |||||
| |||||
| Click on stock symbol or name for detailed view. Click on to add stock symbol to your watchlist and to view watchlist. Quick View: Move mouse or cursor over "Daily" to quickly view daily technical stock chart and over "Weekly" to view weekly technical stock chart. | |||||

 | SDGR Schrodinger, Inc. |
| Sector: Health Care | |
| SubSector: Health Information Services | |
| MarketCap: 47287 Millions | |
| Recent Price: 24.49 Smart Investing & Trading Score: 10 | |
| Day Percent Change: 0.74% Day Change: 0.18 | |
| Week Change: 0.74% Year-to-date Change: -31.6% | |
| SDGR Links: Profile News Message Board | |
| Charts:- Daily , Weekly | |
| Add SDGR to Watchlist: View: Get Complete SDGR Trend Analysis ➞ | |
 | WEAV Weave Communications, Inc. |
| Sector: Technology | |
| SubSector: Software - Application | |
| MarketCap: 740 Millions | |
| Recent Price: 10.89 Smart Investing & Trading Score: 18 | |
| Day Percent Change: 0.74% Day Change: 0.08 | |
| Week Change: 0.74% Year-to-date Change: -6.3% | |
| WEAV Links: Profile News Message Board | |
| Charts:- Daily , Weekly | |
| Add WEAV to Watchlist: View: Get Complete WEAV Trend Analysis ➞ | |
 | PFBC Preferred Bank |
| Sector: Financials | |
| SubSector: Regional - Pacific Banks | |
| MarketCap: 559.629 Millions | |
| Recent Price: 74.84 Smart Investing & Trading Score: 90 | |
| Day Percent Change: 0.73% Day Change: 0.54 | |
| Week Change: 0.73% Year-to-date Change: 2.5% | |
| PFBC Links: Profile News Message Board | |
| Charts:- Daily , Weekly | |
| Add PFBC to Watchlist: View: Get Complete PFBC Trend Analysis ➞ | |
 | SWI SolarWinds Corporation |
| Sector: Technology | |
| SubSector: Application Software | |
| MarketCap: 4524.62 Millions | |
| Recent Price: 10.98 Smart Investing & Trading Score: 32 | |
| Day Percent Change: 0.73% Day Change: 0.08 | |
| Week Change: 0.73% Year-to-date Change: -12.1% | |
| SWI Links: Profile News Message Board | |
| Charts:- Daily , Weekly | |
| Add SWI to Watchlist: View: Get Complete SWI Trend Analysis ➞ | |
 | CARS Cars.com Inc. |
| Sector: Services & Goods | |
| SubSector: Auto Dealerships | |
| MarketCap: 290.321 Millions | |
| Recent Price: 16.56 Smart Investing & Trading Score: 42 | |
| Day Percent Change: 0.73% Day Change: 0.12 | |
| Week Change: 0.73% Year-to-date Change: -12.7% | |
| CARS Links: Profile News Message Board | |
| Charts:- Daily , Weekly | |
| Add CARS to Watchlist: View: Get Complete CARS Trend Analysis ➞ | |
 | SITC SITE Centers Corp. |
| Sector: Financials | |
| SubSector: REIT - Retail | |
| MarketCap: 1449.54 Millions | |
| Recent Price: 13.75 Smart Investing & Trading Score: 68 | |
| Day Percent Change: 0.73% Day Change: 0.10 | |
| Week Change: 0.73% Year-to-date Change: 0.9% | |
| SITC Links: Profile News Message Board | |
| Charts:- Daily , Weekly | |
| Add SITC to Watchlist: View: Get Complete SITC Trend Analysis ➞ | |
 | GIII G-III Apparel Group, Ltd. |
| Sector: Consumer Staples | |
| SubSector: Textile - Apparel Clothing | |
| MarketCap: 354.365 Millions | |
| Recent Price: 27.84 Smart Investing & Trading Score: 42 | |
| Day Percent Change: 0.72% Day Change: 0.20 | |
| Week Change: 0.72% Year-to-date Change: -18.1% | |
| GIII Links: Profile News Message Board | |
| Charts:- Daily , Weekly | |
| Add GIII to Watchlist: View: Get Complete GIII Trend Analysis ➞ | |
 | UFPI Universal Forest Products, Inc. |
| Sector: Industrials | |
| SubSector: Lumber, Wood Production | |
| MarketCap: 2263.38 Millions | |
| Recent Price: 112.58 Smart Investing & Trading Score: 45 | |
| Day Percent Change: 0.71% Day Change: 0.79 | |
| Week Change: 0.71% Year-to-date Change: -10.3% | |
| UFPI Links: Profile News Message Board | |
| Charts:- Daily , Weekly | |
| Add UFPI to Watchlist: View: Get Complete UFPI Trend Analysis ➞ | |
 | CWST Casella Waste Systems, Inc. |
| Sector: Industrials | |
| SubSector: Waste Management | |
| MarketCap: 2093.38 Millions | |
| Recent Price: 94.09 Smart Investing & Trading Score: 76 | |
| Day Percent Change: 0.71% Day Change: 0.66 | |
| Week Change: 0.71% Year-to-date Change: 10.1% | |
| CWST Links: Profile News Message Board | |
| Charts:- Daily , Weekly | |
| Add CWST to Watchlist: View: Get Complete CWST Trend Analysis ➞ | |
 | WTS Watts Water Technologies, Inc. |
| Sector: Industrials | |
| SubSector: Industrial Equipment & Components | |
| MarketCap: 2903.29 Millions | |
| Recent Price: 204.66 Smart Investing & Trading Score: 83 | |
| Day Percent Change: 0.71% Day Change: 1.45 | |
| Week Change: 0.71% Year-to-date Change: -1.8% | |
| WTS Links: Profile News Message Board | |
| Charts:- Daily , Weekly | |
| Add WTS to Watchlist: View: Get Complete WTS Trend Analysis ➞ | |
 | PRFT Perficient, Inc. |
| Sector: Technology | |
| SubSector: Information Technology Services | |
| MarketCap: 1005.68 Millions | |
| Recent Price: 45.12 Smart Investing & Trading Score: 42 | |
| Day Percent Change: 0.71% Day Change: 0.32 | |
| Week Change: 0.71% Year-to-date Change: -31.5% | |
| PRFT Links: Profile News Message Board | |
| Charts:- Daily , Weekly | |
| Add PRFT to Watchlist: View: Get Complete PRFT Trend Analysis ➞ | |
 | CVLT Commvault Systems, Inc. |
| Sector: Technology | |
| SubSector: Application Software | |
| MarketCap: 1607.22 Millions | |
| Recent Price: 95.54 Smart Investing & Trading Score: 63 | |
| Day Percent Change: 0.71% Day Change: 0.67 | |
| Week Change: 0.71% Year-to-date Change: 19.7% | |
| CVLT Links: Profile News Message Board | |
| Charts:- Daily , Weekly | |
| Add CVLT to Watchlist: View: Get Complete CVLT Trend Analysis ➞ | |
 | QCRH QCR Holdings, Inc. |
| Sector: Financials | |
| SubSector: Regional - Southwest Banks | |
| MarketCap: 465.765 Millions | |
| Recent Price: 57.77 Smart Investing & Trading Score: 67 | |
| Day Percent Change: 0.71% Day Change: 0.41 | |
| Week Change: 0.71% Year-to-date Change: -1.1% | |
| QCRH Links: Profile News Message Board | |
| Charts:- Daily , Weekly | |
| Add QCRH to Watchlist: View: Get Complete QCRH Trend Analysis ➞ | |
 | MYRG MYR Group Inc. |
| Sector: Industrials | |
| SubSector: General Contractors | |
| MarketCap: 405.363 Millions | |
| Recent Price: 159.84 Smart Investing & Trading Score: 49 | |
| Day Percent Change: 0.71% Day Change: 1.13 | |
| Week Change: 0.71% Year-to-date Change: 10.5% | |
| MYRG Links: Profile News Message Board | |
| Charts:- Daily , Weekly | |
| Add MYRG to Watchlist: View: Get Complete MYRG Trend Analysis ➞ | |
 | ONEW OneWater Marine Inc. |
| Sector: Services & Goods | |
| SubSector: Recreational Vehicles | |
| MarketCap: 42027 Millions | |
| Recent Price: 24.00 Smart Investing & Trading Score: 27 | |
| Day Percent Change: 0.71% Day Change: 0.17 | |
| Week Change: 0.71% Year-to-date Change: -29.0% | |
| ONEW Links: Profile News Message Board | |
| Charts:- Daily , Weekly | |
| Add ONEW to Watchlist: View: Get Complete ONEW Trend Analysis ➞ | |
 | VIGL Vigil Neuroscience, Inc. |
| Sector: Health Care | |
| SubSector: Biotechnology | |
| MarketCap: 339 Millions | |
| Recent Price: 2.84 Smart Investing & Trading Score: 46 | |
| Day Percent Change: 0.71% Day Change: 0.02 | |
| Week Change: 0.71% Year-to-date Change: -17.2% | |
| VIGL Links: Profile News Message Board | |
| Charts:- Daily , Weekly | |
| Add VIGL to Watchlist: View: Get Complete VIGL Trend Analysis ➞ | |
 | RNST Renasant Corporation |
| Sector: Financials | |
| SubSector: Money Center Banks | |
| MarketCap: 1279.39 Millions | |
| Recent Price: 30.01 Smart Investing & Trading Score: 67 | |
| Day Percent Change: 0.70% Day Change: 0.21 | |
| Week Change: 0.7% Year-to-date Change: -10.9% | |
| RNST Links: Profile News Message Board | |
| Charts:- Daily , Weekly | |
| Add RNST to Watchlist: View: Get Complete RNST Trend Analysis ➞ | |
 | CTBI Community Trust Bancorp, Inc. |
| Sector: Financials | |
| SubSector: Regional - Southeast Banks | |
| MarketCap: 608.435 Millions | |
| Recent Price: 42.11 Smart Investing & Trading Score: 100 | |
| Day Percent Change: 0.69% Day Change: 0.29 | |
| Week Change: 0.69% Year-to-date Change: -4.0% | |
| CTBI Links: Profile News Message Board | |
| Charts:- Daily , Weekly | |
| Add CTBI to Watchlist: View: Get Complete CTBI Trend Analysis ➞ | |
 | SCL Stepan Company |
| Sector: Materials | |
| SubSector: Specialty Chemicals | |
| MarketCap: 1812.97 Millions | |
| Recent Price: 84.75 Smart Investing & Trading Score: 49 | |
| Day Percent Change: 0.69% Day Change: 0.58 | |
| Week Change: 0.69% Year-to-date Change: -10.4% | |
| SCL Links: Profile News Message Board | |
| Charts:- Daily , Weekly | |
| Add SCL to Watchlist: View: Get Complete SCL Trend Analysis ➞ | |
 | FCF First Commonwealth Financial Corporation |
| Sector: Financials | |
| SubSector: Regional - Northeast Banks | |
| MarketCap: 900.299 Millions | |
| Recent Price: 13.29 Smart Investing & Trading Score: 67 | |
| Day Percent Change: 0.68% Day Change: 0.09 | |
| Week Change: 0.68% Year-to-date Change: -13.9% | |
| FCF Links: Profile News Message Board | |
| Charts:- Daily , Weekly | |
| Add FCF to Watchlist: View: Get Complete FCF Trend Analysis ➞ | |
 | DHIL Diamond Hill Investment Group, Inc. |
| Sector: Financials | |
| SubSector: Asset Management | |
| MarketCap: 316.203 Millions | |
| Recent Price: 151.86 Smart Investing & Trading Score: 74 | |
| Day Percent Change: 0.68% Day Change: 1.03 | |
| Week Change: 0.68% Year-to-date Change: -8.3% | |
| DHIL Links: Profile News Message Board | |
| Charts:- Daily , Weekly | |
| Add DHIL to Watchlist: View: Get Complete DHIL Trend Analysis ➞ | |
 | RGCO RGC Resources, Inc. |
| Sector: Utilities | |
| SubSector: Gas Utilities | |
| MarketCap: 215.277 Millions | |
| Recent Price: 19.36 Smart Investing & Trading Score: 61 | |
| Day Percent Change: 0.68% Day Change: 0.13 | |
| Week Change: 0.68% Year-to-date Change: -4.8% | |
| RGCO Links: Profile News Message Board | |
| Charts:- Daily , Weekly | |
| Add RGCO to Watchlist: View: Get Complete RGCO Trend Analysis ➞ | |
 | GPMT Granite Point Mortgage Trust Inc. |
| Sector: Financials | |
| SubSector: Mortgage Investment | |
| MarketCap: 289.739 Millions | |
| Recent Price: 4.42 Smart Investing & Trading Score: 42 | |
| Day Percent Change: 0.68% Day Change: 0.03 | |
| Week Change: 0.68% Year-to-date Change: -25.6% | |
| GPMT Links: Profile News Message Board | |
| Charts:- Daily , Weekly | |
| Add GPMT to Watchlist: View: Get Complete GPMT Trend Analysis ➞ | |
 | DBI Designer Brands Inc. |
| Sector: Services & Goods | |
| SubSector: Apparel Stores | |
| MarketCap: 467.308 Millions | |
| Recent Price: 8.85 Smart Investing & Trading Score: 65 | |
| Day Percent Change: 0.68% Day Change: 0.06 | |
| Week Change: 0.68% Year-to-date Change: 0.0% | |
| DBI Links: Profile News Message Board | |
| Charts:- Daily , Weekly | |
| Add DBI to Watchlist: View: Get Complete DBI Trend Analysis ➞ | |
 | AMTB Amerant Bancorp Inc. |
| Sector: Financials | |
| SubSector: Regional - Midwest Banks | |
| MarketCap: 653.87 Millions | |
| Recent Price: 22.33 Smart Investing & Trading Score: 67 | |
| Day Percent Change: 0.68% Day Change: 0.15 | |
| Week Change: 0.68% Year-to-date Change: -9.1% | |
| AMTB Links: Profile News Message Board | |
| Charts:- Daily , Weekly | |
| Add AMTB to Watchlist: View: Get Complete AMTB Trend Analysis ➞ | |
| Too many stocks? View smallcap stocks filtered by marketcap & sector |
| Marketcap: All SmallCap Stocks (default-no microcap), Large, Mid-Range, Small & MicroCap |
| Sector: Tech, Finance, Energy, Staples, Retail, Industrial, Materials, Utilities & Medical |
|
Best Stocks Today 12Stocks.com |
© 2024 12Stocks.com Terms & Conditions Privacy Contact Us
All Information Provided Only For Education And Not To Be Used For Investing or Trading. See Terms & Conditions


One More Thing ... Get Best Stocks Delivered Daily!
Never Ever Miss A Move With Our Top Ten Stocks Lists
Find Best Stocks In Any Market - Bull or Bear Market
Take A Peek At Our Top Ten Stocks Lists: Daily, Weekly, Year-to-Date & Top Trends
Find Best Stocks In Any Market - Bull or Bear Market
Take A Peek At Our Top Ten Stocks Lists: Daily, Weekly, Year-to-Date & Top Trends
Smallcap Stocks With Best Up Trends [0-bearish to 100-bullish]: Matterport [100], Riot Blockchain[100], Ingevity [100], Vista Outdoor[100], Park National[100], Maiden [100], Amplify Energy[100], Excelerate Energy[100], Perella Weinberg[100], Zuora [100], Vertex Energy[100]
Best Smallcap Stocks Year-to-Date:
CareMax [561.86%], Janux [354.91%], Alpine Immune[239.18%], Viking [237.13%], Longboard [205.56%], Arcutis Bio[176.78%], Avidity Biosciences[167.26%], Vera [152.78%], Super Micro[152.24%], Hippo [125.58%], Y-mAbs [122.29%] Best Smallcap Stocks This Week:
Matterport [175.86%], ProKidney [33.33%], CareMax [24.9%], Riot Blockchain[23.11%], Cipher Mining[18.75%], OptiNose [15.07%], Assertio [13.48%], MicroStrategy [12.77%], Vuzix [11.57%], Seres [11.56%], Energy Vault[11.11%] Best Smallcap Stocks Daily:
Matterport [175.86%], ProKidney [33.33%], CareMax [24.90%], Riot Blockchain[23.11%], Cipher Mining[18.75%], OptiNose [15.07%], Assertio [13.48%], MicroStrategy [12.77%], Vuzix [11.57%], Seres [11.56%], Energy Vault[11.11%]