
 Login Sign Up


| |||||
 |  | ||||

| 12Stocks.com Market Intelligence |
Best SmallCap Stocks
|
| In a hurry? Small Cap Stock Lists: Performance Trends Table, Stock Charts
Sort Small Cap stocks: Daily, Weekly, Year-to-Date, Market Cap & Trends. Filter Small Cap stocks list by sector: Show all, Tech, Finance, Energy, Staples, Retail, Industrial, Materials, Utilities and HealthCare Filter Small Cap stocks list by size: All Large Medium Small and MicroCap |
| 12Stocks.com Small Cap Stocks Performances & Trends Daily | |||||||||
|
|  The overall Smart Investing & Trading Score is 31 (0-bearish to 100-bullish) which puts Small Cap index in short term bearish to neutral trend. The Smart Investing & Trading Score from previous trading session is 23 and hence an improvement of trend.
| ||||||||
Here are the Smart Investing & Trading Scores of the most requested small cap stocks at 12Stocks.com (click stock name for detailed review):
|


| 12Stocks.com: Investing in Smallcap Index with Stocks | |
|
The following table helps investors and traders sort through current performance and trends (as measured by Smart Investing & Trading Score) of various
stocks in the Smallcap Index. Quick View: Move mouse or cursor over stock symbol (ticker) to view short-term technical chart and over stock name to view long term chart. Click on  to add stock symbol to your watchlist and to add stock symbol to your watchlist and  to view watchlist. Click on any ticker or stock name for detailed market intelligence report for that stock. to view watchlist. Click on any ticker or stock name for detailed market intelligence report for that stock. |
12Stocks.com Performance of Stocks in Smallcap Index
| Ticker | Stock Name | Watchlist | Category | Recent Price | Smart Investing & Trading Score | Change % | Weekly Change% |
| MTRN | Materion |   | Materials | 121.21 | 26 | 1.22% | -3.37% |
| STHO | Star | | Financials | 11.75 | 40 | 0.64% | -3.37% |
| CNMD | CONMED | | Health Care | 72.06 | 10 | 1.38% | -3.38% |
| PRIM | Primoris Services | | Industrials | 43.96 | 51 | 1.92% | -3.38% |
| CHRD | Chord Energy | | Energy | 180.79 | 51 | -0.17% | -3.39% |
| MGY | Magnolia Oil | | Energy | 25.77 | 36 | 0.37% | -3.39% |
| ZNTL | Zentalis | | Health Care | 12.96 | 53 | 3.23% | -3.39% |
| TMHC | Taylor Morrison | | Industrials | 54.86 | 51 | 1.54% | -3.40% |
| PGRE | Paramount Group | | Financials | 4.53 | 10 | 1.80% | -3.41% |
| SMMT | Summit | | Health Care | 3.54 | 7 | 0.85% | -3.41% |
| TLYS | Tilly s | | Services & Goods | 5.64 | 25 | 1.08% | -3.42% |
| TWI | Titan | | Industrials | 11.53 | 0 | 0.96% | -3.43% |
| HRI | Herc | | Transports | 152.43 | 26 | 1.10% | -3.43% |
| AIV | Apartment | | Financials | 7.83 | 46 | 0.90% | -3.45% |
| FLR | Fluor | | Industrials | 39.44 | 36 | 0.59% | -3.45% |
| ATRI | Atrion | | Health Care | 385.59 | 36 | -0.03% | -3.45% |
| NX | Quanex Building | | Industrials | 34.63 | 26 | 1.14% | -3.46% |
| EVBN | Evans Bancorp | | Financials | 26.10 | 17 | 0.77% | -3.48% |
| NRGV | Energy Vault | | Utilities | 1.11 | 10 | 0.00% | -3.48% |
| MRTN | Marten Transport | | Transports | 16.54 | 7 | 3.57% | -3.50% |
| PUBM | PubMatic | | Technology | 22.06 | 61 | 2.41% | -3.50% |
| NEOG | Neogen | | Health Care | 11.95 | 18 | 0.13% | -3.51% |
| SPSC | SPS Commerce | | Technology | 163.67 | 10 | 0.33% | -3.52% |
| SDRL | Seadrill | | Energy | 49.73 | 36 | -0.72% | -3.53% |
| SQSP | Squarespace | | Technology | 35.30 | 56 | 1.06% | -3.54% |
| For chart view version of above stock list: Chart View ➞ 0 - 25 , 25 - 50 , 50 - 75 , 75 - 100 , 100 - 125 , 125 - 150 , 150 - 175 , 175 - 200 , 200 - 225 , 225 - 250 , 250 - 275 , 275 - 300 , 300 - 325 , 325 - 350 , 350 - 375 , 375 - 400 , 400 - 425 , 425 - 450 , 450 - 475 , 475 - 500 , 500 - 525 , 525 - 550 , 550 - 575 , 575 - 600 , 600 - 625 , 625 - 650 , 650 - 675 , 675 - 700 , 700 - 725 , 725 - 750 , 750 - 775 , 775 - 800 , 800 - 825 , 825 - 850 , 850 - 875 , 875 - 900 , 900 - 925 , 925 - 950 , 950 - 975 , 975 - 1000 , 1000 - 1025 , 1025 - 1050 , 1050 - 1075 , 1075 - 1100 , 1100 - 1125 , 1125 - 1150 , 1150 - 1175 , 1175 - 1200 , 1200 - 1225 , 1225 - 1250 , 1250 - 1275 , 1275 - 1300 , 1300 - 1325 , 1325 - 1350 , 1350 - 1375 , 1375 - 1400 , 1400 - 1425 , 1425 - 1450 , 1450 - 1475 , 1475 - 1500 , 1500 - 1525 , 1525 - 1550 , 1550 - 1575 , 1575 - 1600 , 1600 - 1625 | ||
 | Click To Change The Sort Order: By Market Cap or Company Size Performance: Year-to-date, Week and Day |  |
| Too many stocks? View smallcap stocks filtered by marketcap & sector |
| Marketcap: All SmallCap Stocks (default-no microcap), Large, Mid-Range, Small |
| Smallcap Sector: Tech, Finance, Energy, Staples, Retail, Industrial, Materials, & Medical |
|
Get the most comprehensive stock market coverage daily at 12Stocks.com ➞ Best Stocks Today ➞ Best Stocks Weekly ➞ Best Stocks Year-to-Date ➞ Best Stocks Trends ➞  Best Stocks Today 12Stocks.com Best Nasdaq Stocks ➞ Best S&P 500 Stocks ➞ Best Tech Stocks ➞ Best Biotech Stocks ➞ |
| Detailed Overview of SmallCap Stocks |
| SmallCap Technical Overview, Leaders & Laggards, Top SmallCap ETF Funds & Detailed SmallCap Stocks List, Charts, Trends & More |
| Smallcap: Technical Analysis, Trends & YTD Performance | |
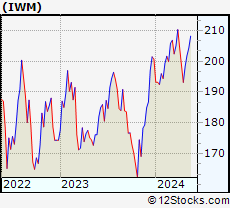
| SmallCap segment as represented by
IWM, an exchange-traded fund [ETF], holds basket of thousands of smallcap stocks from across all major sectors of the US stock market. The smallcap index (contains stocks like Riverbed & Sotheby's) is down by -3.3% and is currently underperforming the overall market by -7.65% year-to-date. Below is a quick view of technical charts and trends: | |
 IWM Weekly Chart |
|
| Long Term Trend: Good | |
| Medium Term Trend: Not Good | |
 IWM Daily Chart |
|
| Short Term Trend: Deteriorating | |
| Overall Trend Score: 31 | |
| YTD Performance: -3.3% | |
| **Trend Scores & Views Are Only For Educational Purposes And Not For Investing | |
| 12Stocks.com: Top Performing Small Cap Index Stocks | ||||||||||||||||||||||||||||||||||||||||||||||||
 The top performing Small Cap Index stocks year to date are
Now, more recently, over last week, the top performing Small Cap Index stocks on the move are


|
||||||||||||||||||||||||||||||||||||||||||||||||
| 12Stocks.com: Investing in Smallcap Index using Exchange Traded Funds | |
|
The following table shows list of key exchange traded funds (ETF) that
help investors track Smallcap index. The following list also includes leveraged ETF funds that track twice or thrice the daily returns of Smallcap indices. Short or inverse ETF funds move in the opposite direction to the index they track and are useful during market pullbacks or during bear markets. Quick View: Move mouse or cursor over ETF symbol (ticker) to view short-term technical chart and over ETF name to view long term chart. Click on ticker or stock name for detailed view. Click on to add stock symbol to your watchlist and to view watchlist. |
12Stocks.com List of ETFs that track Smallcap Index
| Ticker | ETF Name | Watchlist | Recent Price | Smart Investing & Trading Score | Change % | Week % | Year-to-date % |
| IWM | iShares Russell 2000 | | 194.08 | 31 | 0.64 | -2.32 | -3.3% |
| 12Stocks.com: Charts, Trends, Fundamental Data and Performances of SmallCap Stocks | |
|
We now take in-depth look at all SmallCap stocks including charts, multi-period performances and overall trends (as measured by Smart Investing & Trading Score). One can sort SmallCap stocks (click link to choose) by Daily, Weekly and by Year-to-Date performances. Also, one can sort by size of the company or by market capitalization. |
| Select Your Default Chart Type: | |||||
| |||||
| Click on stock symbol or name for detailed view. Click on to add stock symbol to your watchlist and to view watchlist. Quick View: Move mouse or cursor over "Daily" to quickly view daily technical stock chart and over "Weekly" to view weekly technical stock chart. | |||||

 | MTRN Materion Corporation |
| Sector: Materials | |
| SubSector: Industrial Metals & Minerals | |
| MarketCap: 703.71 Millions | |
| Recent Price: 121.21 Smart Investing & Trading Score: 26 | |
| Day Percent Change: 1.22% Day Change: 1.46 | |
| Week Change: -3.37% Year-to-date Change: -6.9% | |
| MTRN Links: Profile News Message Board | |
| Charts:- Daily , Weekly | |
| Add MTRN to Watchlist: View: Get Complete MTRN Trend Analysis ➞ | |
 | STHO Star Holdings |
| Sector: Financials | |
| SubSector: Financials Services | |
| MarketCap: 195 Millions | |
| Recent Price: 11.75 Smart Investing & Trading Score: 40 | |
| Day Percent Change: 0.64% Day Change: 0.07 | |
| Week Change: -3.37% Year-to-date Change: -21.6% | |
| STHO Links: Profile News Message Board | |
| Charts:- Daily , Weekly | |
| Add STHO to Watchlist: View: Get Complete STHO Trend Analysis ➞ | |
 | CNMD CONMED Corporation |
| Sector: Health Care | |
| SubSector: Medical Appliances & Equipment | |
| MarketCap: 1589.2 Millions | |
| Recent Price: 72.06 Smart Investing & Trading Score: 10 | |
| Day Percent Change: 1.38% Day Change: 0.98 | |
| Week Change: -3.38% Year-to-date Change: -34.2% | |
| CNMD Links: Profile News Message Board | |
| Charts:- Daily , Weekly | |
| Add CNMD to Watchlist: View: Get Complete CNMD Trend Analysis ➞ | |
 | PRIM Primoris Services Corporation |
| Sector: Industrials | |
| SubSector: Heavy Construction | |
| MarketCap: 931.895 Millions | |
| Recent Price: 43.96 Smart Investing & Trading Score: 51 | |
| Day Percent Change: 1.92% Day Change: 0.83 | |
| Week Change: -3.38% Year-to-date Change: 32.4% | |
| PRIM Links: Profile News Message Board | |
| Charts:- Daily , Weekly | |
| Add PRIM to Watchlist: View: Get Complete PRIM Trend Analysis ➞ | |
 | CHRD Chord Energy Corporation |
| Sector: Energy | |
| SubSector: Oil & Gas E&P | |
| MarketCap: 6280 Millions | |
| Recent Price: 180.79 Smart Investing & Trading Score: 51 | |
| Day Percent Change: -0.17% Day Change: -0.31 | |
| Week Change: -3.39% Year-to-date Change: 8.3% | |
| CHRD Links: Profile News Message Board | |
| Charts:- Daily , Weekly | |
| Add CHRD to Watchlist: View: Get Complete CHRD Trend Analysis ➞ | |
 | MGY Magnolia Oil & Gas Corporation |
| Sector: Energy | |
| SubSector: Independent Oil & Gas | |
| MarketCap: 1088.93 Millions | |
| Recent Price: 25.77 Smart Investing & Trading Score: 36 | |
| Day Percent Change: 0.37% Day Change: 0.09 | |
| Week Change: -3.39% Year-to-date Change: 21.1% | |
| MGY Links: Profile News Message Board | |
| Charts:- Daily , Weekly | |
| Add MGY to Watchlist: View: Get Complete MGY Trend Analysis ➞ | |
 | ZNTL Zentalis Pharmaceuticals, Inc. |
| Sector: Health Care | |
| SubSector: Biotechnology | |
| MarketCap: 22187 Millions | |
| Recent Price: 12.96 Smart Investing & Trading Score: 53 | |
| Day Percent Change: 3.23% Day Change: 0.40 | |
| Week Change: -3.39% Year-to-date Change: -14.5% | |
| ZNTL Links: Profile News Message Board | |
| Charts:- Daily , Weekly | |
| Add ZNTL to Watchlist: View: Get Complete ZNTL Trend Analysis ➞ | |
 | TMHC Taylor Morrison Home Corporation |
| Sector: Industrials | |
| SubSector: Residential Construction | |
| MarketCap: 1336.76 Millions | |
| Recent Price: 54.86 Smart Investing & Trading Score: 51 | |
| Day Percent Change: 1.54% Day Change: 0.83 | |
| Week Change: -3.4% Year-to-date Change: 2.8% | |
| TMHC Links: Profile News Message Board | |
| Charts:- Daily , Weekly | |
| Add TMHC to Watchlist: View: Get Complete TMHC Trend Analysis ➞ | |
 | PGRE Paramount Group, Inc. |
| Sector: Financials | |
| SubSector: Property Management | |
| MarketCap: 1722.72 Millions | |
| Recent Price: 4.53 Smart Investing & Trading Score: 10 | |
| Day Percent Change: 1.80% Day Change: 0.08 | |
| Week Change: -3.41% Year-to-date Change: -12.4% | |
| PGRE Links: Profile News Message Board | |
| Charts:- Daily , Weekly | |
| Add PGRE to Watchlist: View: Get Complete PGRE Trend Analysis ➞ | |
 | SMMT Summit Therapeutics plc |
| Sector: Health Care | |
| SubSector: Biotechnology | |
| MarketCap: 156.985 Millions | |
| Recent Price: 3.54 Smart Investing & Trading Score: 7 | |
| Day Percent Change: 0.85% Day Change: 0.03 | |
| Week Change: -3.41% Year-to-date Change: 35.6% | |
| SMMT Links: Profile News Message Board | |
| Charts:- Daily , Weekly | |
| Add SMMT to Watchlist: View: Get Complete SMMT Trend Analysis ➞ | |
 | TLYS Tilly s, Inc. |
| Sector: Services & Goods | |
| SubSector: Apparel Stores | |
| MarketCap: 127.408 Millions | |
| Recent Price: 5.64 Smart Investing & Trading Score: 25 | |
| Day Percent Change: 1.08% Day Change: 0.06 | |
| Week Change: -3.42% Year-to-date Change: -25.2% | |
| TLYS Links: Profile News Message Board | |
| Charts:- Daily , Weekly | |
| Add TLYS to Watchlist: View: Get Complete TLYS Trend Analysis ➞ | |
 | TWI Titan International, Inc. |
| Sector: Industrials | |
| SubSector: Farm & Construction Machinery | |
| MarketCap: 104.607 Millions | |
| Recent Price: 11.53 Smart Investing & Trading Score: 0 | |
| Day Percent Change: 0.96% Day Change: 0.11 | |
| Week Change: -3.43% Year-to-date Change: -22.5% | |
| TWI Links: Profile News Message Board | |
| Charts:- Daily , Weekly | |
| Add TWI to Watchlist: View: Get Complete TWI Trend Analysis ➞ | |
 | HRI Herc Holdings Inc. |
| Sector: Transports | |
| SubSector: Rental & Leasing Services | |
| MarketCap: 469.344 Millions | |
| Recent Price: 152.43 Smart Investing & Trading Score: 26 | |
| Day Percent Change: 1.10% Day Change: 1.66 | |
| Week Change: -3.43% Year-to-date Change: 2.4% | |
| HRI Links: Profile News Message Board | |
| Charts:- Daily , Weekly | |
| Add HRI to Watchlist: View: Get Complete HRI Trend Analysis ➞ | |
 | AIV Apartment Investment and Management Company |
| Sector: Financials | |
| SubSector: REIT - Residential | |
| MarketCap: 4485.11 Millions | |
| Recent Price: 7.83 Smart Investing & Trading Score: 46 | |
| Day Percent Change: 0.90% Day Change: 0.07 | |
| Week Change: -3.45% Year-to-date Change: 0.0% | |
| AIV Links: Profile News Message Board | |
| Charts:- Daily , Weekly | |
| Add AIV to Watchlist: View: Get Complete AIV Trend Analysis ➞ | |
 | FLR Fluor Corporation |
| Sector: Industrials | |
| SubSector: Heavy Construction | |
| MarketCap: 891.495 Millions | |
| Recent Price: 39.44 Smart Investing & Trading Score: 36 | |
| Day Percent Change: 0.59% Day Change: 0.23 | |
| Week Change: -3.45% Year-to-date Change: 0.7% | |
| FLR Links: Profile News Message Board | |
| Charts:- Daily , Weekly | |
| Add FLR to Watchlist: View: Get Complete FLR Trend Analysis ➞ | |
 | ATRI Atrion Corporation |
| Sector: Health Care | |
| SubSector: Medical Instruments & Supplies | |
| MarketCap: 1234.6 Millions | |
| Recent Price: 385.59 Smart Investing & Trading Score: 36 | |
| Day Percent Change: -0.03% Day Change: -0.11 | |
| Week Change: -3.45% Year-to-date Change: 1.8% | |
| ATRI Links: Profile News Message Board | |
| Charts:- Daily , Weekly | |
| Add ATRI to Watchlist: View: Get Complete ATRI Trend Analysis ➞ | |
 | NX Quanex Building Products Corporation |
| Sector: Industrials | |
| SubSector: General Building Materials | |
| MarketCap: 315.453 Millions | |
| Recent Price: 34.63 Smart Investing & Trading Score: 26 | |
| Day Percent Change: 1.14% Day Change: 0.39 | |
| Week Change: -3.46% Year-to-date Change: 13.3% | |
| NX Links: Profile News Message Board | |
| Charts:- Daily , Weekly | |
| Add NX to Watchlist: View: Get Complete NX Trend Analysis ➞ | |
 | EVBN Evans Bancorp, Inc. |
| Sector: Financials | |
| SubSector: Regional - Northeast Banks | |
| MarketCap: 124.899 Millions | |
| Recent Price: 26.10 Smart Investing & Trading Score: 17 | |
| Day Percent Change: 0.77% Day Change: 0.20 | |
| Week Change: -3.48% Year-to-date Change: -17.2% | |
| EVBN Links: Profile News Message Board | |
| Charts:- Daily , Weekly | |
| Add EVBN to Watchlist: View: Get Complete EVBN Trend Analysis ➞ | |
 | NRGV Energy Vault Holdings, Inc. |
| Sector: Utilities | |
| SubSector: Utilities - Renewable | |
| MarketCap: 364 Millions | |
| Recent Price: 1.11 Smart Investing & Trading Score: 10 | |
| Day Percent Change: 0.00% Day Change: 0.00 | |
| Week Change: -3.48% Year-to-date Change: -52.4% | |
| NRGV Links: Profile News Message Board | |
| Charts:- Daily , Weekly | |
| Add NRGV to Watchlist: View: Get Complete NRGV Trend Analysis ➞ | |
 | MRTN Marten Transport, Ltd. |
| Sector: Transports | |
| SubSector: Trucking | |
| MarketCap: 1012.15 Millions | |
| Recent Price: 16.54 Smart Investing & Trading Score: 7 | |
| Day Percent Change: 3.57% Day Change: 0.57 | |
| Week Change: -3.5% Year-to-date Change: -21.2% | |
| MRTN Links: Profile News Message Board | |
| Charts:- Daily , Weekly | |
| Add MRTN to Watchlist: View: Get Complete MRTN Trend Analysis ➞ | |
 | PUBM PubMatic, Inc. |
| Sector: Technology | |
| SubSector: Software Application | |
| MarketCap: 56787 Millions | |
| Recent Price: 22.06 Smart Investing & Trading Score: 61 | |
| Day Percent Change: 2.41% Day Change: 0.52 | |
| Week Change: -3.5% Year-to-date Change: 35.3% | |
| PUBM Links: Profile News Message Board | |
| Charts:- Daily , Weekly | |
| Add PUBM to Watchlist: View: Get Complete PUBM Trend Analysis ➞ | |
 | NEOG Neogen Corporation |
| Sector: Health Care | |
| SubSector: Diagnostic Substances | |
| MarketCap: 3234.71 Millions | |
| Recent Price: 11.95 Smart Investing & Trading Score: 18 | |
| Day Percent Change: 0.13% Day Change: 0.02 | |
| Week Change: -3.51% Year-to-date Change: -40.6% | |
| NEOG Links: Profile News Message Board | |
| Charts:- Daily , Weekly | |
| Add NEOG to Watchlist: View: Get Complete NEOG Trend Analysis ➞ | |
 | SPSC SPS Commerce, Inc. |
| Sector: Technology | |
| SubSector: Application Software | |
| MarketCap: 1398.02 Millions | |
| Recent Price: 163.67 Smart Investing & Trading Score: 10 | |
| Day Percent Change: 0.33% Day Change: 0.54 | |
| Week Change: -3.52% Year-to-date Change: -15.6% | |
| SPSC Links: Profile News Message Board | |
| Charts:- Daily , Weekly | |
| Add SPSC to Watchlist: View: Get Complete SPSC Trend Analysis ➞ | |
 | SDRL Seadrill Limited |
| Sector: Energy | |
| SubSector: Oil & Gas Drilling | |
| MarketCap: 3300 Millions | |
| Recent Price: 49.73 Smart Investing & Trading Score: 36 | |
| Day Percent Change: -0.72% Day Change: -0.36 | |
| Week Change: -3.53% Year-to-date Change: 4.9% | |
| SDRL Links: Profile News Message Board | |
| Charts:- Daily , Weekly | |
| Add SDRL to Watchlist: View: Get Complete SDRL Trend Analysis ➞ | |
 | SQSP Squarespace, Inc. |
| Sector: Technology | |
| SubSector: Software - Infrastructure | |
| MarketCap: 4150 Millions | |
| Recent Price: 35.30 Smart Investing & Trading Score: 56 | |
| Day Percent Change: 1.06% Day Change: 0.37 | |
| Week Change: -3.54% Year-to-date Change: 6.3% | |
| SQSP Links: Profile News Message Board | |
| Charts:- Daily , Weekly | |
| Add SQSP to Watchlist: View: Get Complete SQSP Trend Analysis ➞ | |
| Too many stocks? View smallcap stocks filtered by marketcap & sector |
| Marketcap: All SmallCap Stocks (default-no microcap), Large, Mid-Range, Small & MicroCap |
| Sector: Tech, Finance, Energy, Staples, Retail, Industrial, Materials, Utilities & Medical |
|
Best Stocks Today 12Stocks.com |
© 2024 12Stocks.com Terms & Conditions Privacy Contact Us
All Information Provided Only For Education And Not To Be Used For Investing or Trading. See Terms & Conditions


One More Thing ... Get Best Stocks Delivered Daily!
Never Ever Miss A Move With Our Top Ten Stocks Lists
Find Best Stocks In Any Market - Bull or Bear Market
Take A Peek At Our Top Ten Stocks Lists: Daily, Weekly, Year-to-Date & Top Trends
Find Best Stocks In Any Market - Bull or Bear Market
Take A Peek At Our Top Ten Stocks Lists: Daily, Weekly, Year-to-Date & Top Trends
Smallcap Stocks With Best Up Trends [0-bearish to 100-bullish]: Oscar Health[100], Victory Capital[100], Mercury General[100], NextNav [100], IMAX [100], EchoStar [100], Macatawa Bank[100], Badger Meter[100], ALX Oncology[95], Argan [95], Geron [95]
Best Smallcap Stocks Year-to-Date:
Agenus [580.03%], CareMax [394.85%], Janux [354.07%], Alpine Immune[238.42%], Longboard [195.25%], Super Micro[192.37%], Arcutis Bio[187%], Avidity Biosciences[159.07%], Vera [156.56%], Stoke [130.42%], Y-mAbs [124.78%] Best Smallcap Stocks This Week:
Macatawa Bank[44.42%], Humacyte [38.02%], ProKidney [34%], Snap One[29.98%], Vanda [24.15%], ALX Oncology[23.1%], 23andMe Holding[22.5%], ContextLogic [17.8%], Badger Meter[15.87%], Day One[15.69%], Oscar Health[15.13%] Best Smallcap Stocks Daily:
Humacyte [22.50%], Metropolitan Bank[16.45%], Agenus [13.28%], Origin Materials[10.81%], Tellurian [10.06%], Cohen & Steers[8.04%], Bar Harbor[7.21%], Genelux [6.78%], Day One[6.34%], AlTi Global[5.91%], Amplify Energy[5.69%]