
 Login Sign Up


| |||||
 |  | ||||

| 12Stocks.com Market Intelligence |
Best SmallCap Stocks
|
| In a hurry? Small Cap Stock Lists: Performance Trends Table, Stock Charts
Sort Small Cap stocks: Daily, Weekly, Year-to-Date, Market Cap & Trends. Filter Small Cap stocks list by sector: Show all, Tech, Finance, Energy, Staples, Retail, Industrial, Materials, Utilities and HealthCare Filter Small Cap stocks list by size: All Large Medium Small and MicroCap |
| 12Stocks.com Small Cap Stocks Performances & Trends Daily | |||||||||
|
|  The overall Smart Investing & Trading Score is 26 (0-bearish to 100-bullish) which puts Small Cap index in short term bearish to neutral trend. The Smart Investing & Trading Score from previous trading session is 31 and hence a deterioration of trend.
| ||||||||
Here are the Smart Investing & Trading Scores of the most requested small cap stocks at 12Stocks.com (click stock name for detailed review):
|


| 12Stocks.com: Investing in Smallcap Index with Stocks | |
|
The following table helps investors and traders sort through current performance and trends (as measured by Smart Investing & Trading Score) of various
stocks in the Smallcap Index. Quick View: Move mouse or cursor over stock symbol (ticker) to view short-term technical chart and over stock name to view long term chart. Click on  to add stock symbol to your watchlist and to add stock symbol to your watchlist and  to view watchlist. Click on any ticker or stock name for detailed market intelligence report for that stock. to view watchlist. Click on any ticker or stock name for detailed market intelligence report for that stock. |
12Stocks.com Performance of Stocks in Smallcap Index
| Ticker | Stock Name | Watchlist | Category | Recent Price | Smart Investing & Trading Score | Change % | Weekly Change% |
| PHR | Phreesia |   | Technology | 22.75 | 10 | -3.52% | -3.52% |
| PACK | Ranpak | | Industrials | 7.13 | 36 | -3.52% | -3.52% |
| REX | REX American | | Industrials | 54.71 | 36 | -3.54% | -3.54% |
| DH | Definitive Healthcare | | Health Care | 7.09 | 5 | -3.54% | -3.54% |
| TALO | Talos Energy | | Energy | 13.57 | 36 | -3.55% | -3.55% |
| DOUG | Douglas Elliman | | Financials | 1.36 | 10 | -3.55% | -3.55% |
| VALU | Value Line | | Services & Goods | 37.95 | 20 | -3.56% | -3.56% |
| VRNS | Varonis Systems | | Technology | 42.93 | 0 | -3.57% | -3.57% |
| LC | LendingClub | | Financials | 7.80 | 10 | -3.58% | -3.58% |
| TDUP | ThredUp | | Services & Goods | 1.61 | 0 | -3.59% | -3.59% |
| CURV | Torrid | | Services & Goods | 4.30 | 27 | -3.59% | -3.59% |
| PKOH | Park-Ohio | | Services & Goods | 24.36 | 0 | -3.60% | -3.60% |
| DSP | Viant | | Technology | 8.83 | 26 | -3.60% | -3.60% |
| BMEA | Biomea Fusion | | Health Care | 12.51 | 10 | -3.62% | -3.62% |
| BRT | BRT Apartments | | Financials | 17.00 | 69 | -3.63% | -3.63% |
| LOVE | Lovesac | | Consumer Staples | 18.80 | 0 | -3.64% | -3.64% |
| BARK | BARK | | Services & Goods | 1.06 | 26 | -3.64% | -3.64% |
| BOWL | Bowlero | | Services & Goods | 11.89 | 26 | -3.65% | -3.65% |
| TTI | TETRA | | Energy | 4.46 | 44 | -3.67% | -3.67% |
| FSLY | Fastly | | Technology | 13.13 | 25 | -3.67% | -3.67% |
| ARCT | Arcturus | | Health Care | 29.31 | 0 | -3.68% | -3.68% |
| FGEN | FibroGen | | Health Care | 1.31 | 27 | -3.68% | -3.68% |
| ARDX | Ardelyx | | Health Care | 6.80 | 0 | -3.68% | -3.68% |
| UPWK | Upwork | | Technology | 11.20 | 10 | -3.70% | -3.70% |
| BIGC | BigCommerce | | Technology | 5.98 | 0 | -3.70% | -3.70% |


| Too many stocks? View smallcap stocks filtered by marketcap & sector |
| Marketcap: All SmallCap Stocks (default-no microcap), Large, Mid-Range, Small |
| Smallcap Sector: Tech, Finance, Energy, Staples, Retail, Industrial, Materials, & Medical |
|
Get the most comprehensive stock market coverage daily at 12Stocks.com ➞ Best Stocks Today ➞ Best Stocks Weekly ➞ Best Stocks Year-to-Date ➞ Best Stocks Trends ➞  Best Stocks Today 12Stocks.com Best Nasdaq Stocks ➞ Best S&P 500 Stocks ➞ Best Tech Stocks ➞ Best Biotech Stocks ➞ |
| Detailed Overview of SmallCap Stocks |
| SmallCap Technical Overview, Leaders & Laggards, Top SmallCap ETF Funds & Detailed SmallCap Stocks List, Charts, Trends & More |
| Smallcap: Technical Analysis, Trends & YTD Performance | |
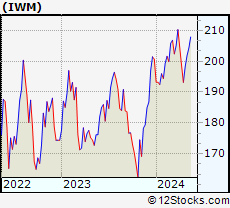
| SmallCap segment as represented by
IWM, an exchange-traded fund [ETF], holds basket of thousands of smallcap stocks from across all major sectors of the US stock market. The smallcap index (contains stocks like Riverbed & Sotheby's) is down by -2.46% and is currently underperforming the overall market by -7.8% year-to-date. Below is a quick view of technical charts and trends: | |
 IWM Weekly Chart |
|
| Long Term Trend: Good | |
| Medium Term Trend: Not Good | |
 IWM Daily Chart |
|
| Short Term Trend: Not Good | |
| Overall Trend Score: 26 | |
| YTD Performance: -2.46% | |
| **Trend Scores & Views Are Only For Educational Purposes And Not For Investing | |
| 12Stocks.com: Top Performing Small Cap Index Stocks | ||||||||||||||||||||||||||||||||||||||||||||||||
 The top performing Small Cap Index stocks year to date are
Now, more recently, over last week, the top performing Small Cap Index stocks on the move are


|
||||||||||||||||||||||||||||||||||||||||||||||||
| 12Stocks.com: Investing in Smallcap Index using Exchange Traded Funds | |
|
The following table shows list of key exchange traded funds (ETF) that
help investors track Smallcap index. The following list also includes leveraged ETF funds that track twice or thrice the daily returns of Smallcap indices. Short or inverse ETF funds move in the opposite direction to the index they track and are useful during market pullbacks or during bear markets. Quick View: Move mouse or cursor over ETF symbol (ticker) to view short-term technical chart and over ETF name to view long term chart. Click on ticker or stock name for detailed view. Click on to add stock symbol to your watchlist and to view watchlist. |
12Stocks.com List of ETFs that track Smallcap Index
| Ticker | ETF Name | Watchlist | Recent Price | Smart Investing & Trading Score | Change % | Week % | Year-to-date % |
| IWM | iShares Russell 2000 | | 195.78 | 26 | -1.46 | -1.46 | -2.46% |
| IJR | iShares Core S&P Small-Cap | | 103.54 | 13 | -0.93 | -0.93 | -4.35% |
| VTWO | Vanguard Russell 2000 ETF | | 79.23 | 26 | -1.36 | -1.36 | -2.31% |
| IWN | iShares Russell 2000 Value | | 148.60 | 18 | -1.18 | -1.18 | -4.33% |
| IWO | iShares Russell 2000 Growth | | 251.04 | 26 | -1.69 | -1.69 | -0.47% |
| IJS | iShares S&P Small-Cap 600 Value | | 95.20 | 0 | -1.01 | -1.01 | -7.64% |
| IJT | iShares S&P Small-Cap 600 Growth | | 123.52 | 31 | -1.01 | -1.01 | -1.29% |
| XSLV | PowerShares S&P SmallCap Low Volatil ETF | | 41.88 | 0 | -0.50 | -0.5 | -5.14% |
| SDD | ProShares UltraShort SmallCap600 | | 20.23 | 100 | 2.01 | 2.01 | 9.79% |
| SAA | ProShares Ultra SmallCap600 | | 22.43 | 0 | -0.58 | -0.58 | -10.1% |
| SBB | ProShares Short SmallCap600 | | 16.41 | 52 | -0.83 | -0.83 | 3.01% |
| SMLV | SPDR SSGA US Small Cap Low Volatil ETF | | 104.73 | 8 | -0.27 | -0.27 | -6.92% |
| 12Stocks.com: Charts, Trends, Fundamental Data and Performances of SmallCap Stocks | |
|
We now take in-depth look at all SmallCap stocks including charts, multi-period performances and overall trends (as measured by Smart Investing & Trading Score). One can sort SmallCap stocks (click link to choose) by Daily, Weekly and by Year-to-Date performances. Also, one can sort by size of the company or by market capitalization. |
| Select Your Default Chart Type: | |||||
| |||||
| Click on stock symbol or name for detailed view. Click on to add stock symbol to your watchlist and to view watchlist. Quick View: Move mouse or cursor over "Daily" to quickly view daily technical stock chart and over "Weekly" to view weekly technical stock chart. | |||||

 | PHR Phreesia, Inc. |
| Sector: Technology | |
| SubSector: Healthcare Information Services | |
| MarketCap: 810.255 Millions | |
| Recent Price: 22.75 Smart Investing & Trading Score: 10 | |
| Day Percent Change: -3.52% Day Change: -0.83 | |
| Week Change: -3.52% Year-to-date Change: -1.7% | |
| PHR Links: Profile News Message Board | |
| Charts:- Daily , Weekly | |
| Add PHR to Watchlist: View: Get Complete PHR Trend Analysis ➞ | |
 | PACK Ranpak Holdings Corp. |
| Sector: Industrials | |
| SubSector: Conglomerates | |
| MarketCap: 492.648 Millions | |
| Recent Price: 7.13 Smart Investing & Trading Score: 36 | |
| Day Percent Change: -3.52% Day Change: -0.26 | |
| Week Change: -3.52% Year-to-date Change: 22.5% | |
| PACK Links: Profile News Message Board | |
| Charts:- Daily , Weekly | |
| Add PACK to Watchlist: View: Get Complete PACK Trend Analysis ➞ | |
 | REX REX American Resources Corporation |
| Sector: Industrials | |
| SubSector: Conglomerates | |
| MarketCap: 373.748 Millions | |
| Recent Price: 54.71 Smart Investing & Trading Score: 36 | |
| Day Percent Change: -3.54% Day Change: -2.01 | |
| Week Change: -3.54% Year-to-date Change: 15.7% | |
| REX Links: Profile News Message Board | |
| Charts:- Daily , Weekly | |
| Add REX to Watchlist: View: Get Complete REX Trend Analysis ➞ | |
 | DH Definitive Healthcare Corp. |
| Sector: Health Care | |
| SubSector: Health Information Services | |
| MarketCap: 1690 Millions | |
| Recent Price: 7.09 Smart Investing & Trading Score: 5 | |
| Day Percent Change: -3.54% Day Change: -0.26 | |
| Week Change: -3.54% Year-to-date Change: -29.6% | |
| DH Links: Profile News Message Board | |
| Charts:- Daily , Weekly | |
| Add DH to Watchlist: View: Get Complete DH Trend Analysis ➞ | |
 | TALO Talos Energy Inc. |
| Sector: Energy | |
| SubSector: Independent Oil & Gas | |
| MarketCap: 396.293 Millions | |
| Recent Price: 13.57 Smart Investing & Trading Score: 36 | |
| Day Percent Change: -3.55% Day Change: -0.50 | |
| Week Change: -3.55% Year-to-date Change: -4.6% | |
| TALO Links: Profile News Message Board | |
| Charts:- Daily , Weekly | |
| Add TALO to Watchlist: View: Get Complete TALO Trend Analysis ➞ | |
 | DOUG Douglas Elliman Inc. |
| Sector: Financials | |
| SubSector: Financials Services | |
| MarketCap: 197 Millions | |
| Recent Price: 1.36 Smart Investing & Trading Score: 10 | |
| Day Percent Change: -3.55% Day Change: -0.05 | |
| Week Change: -3.55% Year-to-date Change: -53.6% | |
| DOUG Links: Profile News Message Board | |
| Charts:- Daily , Weekly | |
| Add DOUG to Watchlist: View: Get Complete DOUG Trend Analysis ➞ | |
 | VALU Value Line, Inc. |
| Sector: Services & Goods | |
| SubSector: Publishing - Periodicals | |
| MarketCap: 254.3 Millions | |
| Recent Price: 37.95 Smart Investing & Trading Score: 20 | |
| Day Percent Change: -3.56% Day Change: -1.40 | |
| Week Change: -3.56% Year-to-date Change: -22.2% | |
| VALU Links: Profile News Message Board | |
| Charts:- Daily , Weekly | |
| Add VALU to Watchlist: View: Get Complete VALU Trend Analysis ➞ | |
 | VRNS Varonis Systems, Inc. |
| Sector: Technology | |
| SubSector: Technical & System Software | |
| MarketCap: 1715 Millions | |
| Recent Price: 42.93 Smart Investing & Trading Score: 0 | |
| Day Percent Change: -3.57% Day Change: -1.59 | |
| Week Change: -3.57% Year-to-date Change: -5.2% | |
| VRNS Links: Profile News Message Board | |
| Charts:- Daily , Weekly | |
| Add VRNS to Watchlist: View: Get Complete VRNS Trend Analysis ➞ | |
 | LC LendingClub Corporation |
| Sector: Financials | |
| SubSector: Credit Services | |
| MarketCap: 852.308 Millions | |
| Recent Price: 7.80 Smart Investing & Trading Score: 10 | |
| Day Percent Change: -3.58% Day Change: -0.29 | |
| Week Change: -3.58% Year-to-date Change: -10.8% | |
| LC Links: Profile News Message Board | |
| Charts:- Daily , Weekly | |
| Add LC to Watchlist: View: Get Complete LC Trend Analysis ➞ | |
 | TDUP ThredUp Inc. |
| Sector: Services & Goods | |
| SubSector: Internet Retail | |
| MarketCap: 258 Millions | |
| Recent Price: 1.61 Smart Investing & Trading Score: 0 | |
| Day Percent Change: -3.59% Day Change: -0.06 | |
| Week Change: -3.59% Year-to-date Change: -28.8% | |
| TDUP Links: Profile News Message Board | |
| Charts:- Daily , Weekly | |
| Add TDUP to Watchlist: View: Get Complete TDUP Trend Analysis ➞ | |
 | CURV Torrid Holdings Inc. |
| Sector: Services & Goods | |
| SubSector: Apparel Retail | |
| MarketCap: 278 Millions | |
| Recent Price: 4.30 Smart Investing & Trading Score: 27 | |
| Day Percent Change: -3.59% Day Change: -0.16 | |
| Week Change: -3.59% Year-to-date Change: -26.5% | |
| CURV Links: Profile News Message Board | |
| Charts:- Daily , Weekly | |
| Add CURV to Watchlist: View: Get Complete CURV Trend Analysis ➞ | |
 | PKOH Park-Ohio Holdings Corp. |
| Sector: Services & Goods | |
| SubSector: Industrial Equipment Wholesale | |
| MarketCap: 214.358 Millions | |
| Recent Price: 24.36 Smart Investing & Trading Score: 0 | |
| Day Percent Change: -3.60% Day Change: -0.91 | |
| Week Change: -3.6% Year-to-date Change: -9.6% | |
| PKOH Links: Profile News Message Board | |
| Charts:- Daily , Weekly | |
| Add PKOH to Watchlist: View: Get Complete PKOH Trend Analysis ➞ | |
 | DSP Viant Technology Inc. |
| Sector: Technology | |
| SubSector: Software - Application | |
| MarketCap: 279 Millions | |
| Recent Price: 8.83 Smart Investing & Trading Score: 26 | |
| Day Percent Change: -3.60% Day Change: -0.33 | |
| Week Change: -3.6% Year-to-date Change: 27.2% | |
| DSP Links: Profile News Message Board | |
| Charts:- Daily , Weekly | |
| Add DSP to Watchlist: View: Get Complete DSP Trend Analysis ➞ | |
 | BMEA Biomea Fusion, Inc. |
| Sector: Health Care | |
| SubSector: Biotechnology | |
| MarketCap: 818 Millions | |
| Recent Price: 12.51 Smart Investing & Trading Score: 10 | |
| Day Percent Change: -3.62% Day Change: -0.47 | |
| Week Change: -3.62% Year-to-date Change: -14.6% | |
| BMEA Links: Profile News Message Board | |
| Charts:- Daily , Weekly | |
| Add BMEA to Watchlist: View: Get Complete BMEA Trend Analysis ➞ | |
 | BRT BRT Apartments Corp. |
| Sector: Financials | |
| SubSector: Mortgage Investment | |
| MarketCap: 163.239 Millions | |
| Recent Price: 17.00 Smart Investing & Trading Score: 69 | |
| Day Percent Change: -3.63% Day Change: -0.64 | |
| Week Change: -3.63% Year-to-date Change: -8.6% | |
| BRT Links: Profile News Message Board | |
| Charts:- Daily , Weekly | |
| Add BRT to Watchlist: View: Get Complete BRT Trend Analysis ➞ | |
 | LOVE The Lovesac Company |
| Sector: Consumer Staples | |
| SubSector: Home Furnishings & Fixtures | |
| MarketCap: 112.835 Millions | |
| Recent Price: 18.80 Smart Investing & Trading Score: 0 | |
| Day Percent Change: -3.64% Day Change: -0.71 | |
| Week Change: -3.64% Year-to-date Change: -26.4% | |
| LOVE Links: Profile News Message Board | |
| Charts:- Daily , Weekly | |
| Add LOVE to Watchlist: View: Get Complete LOVE Trend Analysis ➞ | |
 | BARK BARK, Inc. |
| Sector: Services & Goods | |
| SubSector: Specialty Retail | |
| MarketCap: 234 Millions | |
| Recent Price: 1.06 Smart Investing & Trading Score: 26 | |
| Day Percent Change: -3.64% Day Change: -0.04 | |
| Week Change: -3.64% Year-to-date Change: 32.5% | |
| BARK Links: Profile News Message Board | |
| Charts:- Daily , Weekly | |
| Add BARK to Watchlist: View: Get Complete BARK Trend Analysis ➞ | |
 | BOWL Bowlero Corp. |
| Sector: Services & Goods | |
| SubSector: Leisure | |
| MarketCap: 2000 Millions | |
| Recent Price: 11.89 Smart Investing & Trading Score: 26 | |
| Day Percent Change: -3.65% Day Change: -0.45 | |
| Week Change: -3.65% Year-to-date Change: -15.8% | |
| BOWL Links: Profile News Message Board | |
| Charts:- Daily , Weekly | |
| Add BOWL to Watchlist: View: Get Complete BOWL Trend Analysis ➞ | |
 | TTI TETRA Technologies, Inc. |
| Sector: Energy | |
| SubSector: Oil & Gas Equipment & Services | |
| MarketCap: 56.9461 Millions | |
| Recent Price: 4.46 Smart Investing & Trading Score: 44 | |
| Day Percent Change: -3.67% Day Change: -0.17 | |
| Week Change: -3.67% Year-to-date Change: -1.3% | |
| TTI Links: Profile News Message Board | |
| Charts:- Daily , Weekly | |
| Add TTI to Watchlist: View: Get Complete TTI Trend Analysis ➞ | |
 | FSLY Fastly, Inc. |
| Sector: Technology | |
| SubSector: Application Software | |
| MarketCap: 1973.72 Millions | |
| Recent Price: 13.13 Smart Investing & Trading Score: 25 | |
| Day Percent Change: -3.67% Day Change: -0.50 | |
| Week Change: -3.67% Year-to-date Change: -26.2% | |
| FSLY Links: Profile News Message Board | |
| Charts:- Daily , Weekly | |
| Add FSLY to Watchlist: View: Get Complete FSLY Trend Analysis ➞ | |
 | ARCT Arcturus Therapeutics Holdings Inc. |
| Sector: Health Care | |
| SubSector: Biotechnology | |
| MarketCap: 241.385 Millions | |
| Recent Price: 29.31 Smart Investing & Trading Score: 0 | |
| Day Percent Change: -3.68% Day Change: -1.12 | |
| Week Change: -3.68% Year-to-date Change: -7.0% | |
| ARCT Links: Profile News Message Board | |
| Charts:- Daily , Weekly | |
| Add ARCT to Watchlist: View: Get Complete ARCT Trend Analysis ➞ | |
 | FGEN FibroGen, Inc. |
| Sector: Health Care | |
| SubSector: Biotechnology | |
| MarketCap: 2502.95 Millions | |
| Recent Price: 1.31 Smart Investing & Trading Score: 27 | |
| Day Percent Change: -3.68% Day Change: -0.05 | |
| Week Change: -3.68% Year-to-date Change: 47.8% | |
| FGEN Links: Profile News Message Board | |
| Charts:- Daily , Weekly | |
| Add FGEN to Watchlist: View: Get Complete FGEN Trend Analysis ➞ | |
 | ARDX Ardelyx, Inc. |
| Sector: Health Care | |
| SubSector: Biotechnology | |
| MarketCap: 541.985 Millions | |
| Recent Price: 6.80 Smart Investing & Trading Score: 0 | |
| Day Percent Change: -3.68% Day Change: -0.26 | |
| Week Change: -3.68% Year-to-date Change: 9.7% | |
| ARDX Links: Profile News Message Board | |
| Charts:- Daily , Weekly | |
| Add ARDX to Watchlist: View: Get Complete ARDX Trend Analysis ➞ | |
 | UPWK Upwork Inc. |
| Sector: Technology | |
| SubSector: Internet Information Providers | |
| MarketCap: 815.98 Millions | |
| Recent Price: 11.20 Smart Investing & Trading Score: 10 | |
| Day Percent Change: -3.70% Day Change: -0.43 | |
| Week Change: -3.7% Year-to-date Change: -24.7% | |
| UPWK Links: Profile News Message Board | |
| Charts:- Daily , Weekly | |
| Add UPWK to Watchlist: View: Get Complete UPWK Trend Analysis ➞ | |
 | BIGC BigCommerce Holdings, Inc. |
| Sector: Technology | |
| SubSector: Software Application | |
| MarketCap: 47587 Millions | |
| Recent Price: 5.98 Smart Investing & Trading Score: 0 | |
| Day Percent Change: -3.70% Day Change: -0.23 | |
| Week Change: -3.7% Year-to-date Change: -38.6% | |
| BIGC Links: Profile News Message Board | |
| Charts:- Daily , Weekly | |
| Add BIGC to Watchlist: View: Get Complete BIGC Trend Analysis ➞ | |
| Too many stocks? View smallcap stocks filtered by marketcap & sector |
| Marketcap: All SmallCap Stocks (default-no microcap), Large, Mid-Range, Small & MicroCap |
| Sector: Tech, Finance, Energy, Staples, Retail, Industrial, Materials, Utilities & Medical |
|
Best Stocks Today 12Stocks.com |
© 2024 12Stocks.com Terms & Conditions Privacy Contact Us
All Information Provided Only For Education And Not To Be Used For Investing or Trading. See Terms & Conditions


One More Thing ... Get Best Stocks Delivered Daily!
Never Ever Miss A Move With Our Top Ten Stocks Lists
Find Best Stocks In Any Market - Bull or Bear Market
Take A Peek At Our Top Ten Stocks Lists: Daily, Weekly, Year-to-Date & Top Trends
Find Best Stocks In Any Market - Bull or Bear Market
Take A Peek At Our Top Ten Stocks Lists: Daily, Weekly, Year-to-Date & Top Trends
Smallcap Stocks With Best Up Trends [0-bearish to 100-bullish]: Snap One[100], ProKidney [100], SES AI[100], Encore Wire[100], Century Aluminum[100], Core Molding[100], Theravance Biopharma[100], Acadia Realty[100], Prelude [100], Alpine Immune[100], Argan [100]
Best Smallcap Stocks Year-to-Date:
CareMax [570.1%], Janux [382.64%], Viking [259.81%], Alpine Immune[238.34%], Arcutis Bio[212.38%], Super Micro[210.54%], Vera [200.58%], Longboard [198.69%], Avidity Biosciences[164.49%], Veritone [151.1%], Stoke [132.13%] Best Smallcap Stocks This Week:
Snap One[29.48%], ProKidney [19.43%], Piedmont Lithium[15.77%], SES AI[15.44%], Eagle [13.29%], Encore Wire[11.59%], ESSA Bancorp[8.88%], Benson Hill[8.4%], Pulse Biosciences[8.31%], Century Aluminum[7.71%], Core Molding[7.45%] Best Smallcap Stocks Daily:
Snap One[29.48%], ProKidney [19.43%], Piedmont Lithium[15.77%], SES AI[15.44%], Eagle [13.29%], Encore Wire[11.59%], ESSA Bancorp[8.88%], Benson Hill[8.40%], Pulse Biosciences[8.31%], Century Aluminum[7.71%], Core Molding[7.45%]