
 Login Sign Up


| |||||
 |  | ||||

| 12Stocks.com Market Intelligence |
Best SmallCap Stocks
|
| In a hurry? Small Cap Stock Lists: Performance Trends Table, Stock Charts
Sort Small Cap stocks: Daily, Weekly, Year-to-Date, Market Cap & Trends. Filter Small Cap stocks list by sector: Show all, Tech, Finance, Energy, Staples, Retail, Industrial, Materials, Utilities and HealthCare Filter Small Cap stocks list by size: All Large Medium Small and MicroCap |
| 12Stocks.com Small Cap Stocks Performances & Trends Daily | |||||||||
|
|  The overall Smart Investing & Trading Score is 44 (0-bearish to 100-bullish) which puts Small Cap index in short term neutral trend. The Smart Investing & Trading Score from previous trading session is 58 and hence a deterioration of trend.
| ||||||||
Here are the Smart Investing & Trading Scores of the most requested small cap stocks at 12Stocks.com (click stock name for detailed review):
|


| 12Stocks.com: Investing in Smallcap Index with Stocks | |
|
The following table helps investors and traders sort through current performance and trends (as measured by Smart Investing & Trading Score) of various
stocks in the Smallcap Index. Quick View: Move mouse or cursor over stock symbol (ticker) to view short-term technical chart and over stock name to view long term chart. Click on  to add stock symbol to your watchlist and to add stock symbol to your watchlist and  to view watchlist. Click on any ticker or stock name for detailed market intelligence report for that stock. to view watchlist. Click on any ticker or stock name for detailed market intelligence report for that stock. |
12Stocks.com Performance of Stocks in Smallcap Index
| Ticker | Stock Name | Watchlist | Category | Recent Price | Smart Investing & Trading Score | Change % | Weekly Change% |
| FSBW | FS Bancorp |   | Financials | 31.44 | 25 | 0.19% | -0.19% |
| VZIO | VIZIO Holding | | Technology | 10.76 | 54 | -0.23% | -0.19% |
| CLW | Clearwater Paper | | Consumer Staples | 39.95 | 68 | -1.77% | -0.20% |
| CIO | City Office | | Financials | 4.56 | 45 | -0.22% | -0.22% |
| SITC | SITE Centers | | Financials | 13.62 | 46 | -1.02% | -0.22% |
| ALE | ALLETE | | Utilities | 59.57 | 86 | -0.65% | -0.23% |
| CNX | CNX Resources | | Energy | 23.94 | 61 | -1.12% | -0.25% |
| RAMP | LiveRamp | | Technology | 31.99 | 20 | -1.14% | -0.25% |
| PECO | Phillips Edison | | Financials | 32.93 | 17 | -0.66% | -0.27% |
| DJCO | Daily Journal | | Services & Goods | 347.00 | 68 | -1.70% | -0.28% |
| VVI | Viad Corp | | Services & Goods | 34.62 | 56 | -2.37% | -0.29% |
| ROCK | Gibraltar Industries | | Materials | 71.11 | 18 | -0.84% | -0.29% |
| ZIP | ZipRecruiter | | Industrials | 10.49 | 28 | -0.14% | -0.29% |
| RCKY | Rocky Brands | | Consumer Staples | 26.58 | 67 | -3.06% | -0.30% |
| IPI | Intrepid Potash | | Materials | 19.60 | 61 | -0.66% | -0.31% |
| SUPN | Supernus | | Health Care | 29.31 | 68 | -3.14% | -0.31% |
| EQC | Equity Commonwealth | | Financials | 18.62 | 45 | -0.21% | -0.32% |
| ESRT | Empire State | | Financials | 9.12 | 42 | -2.56% | -0.33% |
| ITCI | Intra-Cellular Therapies | | Health Care | 72.13 | 83 | -1.35% | -0.33% |
| PCH | PotlatchDeltic | | Industrials | 41.04 | 18 | -0.89% | -0.36% |
| UIS | Unisys | | Technology | 5.46 | 35 | -1.44% | -0.36% |
| DORM | Dorman Products | | Consumer Staples | 88.08 | 61 | -1.93% | -0.36% |
| SHLS | Shoals | | Technology | 8.26 | 10 | -1.84% | -0.36% |
| CERE | Cerevel | | Health Care | 42.00 | 40 | 0.31% | -0.37% |
| PFIS | Peoples Financial | | Financials | 37.95 | 35 | -2.04% | -0.37% |


| Too many stocks? View smallcap stocks filtered by marketcap & sector |
| Marketcap: All SmallCap Stocks (default-no microcap), Large, Mid-Range, Small |
| Smallcap Sector: Tech, Finance, Energy, Staples, Retail, Industrial, Materials, & Medical |
|
Get the most comprehensive stock market coverage daily at 12Stocks.com ➞ Best Stocks Today ➞ Best Stocks Weekly ➞ Best Stocks Year-to-Date ➞ Best Stocks Trends ➞  Best Stocks Today 12Stocks.com Best Nasdaq Stocks ➞ Best S&P 500 Stocks ➞ Best Tech Stocks ➞ Best Biotech Stocks ➞ |
| Detailed Overview of SmallCap Stocks |
| SmallCap Technical Overview, Leaders & Laggards, Top SmallCap ETF Funds & Detailed SmallCap Stocks List, Charts, Trends & More |
| Smallcap: Technical Analysis, Trends & YTD Performance | |
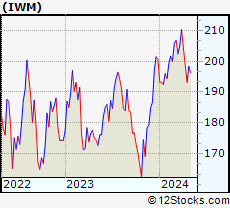
| SmallCap segment as represented by
IWM, an exchange-traded fund [ETF], holds basket of thousands of smallcap stocks from across all major sectors of the US stock market. The smallcap index (contains stocks like Riverbed & Sotheby's) is down by -2.11% and is currently underperforming the overall market by -7.27% year-to-date. Below is a quick view of technical charts and trends: | |
 IWM Weekly Chart |
|
| Long Term Trend: Good | |
| Medium Term Trend: Not Good | |
 IWM Daily Chart |
|
| Short Term Trend: Very Good | |
| Overall Trend Score: 44 | |
| YTD Performance: -2.11% | |
| **Trend Scores & Views Are Only For Educational Purposes And Not For Investing | |
| 12Stocks.com: Top Performing Small Cap Index Stocks | ||||||||||||||||||||||||||||||||||||||||||||||||
 The top performing Small Cap Index stocks year to date are
Now, more recently, over last week, the top performing Small Cap Index stocks on the move are


|
||||||||||||||||||||||||||||||||||||||||||||||||
| 12Stocks.com: Investing in Smallcap Index using Exchange Traded Funds | |
|
The following table shows list of key exchange traded funds (ETF) that
help investors track Smallcap index. The following list also includes leveraged ETF funds that track twice or thrice the daily returns of Smallcap indices. Short or inverse ETF funds move in the opposite direction to the index they track and are useful during market pullbacks or during bear markets. Quick View: Move mouse or cursor over ETF symbol (ticker) to view short-term technical chart and over ETF name to view long term chart. Click on ticker or stock name for detailed view. Click on to add stock symbol to your watchlist and to view watchlist. |
12Stocks.com List of ETFs that track Smallcap Index
| Ticker | ETF Name | Watchlist | Recent Price | Smart Investing & Trading Score | Change % | Week % | Year-to-date % |
| IWM | iShares Russell 2000 | | 196.48 | 44 | -0.61 | 1.73 | -2.11% |
| IJR | iShares Core S&P Small-Cap | | 104.86 | 78 | -0.80 | 1.59 | -3.13% |
| VTWO | Vanguard Russell 2000 ETF | | 79.45 | 63 | -0.60 | 1.75 | -2.03% |
| IWN | iShares Russell 2000 Value | | 150.18 | 68 | -0.73 | 1.62 | -3.32% |
| IWO | iShares Russell 2000 Growth | | 249.86 | 51 | -0.56 | 1.86 | -0.94% |
| IJS | iShares S&P Small-Cap 600 Value | | 96.69 | 60 | -1.04 | 1.13 | -6.19% |
| IJT | iShares S&P Small-Cap 600 Growth | | 125.06 | 63 | -0.25 | 2.33 | -0.06% |
| XSLV | PowerShares S&P SmallCap Low Volatil ETF | | 42.54 | 73 | -0.93 | 0.85 | -3.65% |
| SDD | ProShares UltraShort SmallCap600 | | 19.58 | 42 | 0.46 | -3.74 | 6.26% |
| SBB | ProShares Short SmallCap600 | | 16.50 | 40 | 0.79 | -2.02 | 3.58% |
| SMLV | SPDR SSGA US Small Cap Low Volatil ETF | | 107.33 | 73 | -1.01 | 1.17 | -4.61% |
| SAA | ProShares Ultra SmallCap600 | | 22.66 | 58 | -1.52 | 3.94 | -9.18% |
| 12Stocks.com: Charts, Trends, Fundamental Data and Performances of SmallCap Stocks | |
|
We now take in-depth look at all SmallCap stocks including charts, multi-period performances and overall trends (as measured by Smart Investing & Trading Score). One can sort SmallCap stocks (click link to choose) by Daily, Weekly and by Year-to-Date performances. Also, one can sort by size of the company or by market capitalization. |
| Select Your Default Chart Type: | |||||
| |||||
| Click on stock symbol or name for detailed view. Click on to add stock symbol to your watchlist and to view watchlist. Quick View: Move mouse or cursor over "Daily" to quickly view daily technical stock chart and over "Weekly" to view weekly technical stock chart. | |||||

 | FSBW FS Bancorp, Inc. |
| Sector: Financials | |
| SubSector: Regional - Pacific Banks | |
| MarketCap: 140.429 Millions | |
| Recent Price: 31.44 Smart Investing & Trading Score: 25 | |
| Day Percent Change: 0.19% Day Change: 0.06 | |
| Week Change: -0.19% Year-to-date Change: -14.9% | |
| FSBW Links: Profile News Message Board | |
| Charts:- Daily , Weekly | |
| Add FSBW to Watchlist: View: Get Complete FSBW Trend Analysis ➞ | |
 | VZIO VIZIO Holding Corp. |
| Sector: Technology | |
| SubSector: Consumer Electronics | |
| MarketCap: 1300 Millions | |
| Recent Price: 10.76 Smart Investing & Trading Score: 54 | |
| Day Percent Change: -0.23% Day Change: -0.03 | |
| Week Change: -0.19% Year-to-date Change: 39.6% | |
| VZIO Links: Profile News Message Board | |
| Charts:- Daily , Weekly | |
| Add VZIO to Watchlist: View: Get Complete VZIO Trend Analysis ➞ | |
 | CLW Clearwater Paper Corporation |
| Sector: Consumer Staples | |
| SubSector: Paper & Paper Products | |
| MarketCap: 416.803 Millions | |
| Recent Price: 39.95 Smart Investing & Trading Score: 68 | |
| Day Percent Change: -1.77% Day Change: -0.72 | |
| Week Change: -0.2% Year-to-date Change: 10.6% | |
| CLW Links: Profile News Message Board | |
| Charts:- Daily , Weekly | |
| Add CLW to Watchlist: View: Get Complete CLW Trend Analysis ➞ | |
 | CIO City Office REIT, Inc. |
| Sector: Financials | |
| SubSector: REIT - Office | |
| MarketCap: 478.566 Millions | |
| Recent Price: 4.56 Smart Investing & Trading Score: 45 | |
| Day Percent Change: -0.22% Day Change: -0.01 | |
| Week Change: -0.22% Year-to-date Change: -25.4% | |
| CIO Links: Profile News Message Board | |
| Charts:- Daily , Weekly | |
| Add CIO to Watchlist: View: Get Complete CIO Trend Analysis ➞ | |
 | SITC SITE Centers Corp. |
| Sector: Financials | |
| SubSector: REIT - Retail | |
| MarketCap: 1449.54 Millions | |
| Recent Price: 13.62 Smart Investing & Trading Score: 46 | |
| Day Percent Change: -1.02% Day Change: -0.14 | |
| Week Change: -0.22% Year-to-date Change: -0.1% | |
| SITC Links: Profile News Message Board | |
| Charts:- Daily , Weekly | |
| Add SITC to Watchlist: View: Get Complete SITC Trend Analysis ➞ | |
 | ALE ALLETE, Inc. |
| Sector: Utilities | |
| SubSector: Diversified Utilities | |
| MarketCap: 3145.4 Millions | |
| Recent Price: 59.57 Smart Investing & Trading Score: 86 | |
| Day Percent Change: -0.65% Day Change: -0.39 | |
| Week Change: -0.23% Year-to-date Change: -2.6% | |
| ALE Links: Profile News Message Board | |
| Charts:- Daily , Weekly | |
| Add ALE to Watchlist: View: Get Complete ALE Trend Analysis ➞ | |
 | CNX CNX Resources Corporation |
| Sector: Energy | |
| SubSector: Independent Oil & Gas | |
| MarketCap: 1344.33 Millions | |
| Recent Price: 23.94 Smart Investing & Trading Score: 61 | |
| Day Percent Change: -1.12% Day Change: -0.27 | |
| Week Change: -0.25% Year-to-date Change: 19.7% | |
| CNX Links: Profile News Message Board | |
| Charts:- Daily , Weekly | |
| Add CNX to Watchlist: View: Get Complete CNX Trend Analysis ➞ | |
 | RAMP LiveRamp Holdings, Inc. |
| Sector: Technology | |
| SubSector: Information Technology Services | |
| MarketCap: 2124.38 Millions | |
| Recent Price: 31.99 Smart Investing & Trading Score: 20 | |
| Day Percent Change: -1.14% Day Change: -0.37 | |
| Week Change: -0.25% Year-to-date Change: -15.6% | |
| RAMP Links: Profile News Message Board | |
| Charts:- Daily , Weekly | |
| Add RAMP to Watchlist: View: Get Complete RAMP Trend Analysis ➞ | |
 | PECO Phillips Edison & Company, Inc. |
| Sector: Financials | |
| SubSector: REIT - Retail | |
| MarketCap: 3920 Millions | |
| Recent Price: 32.93 Smart Investing & Trading Score: 17 | |
| Day Percent Change: -0.66% Day Change: -0.22 | |
| Week Change: -0.27% Year-to-date Change: -10.6% | |
| PECO Links: Profile News Message Board | |
| Charts:- Daily , Weekly | |
| Add PECO to Watchlist: View: Get Complete PECO Trend Analysis ➞ | |
 | DJCO Daily Journal Corporation |
| Sector: Services & Goods | |
| SubSector: Publishing - Newspapers | |
| MarketCap: 306.822 Millions | |
| Recent Price: 347.00 Smart Investing & Trading Score: 68 | |
| Day Percent Change: -1.70% Day Change: -6.00 | |
| Week Change: -0.28% Year-to-date Change: 1.8% | |
| DJCO Links: Profile News Message Board | |
| Charts:- Daily , Weekly | |
| Add DJCO to Watchlist: View: Get Complete DJCO Trend Analysis ➞ | |
 | VVI Viad Corp |
| Sector: Services & Goods | |
| SubSector: Business Services | |
| MarketCap: 270.682 Millions | |
| Recent Price: 34.62 Smart Investing & Trading Score: 56 | |
| Day Percent Change: -2.37% Day Change: -0.84 | |
| Week Change: -0.29% Year-to-date Change: -4.4% | |
| VVI Links: Profile News Message Board | |
| Charts:- Daily , Weekly | |
| Add VVI to Watchlist: View: Get Complete VVI Trend Analysis ➞ | |
 | ROCK Gibraltar Industries, Inc. |
| Sector: Materials | |
| SubSector: Steel & Iron | |
| MarketCap: 1341.08 Millions | |
| Recent Price: 71.11 Smart Investing & Trading Score: 18 | |
| Day Percent Change: -0.84% Day Change: -0.60 | |
| Week Change: -0.29% Year-to-date Change: -10.0% | |
| ROCK Links: Profile News Message Board | |
| Charts:- Daily , Weekly | |
| Add ROCK to Watchlist: View: Get Complete ROCK Trend Analysis ➞ | |
 | ZIP ZipRecruiter, Inc. |
| Sector: Industrials | |
| SubSector: Staffing & Employment Services | |
| MarketCap: 1730 Millions | |
| Recent Price: 10.49 Smart Investing & Trading Score: 28 | |
| Day Percent Change: -0.14% Day Change: -0.02 | |
| Week Change: -0.29% Year-to-date Change: -25.2% | |
| ZIP Links: Profile News Message Board | |
| Charts:- Daily , Weekly | |
| Add ZIP to Watchlist: View: Get Complete ZIP Trend Analysis ➞ | |
 | RCKY Rocky Brands, Inc. |
| Sector: Consumer Staples | |
| SubSector: Textile - Apparel Footwear & Accessories | |
| MarketCap: 137.47 Millions | |
| Recent Price: 26.58 Smart Investing & Trading Score: 67 | |
| Day Percent Change: -3.06% Day Change: -0.84 | |
| Week Change: -0.3% Year-to-date Change: -11.9% | |
| RCKY Links: Profile News Message Board | |
| Charts:- Daily , Weekly | |
| Add RCKY to Watchlist: View: Get Complete RCKY Trend Analysis ➞ | |
 | IPI Intrepid Potash, Inc. |
| Sector: Materials | |
| SubSector: Agricultural Chemicals | |
| MarketCap: 160.329 Millions | |
| Recent Price: 19.60 Smart Investing & Trading Score: 61 | |
| Day Percent Change: -0.66% Day Change: -0.13 | |
| Week Change: -0.31% Year-to-date Change: -18.0% | |
| IPI Links: Profile News Message Board | |
| Charts:- Daily , Weekly | |
| Add IPI to Watchlist: View: Get Complete IPI Trend Analysis ➞ | |
 | SUPN Supernus Pharmaceuticals, Inc. |
| Sector: Health Care | |
| SubSector: Drugs - Generic | |
| MarketCap: 833.585 Millions | |
| Recent Price: 29.31 Smart Investing & Trading Score: 68 | |
| Day Percent Change: -3.14% Day Change: -0.95 | |
| Week Change: -0.31% Year-to-date Change: 1.3% | |
| SUPN Links: Profile News Message Board | |
| Charts:- Daily , Weekly | |
| Add SUPN to Watchlist: View: Get Complete SUPN Trend Analysis ➞ | |
 | EQC Equity Commonwealth |
| Sector: Financials | |
| SubSector: REIT - Office | |
| MarketCap: 3659.36 Millions | |
| Recent Price: 18.62 Smart Investing & Trading Score: 45 | |
| Day Percent Change: -0.21% Day Change: -0.04 | |
| Week Change: -0.32% Year-to-date Change: -3.0% | |
| EQC Links: Profile News Message Board | |
| Charts:- Daily , Weekly | |
| Add EQC to Watchlist: View: Get Complete EQC Trend Analysis ➞ | |
 | ESRT Empire State Realty Trust, Inc. |
| Sector: Financials | |
| SubSector: REIT - Diversified | |
| MarketCap: 1632.13 Millions | |
| Recent Price: 9.12 Smart Investing & Trading Score: 42 | |
| Day Percent Change: -2.56% Day Change: -0.24 | |
| Week Change: -0.33% Year-to-date Change: -5.9% | |
| ESRT Links: Profile News Message Board | |
| Charts:- Daily , Weekly | |
| Add ESRT to Watchlist: View: Get Complete ESRT Trend Analysis ➞ | |
 | ITCI Intra-Cellular Therapies, Inc. |
| Sector: Health Care | |
| SubSector: Biotechnology | |
| MarketCap: 991.885 Millions | |
| Recent Price: 72.13 Smart Investing & Trading Score: 83 | |
| Day Percent Change: -1.35% Day Change: -0.99 | |
| Week Change: -0.33% Year-to-date Change: 0.7% | |
| ITCI Links: Profile News Message Board | |
| Charts:- Daily , Weekly | |
| Add ITCI to Watchlist: View: Get Complete ITCI Trend Analysis ➞ | |
 | PCH PotlatchDeltic Corporation |
| Sector: Industrials | |
| SubSector: Lumber, Wood Production | |
| MarketCap: 2314.68 Millions | |
| Recent Price: 41.04 Smart Investing & Trading Score: 18 | |
| Day Percent Change: -0.89% Day Change: -0.37 | |
| Week Change: -0.36% Year-to-date Change: -16.4% | |
| PCH Links: Profile News Message Board | |
| Charts:- Daily , Weekly | |
| Add PCH to Watchlist: View: Get Complete PCH Trend Analysis ➞ | |
 | UIS Unisys Corporation |
| Sector: Technology | |
| SubSector: Information Technology Services | |
| MarketCap: 803.868 Millions | |
| Recent Price: 5.46 Smart Investing & Trading Score: 35 | |
| Day Percent Change: -1.44% Day Change: -0.08 | |
| Week Change: -0.36% Year-to-date Change: -2.9% | |
| UIS Links: Profile News Message Board | |
| Charts:- Daily , Weekly | |
| Add UIS to Watchlist: View: Get Complete UIS Trend Analysis ➞ | |
 | DORM Dorman Products, Inc. |
| Sector: Consumer Staples | |
| SubSector: Auto Parts | |
| MarketCap: 2028.79 Millions | |
| Recent Price: 88.08 Smart Investing & Trading Score: 61 | |
| Day Percent Change: -1.93% Day Change: -1.73 | |
| Week Change: -0.36% Year-to-date Change: 5.6% | |
| DORM Links: Profile News Message Board | |
| Charts:- Daily , Weekly | |
| Add DORM to Watchlist: View: Get Complete DORM Trend Analysis ➞ | |
 | SHLS Shoals Technologies Group, Inc. |
| Sector: Technology | |
| SubSector: Solar | |
| MarketCap: 4360 Millions | |
| Recent Price: 8.26 Smart Investing & Trading Score: 10 | |
| Day Percent Change: -1.84% Day Change: -0.15 | |
| Week Change: -0.36% Year-to-date Change: -46.7% | |
| SHLS Links: Profile News Message Board | |
| Charts:- Daily , Weekly | |
| Add SHLS to Watchlist: View: Get Complete SHLS Trend Analysis ➞ | |
 | CERE Cerevel Therapeutics Holdings, Inc. |
| Sector: Health Care | |
| SubSector: Biotechnology | |
| MarketCap: 21587 Millions | |
| Recent Price: 42.00 Smart Investing & Trading Score: 40 | |
| Day Percent Change: 0.31% Day Change: 0.13 | |
| Week Change: -0.37% Year-to-date Change: -0.9% | |
| CERE Links: Profile News Message Board | |
| Charts:- Daily , Weekly | |
| Add CERE to Watchlist: View: Get Complete CERE Trend Analysis ➞ | |
 | PFIS Peoples Financial Services Corp. |
| Sector: Financials | |
| SubSector: Regional - Northeast Banks | |
| MarketCap: 305.499 Millions | |
| Recent Price: 37.95 Smart Investing & Trading Score: 35 | |
| Day Percent Change: -2.04% Day Change: -0.79 | |
| Week Change: -0.37% Year-to-date Change: -22.1% | |
| PFIS Links: Profile News Message Board | |
| Charts:- Daily , Weekly | |
| Add PFIS to Watchlist: View: Get Complete PFIS Trend Analysis ➞ | |
| Too many stocks? View smallcap stocks filtered by marketcap & sector |
| Marketcap: All SmallCap Stocks (default-no microcap), Large, Mid-Range, Small & MicroCap |
| Sector: Tech, Finance, Energy, Staples, Retail, Industrial, Materials, Utilities & Medical |
|
Best Stocks Today 12Stocks.com |
© 2024 12Stocks.com Terms & Conditions Privacy Contact Us
All Information Provided Only For Education And Not To Be Used For Investing or Trading. See Terms & Conditions


One More Thing ... Get Best Stocks Delivered Daily!
Never Ever Miss A Move With Our Top Ten Stocks Lists
Find Best Stocks In Any Market - Bull or Bear Market
Take A Peek At Our Top Ten Stocks Lists: Daily, Weekly, Year-to-Date & Top Trends
Find Best Stocks In Any Market - Bull or Bear Market
Take A Peek At Our Top Ten Stocks Lists: Daily, Weekly, Year-to-Date & Top Trends
Smallcap Stocks With Best Up Trends [0-bearish to 100-bullish]: B. Riley[100], Central Pacific[100], California Water[100], Cricut [100], Carpenter [100], Haemonetics [100], Sanmina [100], Trustmark [100], Comstock Resources[100], EchoStar [100], Mueller Industries[100]
Best Smallcap Stocks Year-to-Date:
CareMax [490.72%], Janux [338.34%], Viking [270.02%], Alpine Immune[239.52%], Longboard [218%], Super Micro[177%], Arcutis Bio[166.56%], Avidity Biosciences[159.79%], Vera [149.94%], Hippo [128.87%], Stoke [122.15%] Best Smallcap Stocks This Week:
Matterport [168.97%], B. Riley[73.54%], Impinj [33.73%], ProKidney [32.84%], Seres [32.65%], Riot Blockchain[32.64%], Ribbon [25.58%], Cullinan Oncology[22.92%], P.A.M. Transportation[22.85%], NuScale Power[21.44%], Hibbett Sports[21.03%] Best Smallcap Stocks Daily:
Impinj [28.65%], P.A.M. Transportation[17.95%], B. Riley[16.61%], Strategic Education[16.28%], OptiNose [14.56%], JELD-WEN Holding[11.54%], Sonic Automotive[10.86%], Intevac [10.54%], SiTime [8.84%], Noodles & [8.08%], ProKidney [7.75%]