
 Login Sign Up


| |||||
 |  | ||||

| 12Stocks.com Market Intelligence |
Best SmallCap Stocks
|
| In a hurry? Small Cap Stock Lists: Performance Trends Table, Stock Charts
Sort Small Cap stocks: Daily, Weekly, Year-to-Date, Market Cap & Trends. Filter Small Cap stocks list by sector: Show all, Tech, Finance, Energy, Staples, Retail, Industrial, Materials, Utilities and HealthCare Filter Small Cap stocks list by size: All Large Medium Small and MicroCap |
| 12Stocks.com Small Cap Stocks Performances & Trends Daily | |||||||||
|
|  The overall Smart Investing & Trading Score is 23 (0-bearish to 100-bullish) which puts Small Cap index in short term bearish to neutral trend. The Smart Investing & Trading Score from previous trading session is 13 and hence an improvement of trend.
| ||||||||
Here are the Smart Investing & Trading Scores of the most requested small cap stocks at 12Stocks.com (click stock name for detailed review):
|


| 12Stocks.com: Investing in Smallcap Index with Stocks | |
|
The following table helps investors and traders sort through current performance and trends (as measured by Smart Investing & Trading Score) of various
stocks in the Smallcap Index. Quick View: Move mouse or cursor over stock symbol (ticker) to view short-term technical chart and over stock name to view long term chart. Click on  to add stock symbol to your watchlist and to add stock symbol to your watchlist and  to view watchlist. Click on any ticker or stock name for detailed market intelligence report for that stock. to view watchlist. Click on any ticker or stock name for detailed market intelligence report for that stock. |
12Stocks.com Performance of Stocks in Smallcap Index
| Ticker | Stock Name | Watchlist | Category | Recent Price | Smart Investing & Trading Score | Change % | Weekly Change% |
| LZB | La-Z-Boy |   | Consumer Staples | 33.43 | 25 | 1.36% | -1.59% |
| FBIZ | First Business | | Financials | 33.70 | 18 | 1.11% | -1.61% |
| KTOS | Kratos Defense | | Services & Goods | 17.91 | 43 | 1.73% | -1.62% |
| TNC | Tennant | | Industrials | 115.25 | 48 | 0.45% | -1.63% |
| HRMY | Harmony Biosciences | | Health Care | 29.02 | 20 | -0.10% | -1.63% |
| ZETA | Zeta Global | | Technology | 11.77 | 66 | -0.55% | -1.63% |
| HSTM | HealthStream | | Technology | 24.36 | 0 | 1.52% | -1.64% |
| EGBN | Eagle Bancorp | | Financials | 20.98 | 27 | 2.24% | -1.64% |
| SCHL | Scholastic | | Services & Goods | 35.17 | 10 | 0.98% | -1.65% |
| HELE | Helen of Troy | | Consumer Staples | 98.20 | 32 | -0.19% | -1.65% |
| FCCO | First Community | | Financials | 16.10 | 18 | 0.94% | -1.65% |
| NWFL | Norwood Financial | | Financials | 23.83 | 10 | 1.19% | -1.65% |
| JBT | John Bean | | Industrials | 91.11 | 10 | 1.56% | -1.65% |
| TDS | Telephone and | | Technology | 15.39 | 20 | 1.58% | -1.66% |
| CWCO | Consolidated Water | | Utilities | 24.24 | 20 | 0.54% | -1.66% |
| BANC | Banc of California | | Financials | 13.93 | 33 | 0.91% | -1.66% |
| HZO | MarineMax | | Services & Goods | 26.99 | 10 | 1.16% | -1.68% |
| DAKT | Daktronics | | Technology | 9.32 | 58 | 1.08% | -1.69% |
| TCMD | Tactile Systems | | Health Care | 14.53 | 18 | 2.76% | -1.69% |
| CALX | Calix | | Technology | 29.77 | 28 | 1.14% | -1.70% |
| BOWL | Bowlero | | Services & Goods | 12.13 | 58 | 0.00% | -1.70% |
| IDT | IDT | | Technology | 36.31 | 36 | 1.06% | -1.71% |
| PLUS | ePlus | | Technology | 75.75 | 13 | 0.62% | -1.71% |
| ENSG | Ensign Group | | Health Care | 117.25 | 26 | 0.66% | -1.71% |
| COLL | Collegium Pharmaceutical | | Health Care | 35.10 | 36 | 0.95% | -1.71% |
| For chart view version of above stock list: Chart View ➞ 0 - 25 , 25 - 50 , 50 - 75 , 75 - 100 , 100 - 125 , 125 - 150 , 150 - 175 , 175 - 200 , 200 - 225 , 225 - 250 , 250 - 275 , 275 - 300 , 300 - 325 , 325 - 350 , 350 - 375 , 375 - 400 , 400 - 425 , 425 - 450 , 450 - 475 , 475 - 500 , 500 - 525 , 525 - 550 , 550 - 575 , 575 - 600 , 600 - 625 , 625 - 650 , 650 - 675 , 675 - 700 , 700 - 725 , 725 - 750 , 750 - 775 , 775 - 800 , 800 - 825 , 825 - 850 , 850 - 875 , 875 - 900 , 900 - 925 , 925 - 950 , 950 - 975 , 975 - 1000 , 1000 - 1025 , 1025 - 1050 , 1050 - 1075 , 1075 - 1100 , 1100 - 1125 , 1125 - 1150 , 1150 - 1175 , 1175 - 1200 , 1200 - 1225 , 1225 - 1250 , 1250 - 1275 , 1275 - 1300 , 1300 - 1325 , 1325 - 1350 , 1350 - 1375 , 1375 - 1400 , 1400 - 1425 , 1425 - 1450 , 1450 - 1475 , 1475 - 1500 , 1500 - 1525 , 1525 - 1550 , 1550 - 1575 , 1575 - 1600 , 1600 - 1625 | ||
 | Click To Change The Sort Order: By Market Cap or Company Size Performance: Year-to-date, Week and Day |  |
| Too many stocks? View smallcap stocks filtered by marketcap & sector |
| Marketcap: All SmallCap Stocks (default-no microcap), Large, Mid-Range, Small |
| Smallcap Sector: Tech, Finance, Energy, Staples, Retail, Industrial, Materials, & Medical |
|
Get the most comprehensive stock market coverage daily at 12Stocks.com ➞ Best Stocks Today ➞ Best Stocks Weekly ➞ Best Stocks Year-to-Date ➞ Best Stocks Trends ➞  Best Stocks Today 12Stocks.com Best Nasdaq Stocks ➞ Best S&P 500 Stocks ➞ Best Tech Stocks ➞ Best Biotech Stocks ➞ |
| Detailed Overview of SmallCap Stocks |
| SmallCap Technical Overview, Leaders & Laggards, Top SmallCap ETF Funds & Detailed SmallCap Stocks List, Charts, Trends & More |
| Smallcap: Technical Analysis, Trends & YTD Performance | |
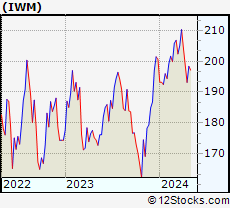
| SmallCap segment as represented by
IWM, an exchange-traded fund [ETF], holds basket of thousands of smallcap stocks from across all major sectors of the US stock market. The smallcap index (contains stocks like Riverbed & Sotheby's) is down by -3.3% and is currently underperforming the overall market by -7.65% year-to-date. Below is a quick view of technical charts and trends: | |
 IWM Weekly Chart |
|
| Long Term Trend: Not Good | |
| Medium Term Trend: Not Good | |
 IWM Daily Chart |
|
| Short Term Trend: Not Good | |
| Overall Trend Score: 23 | |
| YTD Performance: -3.3% | |
| **Trend Scores & Views Are Only For Educational Purposes And Not For Investing | |
| 12Stocks.com: Top Performing Small Cap Index Stocks | ||||||||||||||||||||||||||||||||||||||||||||||||
 The top performing Small Cap Index stocks year to date are
Now, more recently, over last week, the top performing Small Cap Index stocks on the move are


|
||||||||||||||||||||||||||||||||||||||||||||||||
| 12Stocks.com: Investing in Smallcap Index using Exchange Traded Funds | |
|
The following table shows list of key exchange traded funds (ETF) that
help investors track Smallcap index. The following list also includes leveraged ETF funds that track twice or thrice the daily returns of Smallcap indices. Short or inverse ETF funds move in the opposite direction to the index they track and are useful during market pullbacks or during bear markets. Quick View: Move mouse or cursor over ETF symbol (ticker) to view short-term technical chart and over ETF name to view long term chart. Click on ticker or stock name for detailed view. Click on to add stock symbol to your watchlist and to view watchlist. |
12Stocks.com List of ETFs that track Smallcap Index
| Ticker | ETF Name | Watchlist | Recent Price | Smart Investing & Trading Score | Change % | Week % | Year-to-date % |
| IWM | iShares Russell 2000 | | 194.08 | 23 | 0.64 | -2.32 | -3.3% |
| 12Stocks.com: Charts, Trends, Fundamental Data and Performances of SmallCap Stocks | |
|
We now take in-depth look at all SmallCap stocks including charts, multi-period performances and overall trends (as measured by Smart Investing & Trading Score). One can sort SmallCap stocks (click link to choose) by Daily, Weekly and by Year-to-Date performances. Also, one can sort by size of the company or by market capitalization. |
| Select Your Default Chart Type: | |||||
| |||||
| Click on stock symbol or name for detailed view. Click on to add stock symbol to your watchlist and to view watchlist. Quick View: Move mouse or cursor over "Daily" to quickly view daily technical stock chart and over "Weekly" to view weekly technical stock chart. | |||||

 | LZB La-Z-Boy Incorporated |
| Sector: Consumer Staples | |
| SubSector: Home Furnishings & Fixtures | |
| MarketCap: 951.635 Millions | |
| Recent Price: 33.43 Smart Investing & Trading Score: 25 | |
| Day Percent Change: 1.36% Day Change: 0.45 | |
| Week Change: -1.59% Year-to-date Change: -9.5% | |
| LZB Links: Profile News Message Board | |
| Charts:- Daily , Weekly | |
| Add LZB to Watchlist: View: Get Complete LZB Trend Analysis ➞ | |
 | FBIZ First Business Financial Services, Inc. |
| Sector: Financials | |
| SubSector: Regional - Midwest Banks | |
| MarketCap: 144.97 Millions | |
| Recent Price: 33.70 Smart Investing & Trading Score: 18 | |
| Day Percent Change: 1.11% Day Change: 0.37 | |
| Week Change: -1.61% Year-to-date Change: -16.0% | |
| FBIZ Links: Profile News Message Board | |
| Charts:- Daily , Weekly | |
| Add FBIZ to Watchlist: View: Get Complete FBIZ Trend Analysis ➞ | |
 | KTOS Kratos Defense & Security Solutions, Inc. |
| Sector: Services & Goods | |
| SubSector: Security & Protection Services | |
| MarketCap: 1369.63 Millions | |
| Recent Price: 17.91 Smart Investing & Trading Score: 43 | |
| Day Percent Change: 1.73% Day Change: 0.30 | |
| Week Change: -1.62% Year-to-date Change: -11.7% | |
| KTOS Links: Profile News Message Board | |
| Charts:- Daily , Weekly | |
| Add KTOS to Watchlist: View: Get Complete KTOS Trend Analysis ➞ | |
 | TNC Tennant Company |
| Sector: Industrials | |
| SubSector: Diversified Machinery | |
| MarketCap: 1097.96 Millions | |
| Recent Price: 115.25 Smart Investing & Trading Score: 48 | |
| Day Percent Change: 0.45% Day Change: 0.52 | |
| Week Change: -1.63% Year-to-date Change: 24.3% | |
| TNC Links: Profile News Message Board | |
| Charts:- Daily , Weekly | |
| Add TNC to Watchlist: View: Get Complete TNC Trend Analysis ➞ | |
 | HRMY Harmony Biosciences Holdings, Inc. |
| Sector: Health Care | |
| SubSector: Biotechnology | |
| MarketCap: 24487 Millions | |
| Recent Price: 29.02 Smart Investing & Trading Score: 20 | |
| Day Percent Change: -0.10% Day Change: -0.03 | |
| Week Change: -1.63% Year-to-date Change: -10.1% | |
| HRMY Links: Profile News Message Board | |
| Charts:- Daily , Weekly | |
| Add HRMY to Watchlist: View: Get Complete HRMY Trend Analysis ➞ | |
 | ZETA Zeta Global Holdings Corp. |
| Sector: Technology | |
| SubSector: Software - Application | |
| MarketCap: 1780 Millions | |
| Recent Price: 11.77 Smart Investing & Trading Score: 66 | |
| Day Percent Change: -0.55% Day Change: -0.06 | |
| Week Change: -1.63% Year-to-date Change: 33.3% | |
| ZETA Links: Profile News Message Board | |
| Charts:- Daily , Weekly | |
| Add ZETA to Watchlist: View: Get Complete ZETA Trend Analysis ➞ | |
 | HSTM HealthStream, Inc. |
| Sector: Technology | |
| SubSector: Healthcare Information Services | |
| MarketCap: 770.255 Millions | |
| Recent Price: 24.36 Smart Investing & Trading Score: 0 | |
| Day Percent Change: 1.52% Day Change: 0.37 | |
| Week Change: -1.64% Year-to-date Change: -9.9% | |
| HSTM Links: Profile News Message Board | |
| Charts:- Daily , Weekly | |
| Add HSTM to Watchlist: View: Get Complete HSTM Trend Analysis ➞ | |
 | EGBN Eagle Bancorp, Inc. |
| Sector: Financials | |
| SubSector: Regional - Mid-Atlantic Banks | |
| MarketCap: 906.559 Millions | |
| Recent Price: 20.98 Smart Investing & Trading Score: 27 | |
| Day Percent Change: 2.24% Day Change: 0.46 | |
| Week Change: -1.64% Year-to-date Change: -30.4% | |
| EGBN Links: Profile News Message Board | |
| Charts:- Daily , Weekly | |
| Add EGBN to Watchlist: View: Get Complete EGBN Trend Analysis ➞ | |
 | SCHL Scholastic Corporation |
| Sector: Services & Goods | |
| SubSector: Publishing - Books | |
| MarketCap: 791 Millions | |
| Recent Price: 35.17 Smart Investing & Trading Score: 10 | |
| Day Percent Change: 0.98% Day Change: 0.34 | |
| Week Change: -1.65% Year-to-date Change: -6.7% | |
| SCHL Links: Profile News Message Board | |
| Charts:- Daily , Weekly | |
| Add SCHL to Watchlist: View: Get Complete SCHL Trend Analysis ➞ | |
 | HELE Helen of Troy Limited |
| Sector: Consumer Staples | |
| SubSector: Housewares & Accessories | |
| MarketCap: 3199.53 Millions | |
| Recent Price: 98.20 Smart Investing & Trading Score: 32 | |
| Day Percent Change: -0.19% Day Change: -0.19 | |
| Week Change: -1.65% Year-to-date Change: -18.7% | |
| HELE Links: Profile News Message Board | |
| Charts:- Daily , Weekly | |
| Add HELE to Watchlist: View: Get Complete HELE Trend Analysis ➞ | |
 | FCCO First Community Corporation |
| Sector: Financials | |
| SubSector: Regional - Southwest Banks | |
| MarketCap: 123.865 Millions | |
| Recent Price: 16.10 Smart Investing & Trading Score: 18 | |
| Day Percent Change: 0.94% Day Change: 0.15 | |
| Week Change: -1.65% Year-to-date Change: -25.2% | |
| FCCO Links: Profile News Message Board | |
| Charts:- Daily , Weekly | |
| Add FCCO to Watchlist: View: Get Complete FCCO Trend Analysis ➞ | |
 | NWFL Norwood Financial Corp. |
| Sector: Financials | |
| SubSector: Regional - Northeast Banks | |
| MarketCap: 201.899 Millions | |
| Recent Price: 23.83 Smart Investing & Trading Score: 10 | |
| Day Percent Change: 1.19% Day Change: 0.28 | |
| Week Change: -1.65% Year-to-date Change: -27.6% | |
| NWFL Links: Profile News Message Board | |
| Charts:- Daily , Weekly | |
| Add NWFL to Watchlist: View: Get Complete NWFL Trend Analysis ➞ | |
 | JBT John Bean Technologies Corporation |
| Sector: Industrials | |
| SubSector: Diversified Machinery | |
| MarketCap: 2197.36 Millions | |
| Recent Price: 91.11 Smart Investing & Trading Score: 10 | |
| Day Percent Change: 1.56% Day Change: 1.40 | |
| Week Change: -1.65% Year-to-date Change: -8.4% | |
| JBT Links: Profile News Message Board | |
| Charts:- Daily , Weekly | |
| Add JBT to Watchlist: View: Get Complete JBT Trend Analysis ➞ | |
 | TDS Telephone and Data Systems, Inc. |
| Sector: Technology | |
| SubSector: Wireless Communications | |
| MarketCap: 1851.87 Millions | |
| Recent Price: 15.39 Smart Investing & Trading Score: 20 | |
| Day Percent Change: 1.58% Day Change: 0.24 | |
| Week Change: -1.66% Year-to-date Change: -16.1% | |
| TDS Links: Profile News Message Board | |
| Charts:- Daily , Weekly | |
| Add TDS to Watchlist: View: Get Complete TDS Trend Analysis ➞ | |
 | CWCO Consolidated Water Co. Ltd. |
| Sector: Utilities | |
| SubSector: Water Utilities | |
| MarketCap: 223.302 Millions | |
| Recent Price: 24.24 Smart Investing & Trading Score: 20 | |
| Day Percent Change: 0.54% Day Change: 0.13 | |
| Week Change: -1.66% Year-to-date Change: -31.9% | |
| CWCO Links: Profile News Message Board | |
| Charts:- Daily , Weekly | |
| Add CWCO to Watchlist: View: Get Complete CWCO Trend Analysis ➞ | |
 | BANC Banc of California, Inc. |
| Sector: Financials | |
| SubSector: Regional - Pacific Banks | |
| MarketCap: 459.929 Millions | |
| Recent Price: 13.93 Smart Investing & Trading Score: 33 | |
| Day Percent Change: 0.91% Day Change: 0.13 | |
| Week Change: -1.66% Year-to-date Change: 3.7% | |
| BANC Links: Profile News Message Board | |
| Charts:- Daily , Weekly | |
| Add BANC to Watchlist: View: Get Complete BANC Trend Analysis ➞ | |
 | HZO MarineMax, Inc. |
| Sector: Services & Goods | |
| SubSector: Specialty Retail, Other | |
| MarketCap: 234.744 Millions | |
| Recent Price: 26.99 Smart Investing & Trading Score: 10 | |
| Day Percent Change: 1.16% Day Change: 0.31 | |
| Week Change: -1.68% Year-to-date Change: -30.6% | |
| HZO Links: Profile News Message Board | |
| Charts:- Daily , Weekly | |
| Add HZO to Watchlist: View: Get Complete HZO Trend Analysis ➞ | |
 | DAKT Daktronics, Inc. |
| Sector: Technology | |
| SubSector: Computer Based Systems | |
| MarketCap: 223.539 Millions | |
| Recent Price: 9.32 Smart Investing & Trading Score: 58 | |
| Day Percent Change: 1.08% Day Change: 0.10 | |
| Week Change: -1.69% Year-to-date Change: 9.9% | |
| DAKT Links: Profile News Message Board | |
| Charts:- Daily , Weekly | |
| Add DAKT to Watchlist: View: Get Complete DAKT Trend Analysis ➞ | |
 | TCMD Tactile Systems Technology, Inc. |
| Sector: Health Care | |
| SubSector: Medical Instruments & Supplies | |
| MarketCap: 655.96 Millions | |
| Recent Price: 14.53 Smart Investing & Trading Score: 18 | |
| Day Percent Change: 2.76% Day Change: 0.39 | |
| Week Change: -1.69% Year-to-date Change: 1.6% | |
| TCMD Links: Profile News Message Board | |
| Charts:- Daily , Weekly | |
| Add TCMD to Watchlist: View: Get Complete TCMD Trend Analysis ➞ | |
 | CALX Calix, Inc. |
| Sector: Technology | |
| SubSector: Communication Equipment | |
| MarketCap: 390.039 Millions | |
| Recent Price: 29.77 Smart Investing & Trading Score: 28 | |
| Day Percent Change: 1.14% Day Change: 0.33 | |
| Week Change: -1.7% Year-to-date Change: -31.9% | |
| CALX Links: Profile News Message Board | |
| Charts:- Daily , Weekly | |
| Add CALX to Watchlist: View: Get Complete CALX Trend Analysis ➞ | |
 | BOWL Bowlero Corp. |
| Sector: Services & Goods | |
| SubSector: Leisure | |
| MarketCap: 2000 Millions | |
| Recent Price: 12.13 Smart Investing & Trading Score: 58 | |
| Day Percent Change: 0.00% Day Change: 0.00 | |
| Week Change: -1.7% Year-to-date Change: -14.1% | |
| BOWL Links: Profile News Message Board | |
| Charts:- Daily , Weekly | |
| Add BOWL to Watchlist: View: Get Complete BOWL Trend Analysis ➞ | |
 | IDT IDT Corporation |
| Sector: Technology | |
| SubSector: Diversified Communication Services | |
| MarketCap: 130.064 Millions | |
| Recent Price: 36.31 Smart Investing & Trading Score: 36 | |
| Day Percent Change: 1.06% Day Change: 0.38 | |
| Week Change: -1.71% Year-to-date Change: 6.5% | |
| IDT Links: Profile News Message Board | |
| Charts:- Daily , Weekly | |
| Add IDT to Watchlist: View: Get Complete IDT Trend Analysis ➞ | |
 | PLUS ePlus inc. |
| Sector: Technology | |
| SubSector: Application Software | |
| MarketCap: 728.262 Millions | |
| Recent Price: 75.75 Smart Investing & Trading Score: 13 | |
| Day Percent Change: 0.62% Day Change: 0.47 | |
| Week Change: -1.71% Year-to-date Change: -5.1% | |
| PLUS Links: Profile News Message Board | |
| Charts:- Daily , Weekly | |
| Add PLUS to Watchlist: View: Get Complete PLUS Trend Analysis ➞ | |
 | ENSG The Ensign Group, Inc. |
| Sector: Health Care | |
| SubSector: Long-Term Care Facilities | |
| MarketCap: 2053.76 Millions | |
| Recent Price: 117.25 Smart Investing & Trading Score: 26 | |
| Day Percent Change: 0.66% Day Change: 0.77 | |
| Week Change: -1.71% Year-to-date Change: 4.5% | |
| ENSG Links: Profile News Message Board | |
| Charts:- Daily , Weekly | |
| Add ENSG to Watchlist: View: Get Complete ENSG Trend Analysis ➞ | |
 | COLL Collegium Pharmaceutical, Inc. |
| Sector: Health Care | |
| SubSector: Drugs - Generic | |
| MarketCap: 569.185 Millions | |
| Recent Price: 35.10 Smart Investing & Trading Score: 36 | |
| Day Percent Change: 0.95% Day Change: 0.33 | |
| Week Change: -1.71% Year-to-date Change: 14.0% | |
| COLL Links: Profile News Message Board | |
| Charts:- Daily , Weekly | |
| Add COLL to Watchlist: View: Get Complete COLL Trend Analysis ➞ | |
| Too many stocks? View smallcap stocks filtered by marketcap & sector |
| Marketcap: All SmallCap Stocks (default-no microcap), Large, Mid-Range, Small & MicroCap |
| Sector: Tech, Finance, Energy, Staples, Retail, Industrial, Materials, Utilities & Medical |
|
Best Stocks Today 12Stocks.com |
© 2024 12Stocks.com Terms & Conditions Privacy Contact Us
All Information Provided Only For Education And Not To Be Used For Investing or Trading. See Terms & Conditions


One More Thing ... Get Best Stocks Delivered Daily!
Never Ever Miss A Move With Our Top Ten Stocks Lists
Find Best Stocks In Any Market - Bull or Bear Market
Take A Peek At Our Top Ten Stocks Lists: Daily, Weekly, Year-to-Date & Top Trends
Find Best Stocks In Any Market - Bull or Bear Market
Take A Peek At Our Top Ten Stocks Lists: Daily, Weekly, Year-to-Date & Top Trends
Smallcap Stocks With Best Up Trends [0-bearish to 100-bullish]: Oscar Health[100], Victory Capital[100], ALX Oncology[100], NextNav [100], Envestnet [100], IMAX [100], EchoStar [100], Macatawa Bank[100], Badger Meter[100], Cullinan Oncology[100], Argan [95]
Best Smallcap Stocks Year-to-Date:
Agenus [580.03%], CareMax [394.85%], Janux [354.07%], Alpine Immune[238.42%], Longboard [195.25%], Super Micro[192.37%], Arcutis Bio[187%], Avidity Biosciences[159.07%], Vera [156.56%], Stoke [130.42%], Y-mAbs [124.78%] Best Smallcap Stocks This Week:
Macatawa Bank[44.42%], Humacyte [38.02%], ProKidney [34%], Snap One[29.98%], Vanda [24.15%], ALX Oncology[23.1%], 23andMe Holding[22.5%], ContextLogic [17.8%], Badger Meter[15.87%], Day One[15.69%], Oscar Health[15.13%] Best Smallcap Stocks Daily:
Humacyte [22.50%], Metropolitan Bank[16.45%], Agenus [13.28%], Origin Materials[10.81%], Tellurian [10.06%], Cohen & Steers[8.04%], Bar Harbor[7.21%], Genelux [6.78%], Day One[6.34%], AlTi Global[5.91%], Amplify Energy[5.69%]