
 Login Sign Up


| |||||
 |  | ||||

| 12Stocks.com Market Intelligence |
Best SmallCap Stocks
|
| In a hurry? Small Cap Stock Lists: Performance Trends Table, Stock Charts
Sort Small Cap stocks: Daily, Weekly, Year-to-Date, Market Cap & Trends. Filter Small Cap stocks list by sector: Show all, Tech, Finance, Energy, Staples, Retail, Industrial, Materials, Utilities and HealthCare Filter Small Cap stocks list by size: All Large Medium Small and MicroCap |
| 12Stocks.com Small Cap Stocks Performances & Trends Daily | |||||||||
|
|  The overall Smart Investing & Trading Score is 44 (0-bearish to 100-bullish) which puts Small Cap index in short term neutral trend. The Smart Investing & Trading Score from previous trading session is 58 and hence a deterioration of trend.
| ||||||||
Here are the Smart Investing & Trading Scores of the most requested small cap stocks at 12Stocks.com (click stock name for detailed review):
|


| 12Stocks.com: Investing in Smallcap Index with Stocks | |
|
The following table helps investors and traders sort through current performance and trends (as measured by Smart Investing & Trading Score) of various
stocks in the Smallcap Index. Quick View: Move mouse or cursor over stock symbol (ticker) to view short-term technical chart and over stock name to view long term chart. Click on  to add stock symbol to your watchlist and to add stock symbol to your watchlist and  to view watchlist. Click on any ticker or stock name for detailed market intelligence report for that stock. to view watchlist. Click on any ticker or stock name for detailed market intelligence report for that stock. |
12Stocks.com Performance of Stocks in Smallcap Index
| Ticker | Stock Name | Watchlist | Category | Recent Price | Smart Investing & Trading Score | Change % | Weekly Change% |
| PRLD | Prelude |   | Health Care | 4.05 | 63 | 3.58% | 13.45% |
| SHCR | Sharecare | | Health Care | 0.74 | 50 | -0.80% | 13.45% |
| IVAC | Intevac | | Technology | 4.09 | 24 | 10.54% | 13.30% |
| GPI | Group 1 | | Services & Goods | 300.46 | 100 | 0.25% | 13.15% |
| ACMR | ACM Research | | Technology | 28.27 | 63 | 0.44% | 13.01% |
| SITM | SiTime | | Technology | 82.96 | 52 | 8.84% | 12.99% |
| HOV | Hovnanian Enterprises | | Industrials | 146.47 | 42 | -1.51% | 12.44% |
| JOBY | Joby Aviation | | Industrials | 5.10 | 49 | 6.14% | 12.33% |
| ELF | e.l.f. Beauty | | Consumer Staples | 176.03 | 83 | -0.54% | 12.31% |
| POWL | Powell Industries | | Industrials | 146.31 | 88 | -1.96% | 12.25% |
| ZUMZ | Zumiez | | Services & Goods | 16.98 | 74 | -1.28% | 11.93% |
| BHIL | Benson Hill | | Materials | 0.18 | 37 | 1.16% | 11.79% |
| SMTC | Semtech | | Technology | 34.70 | 95 | 2.36% | 11.76% |
| OSCR | Oscar Health | | Health Care | 17.89 | 90 | 2.58% | 11.74% |
| MLI | Mueller Industries | | Industrials | 58.41 | 100 | 0.78% | 11.73% |
| SANA | Sana | | Health Care | 8.50 | 63 | 4.68% | 11.70% |
| AMRC | Ameresco | | Services & Goods | 20.98 | 78 | -1.46% | 11.60% |
| AKTS | Akoustis | | Technology | 0.56 | 48 | 0.02% | 11.57% |
| TRMK | Trustmark | | Financials | 29.82 | 100 | 1.57% | 11.56% |
| CMAX | CareMax | | Health Care | 2.87 | 56 | -12.39% | 11.48% |
| LBPH | Longboard | | Health Care | 19.43 | 62 | -1.67% | 11.41% |
| PKST | Peakstone Realty | | Financials | 14.35 | 59 | 2.50% | 11.41% |
| SABR | Sabre | | Technology | 2.76 | 74 | 0.00% | 11.29% |
| TWST | Twist Bioscience | | Health Care | 31.05 | 27 | 0.98% | 11.21% |
| FIP | FTAI Infrastructure | | Industrials | 7.41 | 93 | -0.40% | 11.09% |


| Too many stocks? View smallcap stocks filtered by marketcap & sector |
| Marketcap: All SmallCap Stocks (default-no microcap), Large, Mid-Range, Small |
| Smallcap Sector: Tech, Finance, Energy, Staples, Retail, Industrial, Materials, & Medical |
|
Get the most comprehensive stock market coverage daily at 12Stocks.com ➞ Best Stocks Today ➞ Best Stocks Weekly ➞ Best Stocks Year-to-Date ➞ Best Stocks Trends ➞  Best Stocks Today 12Stocks.com Best Nasdaq Stocks ➞ Best S&P 500 Stocks ➞ Best Tech Stocks ➞ Best Biotech Stocks ➞ |
| Detailed Overview of SmallCap Stocks |
| SmallCap Technical Overview, Leaders & Laggards, Top SmallCap ETF Funds & Detailed SmallCap Stocks List, Charts, Trends & More |
| Smallcap: Technical Analysis, Trends & YTD Performance | |
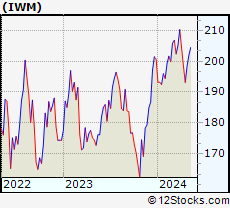
| SmallCap segment as represented by
IWM, an exchange-traded fund [ETF], holds basket of thousands of smallcap stocks from across all major sectors of the US stock market. The smallcap index (contains stocks like Riverbed & Sotheby's) is down by -2.11% and is currently underperforming the overall market by -7.27% year-to-date. Below is a quick view of technical charts and trends: | |
 IWM Weekly Chart |
|
| Long Term Trend: Good | |
| Medium Term Trend: Not Good | |
 IWM Daily Chart |
|
| Short Term Trend: Very Good | |
| Overall Trend Score: 44 | |
| YTD Performance: -2.11% | |
| **Trend Scores & Views Are Only For Educational Purposes And Not For Investing | |
| 12Stocks.com: Top Performing Small Cap Index Stocks | ||||||||||||||||||||||||||||||||||||||||||||||||
 The top performing Small Cap Index stocks year to date are
Now, more recently, over last week, the top performing Small Cap Index stocks on the move are


|
||||||||||||||||||||||||||||||||||||||||||||||||
| 12Stocks.com: Investing in Smallcap Index using Exchange Traded Funds | |
|
The following table shows list of key exchange traded funds (ETF) that
help investors track Smallcap index. The following list also includes leveraged ETF funds that track twice or thrice the daily returns of Smallcap indices. Short or inverse ETF funds move in the opposite direction to the index they track and are useful during market pullbacks or during bear markets. Quick View: Move mouse or cursor over ETF symbol (ticker) to view short-term technical chart and over ETF name to view long term chart. Click on ticker or stock name for detailed view. Click on to add stock symbol to your watchlist and to view watchlist. |
12Stocks.com List of ETFs that track Smallcap Index
| Ticker | ETF Name | Watchlist | Recent Price | Smart Investing & Trading Score | Change % | Week % | Year-to-date % |
| IWM | iShares Russell 2000 | | 196.48 | 44 | -0.61 | 1.73 | -2.11% |
| IJR | iShares Core S&P Small-Cap | | 104.86 | 78 | -0.80 | 1.59 | -3.13% |
| VTWO | Vanguard Russell 2000 ETF | | 79.45 | 63 | -0.60 | 1.75 | -2.03% |
| IWN | iShares Russell 2000 Value | | 150.18 | 68 | -0.73 | 1.62 | -3.32% |
| IWO | iShares Russell 2000 Growth | | 249.86 | 51 | -0.56 | 1.86 | -0.94% |
| IJS | iShares S&P Small-Cap 600 Value | | 96.69 | 60 | -1.04 | 1.13 | -6.19% |
| IJT | iShares S&P Small-Cap 600 Growth | | 125.06 | 63 | -0.25 | 2.33 | -0.06% |
| XSLV | PowerShares S&P SmallCap Low Volatil ETF | | 42.54 | 73 | -0.93 | 0.85 | -3.65% |
| SDD | ProShares UltraShort SmallCap600 | | 19.58 | 42 | 0.46 | -3.74 | 6.26% |
| SBB | ProShares Short SmallCap600 | | 16.50 | 40 | 0.79 | -2.02 | 3.58% |
| SMLV | SPDR SSGA US Small Cap Low Volatil ETF | | 107.33 | 73 | -1.01 | 1.17 | -4.61% |
| SAA | ProShares Ultra SmallCap600 | | 22.66 | 58 | -1.52 | 3.94 | -9.18% |
| 12Stocks.com: Charts, Trends, Fundamental Data and Performances of SmallCap Stocks | |
|
We now take in-depth look at all SmallCap stocks including charts, multi-period performances and overall trends (as measured by Smart Investing & Trading Score). One can sort SmallCap stocks (click link to choose) by Daily, Weekly and by Year-to-Date performances. Also, one can sort by size of the company or by market capitalization. |
| Select Your Default Chart Type: | |||||
| |||||
| Click on stock symbol or name for detailed view. Click on to add stock symbol to your watchlist and to view watchlist. Quick View: Move mouse or cursor over "Daily" to quickly view daily technical stock chart and over "Weekly" to view weekly technical stock chart. | |||||

 | PRLD Prelude Therapeutics Incorporated |
| Sector: Health Care | |
| SubSector: Biotechnology | |
| MarketCap: 26087 Millions | |
| Recent Price: 4.05 Smart Investing & Trading Score: 63 | |
| Day Percent Change: 3.58% Day Change: 0.14 | |
| Week Change: 13.45% Year-to-date Change: -6.9% | |
| PRLD Links: Profile News Message Board | |
| Charts:- Daily , Weekly | |
| Add PRLD to Watchlist: View: Get Complete PRLD Trend Analysis ➞ | |
 | SHCR Sharecare, Inc. |
| Sector: Health Care | |
| SubSector: Health Information Services | |
| MarketCap: 640 Millions | |
| Recent Price: 0.74 Smart Investing & Trading Score: 50 | |
| Day Percent Change: -0.80% Day Change: -0.01 | |
| Week Change: 13.45% Year-to-date Change: -31.5% | |
| SHCR Links: Profile News Message Board | |
| Charts:- Daily , Weekly | |
| Add SHCR to Watchlist: View: Get Complete SHCR Trend Analysis ➞ | |
 | IVAC Intevac, Inc. |
| Sector: Technology | |
| SubSector: Diversified Electronics | |
| MarketCap: 89.2396 Millions | |
| Recent Price: 4.09 Smart Investing & Trading Score: 24 | |
| Day Percent Change: 10.54% Day Change: 0.39 | |
| Week Change: 13.3% Year-to-date Change: -5.3% | |
| IVAC Links: Profile News Message Board | |
| Charts:- Daily , Weekly | |
| Add IVAC to Watchlist: View: Get Complete IVAC Trend Analysis ➞ | |
 | GPI Group 1 Automotive, Inc. |
| Sector: Services & Goods | |
| SubSector: Auto Dealerships | |
| MarketCap: 921.021 Millions | |
| Recent Price: 300.46 Smart Investing & Trading Score: 100 | |
| Day Percent Change: 0.25% Day Change: 0.75 | |
| Week Change: 13.15% Year-to-date Change: -1.4% | |
| GPI Links: Profile News Message Board | |
| Charts:- Daily , Weekly | |
| Add GPI to Watchlist: View: Get Complete GPI Trend Analysis ➞ | |
 | ACMR ACM Research, Inc. |
| Sector: Technology | |
| SubSector: Semiconductor Equipment & Materials | |
| MarketCap: 438.718 Millions | |
| Recent Price: 28.27 Smart Investing & Trading Score: 63 | |
| Day Percent Change: 0.44% Day Change: 0.13 | |
| Week Change: 13.01% Year-to-date Change: 44.7% | |
| ACMR Links: Profile News Message Board | |
| Charts:- Daily , Weekly | |
| Add ACMR to Watchlist: View: Get Complete ACMR Trend Analysis ➞ | |
 | SITM SiTime Corporation |
| Sector: Technology | |
| SubSector: Semiconductor - Specialized | |
| MarketCap: 403.76 Millions | |
| Recent Price: 82.96 Smart Investing & Trading Score: 52 | |
| Day Percent Change: 8.84% Day Change: 6.74 | |
| Week Change: 12.99% Year-to-date Change: -32.0% | |
| SITM Links: Profile News Message Board | |
| Charts:- Daily , Weekly | |
| Add SITM to Watchlist: View: Get Complete SITM Trend Analysis ➞ | |
 | HOV Hovnanian Enterprises, Inc. |
| Sector: Industrials | |
| SubSector: Residential Construction | |
| MarketCap: 59.9106 Millions | |
| Recent Price: 146.47 Smart Investing & Trading Score: 42 | |
| Day Percent Change: -1.51% Day Change: -2.24 | |
| Week Change: 12.44% Year-to-date Change: -5.9% | |
| HOV Links: Profile News Message Board | |
| Charts:- Daily , Weekly | |
| Add HOV to Watchlist: View: Get Complete HOV Trend Analysis ➞ | |
 | JOBY Joby Aviation, Inc. |
| Sector: Industrials | |
| SubSector: Airports & Air Services | |
| MarketCap: 5810 Millions | |
| Recent Price: 5.10 Smart Investing & Trading Score: 49 | |
| Day Percent Change: 6.14% Day Change: 0.29 | |
| Week Change: 12.33% Year-to-date Change: -23.2% | |
| JOBY Links: Profile News Message Board | |
| Charts:- Daily , Weekly | |
| Add JOBY to Watchlist: View: Get Complete JOBY Trend Analysis ➞ | |
 | ELF e.l.f. Beauty, Inc. |
| Sector: Consumer Staples | |
| SubSector: Personal Products | |
| MarketCap: 497.985 Millions | |
| Recent Price: 176.03 Smart Investing & Trading Score: 83 | |
| Day Percent Change: -0.54% Day Change: -0.95 | |
| Week Change: 12.31% Year-to-date Change: 22.0% | |
| ELF Links: Profile News Message Board | |
| Charts:- Daily , Weekly | |
| Add ELF to Watchlist: View: Get Complete ELF Trend Analysis ➞ | |
 | POWL Powell Industries, Inc. |
| Sector: Industrials | |
| SubSector: Diversified Machinery | |
| MarketCap: 257.216 Millions | |
| Recent Price: 146.31 Smart Investing & Trading Score: 88 | |
| Day Percent Change: -1.96% Day Change: -2.92 | |
| Week Change: 12.25% Year-to-date Change: 65.5% | |
| POWL Links: Profile News Message Board | |
| Charts:- Daily , Weekly | |
| Add POWL to Watchlist: View: Get Complete POWL Trend Analysis ➞ | |
 | ZUMZ Zumiez Inc. |
| Sector: Services & Goods | |
| SubSector: Specialty Retail, Other | |
| MarketCap: 526.244 Millions | |
| Recent Price: 16.98 Smart Investing & Trading Score: 74 | |
| Day Percent Change: -1.28% Day Change: -0.22 | |
| Week Change: 11.93% Year-to-date Change: -16.5% | |
| ZUMZ Links: Profile News Message Board | |
| Charts:- Daily , Weekly | |
| Add ZUMZ to Watchlist: View: Get Complete ZUMZ Trend Analysis ➞ | |
 | BHIL Benson Hill, Inc. |
| Sector: Materials | |
| SubSector: Agricultural Inputs | |
| MarketCap: 236 Millions | |
| Recent Price: 0.18 Smart Investing & Trading Score: 37 | |
| Day Percent Change: 1.16% Day Change: 0.00 | |
| Week Change: 11.79% Year-to-date Change: 4.7% | |
| BHIL Links: Profile News Message Board | |
| Charts:- Daily , Weekly | |
| Add BHIL to Watchlist: View: Get Complete BHIL Trend Analysis ➞ | |
 | SMTC Semtech Corporation |
| Sector: Technology | |
| SubSector: Semiconductor - Integrated Circuits | |
| MarketCap: 2285 Millions | |
| Recent Price: 34.70 Smart Investing & Trading Score: 95 | |
| Day Percent Change: 2.36% Day Change: 0.80 | |
| Week Change: 11.76% Year-to-date Change: 58.4% | |
| SMTC Links: Profile News Message Board | |
| Charts:- Daily , Weekly | |
| Add SMTC to Watchlist: View: Get Complete SMTC Trend Analysis ➞ | |
 | OSCR Oscar Health, Inc. |
| Sector: Health Care | |
| SubSector: Healthcare Plans | |
| MarketCap: 1790 Millions | |
| Recent Price: 17.89 Smart Investing & Trading Score: 90 | |
| Day Percent Change: 2.58% Day Change: 0.45 | |
| Week Change: 11.74% Year-to-date Change: 96.5% | |
| OSCR Links: Profile News Message Board | |
| Charts:- Daily , Weekly | |
| Add OSCR to Watchlist: View: Get Complete OSCR Trend Analysis ➞ | |
 | MLI Mueller Industries, Inc. |
| Sector: Industrials | |
| SubSector: Metal Fabrication | |
| MarketCap: 1259.5 Millions | |
| Recent Price: 58.41 Smart Investing & Trading Score: 100 | |
| Day Percent Change: 0.78% Day Change: 0.45 | |
| Week Change: 11.73% Year-to-date Change: 23.9% | |
| MLI Links: Profile News Message Board | |
| Charts:- Daily , Weekly | |
| Add MLI to Watchlist: View: Get Complete MLI Trend Analysis ➞ | |
 | SANA Sana Biotechnology, Inc. |
| Sector: Health Care | |
| SubSector: Biotechnology | |
| MarketCap: 1210 Millions | |
| Recent Price: 8.50 Smart Investing & Trading Score: 63 | |
| Day Percent Change: 4.68% Day Change: 0.38 | |
| Week Change: 11.7% Year-to-date Change: 105.6% | |
| SANA Links: Profile News Message Board | |
| Charts:- Daily , Weekly | |
| Add SANA to Watchlist: View: Get Complete SANA Trend Analysis ➞ | |
 | AMRC Ameresco, Inc. |
| Sector: Services & Goods | |
| SubSector: Technical Services | |
| MarketCap: 898.91 Millions | |
| Recent Price: 20.98 Smart Investing & Trading Score: 78 | |
| Day Percent Change: -1.46% Day Change: -0.31 | |
| Week Change: 11.6% Year-to-date Change: -33.8% | |
| AMRC Links: Profile News Message Board | |
| Charts:- Daily , Weekly | |
| Add AMRC to Watchlist: View: Get Complete AMRC Trend Analysis ➞ | |
 | AKTS Akoustis Technologies, Inc. |
| Sector: Technology | |
| SubSector: Communication Equipment | |
| MarketCap: 197.039 Millions | |
| Recent Price: 0.56 Smart Investing & Trading Score: 48 | |
| Day Percent Change: 0.02% Day Change: 0.00 | |
| Week Change: 11.57% Year-to-date Change: -33.4% | |
| AKTS Links: Profile News Message Board | |
| Charts:- Daily , Weekly | |
| Add AKTS to Watchlist: View: Get Complete AKTS Trend Analysis ➞ | |
 | TRMK Trustmark Corporation |
| Sector: Financials | |
| SubSector: Regional - Southeast Banks | |
| MarketCap: 1630.15 Millions | |
| Recent Price: 29.82 Smart Investing & Trading Score: 100 | |
| Day Percent Change: 1.57% Day Change: 0.46 | |
| Week Change: 11.56% Year-to-date Change: 7.0% | |
| TRMK Links: Profile News Message Board | |
| Charts:- Daily , Weekly | |
| Add TRMK to Watchlist: View: Get Complete TRMK Trend Analysis ➞ | |
 | CMAX CareMax, Inc. |
| Sector: Health Care | |
| SubSector: Health Information Services | |
| MarketCap: 371 Millions | |
| Recent Price: 2.87 Smart Investing & Trading Score: 56 | |
| Day Percent Change: -12.39% Day Change: -0.40 | |
| Week Change: 11.48% Year-to-date Change: 490.7% | |
| CMAX Links: Profile News Message Board | |
| Charts:- Daily , Weekly | |
| Add CMAX to Watchlist: View: Get Complete CMAX Trend Analysis ➞ | |
 | LBPH Longboard Pharmaceuticals, Inc. |
| Sector: Health Care | |
| SubSector: Biotechnology | |
| MarketCap: 169 Millions | |
| Recent Price: 19.43 Smart Investing & Trading Score: 62 | |
| Day Percent Change: -1.67% Day Change: -0.33 | |
| Week Change: 11.41% Year-to-date Change: 218.0% | |
| LBPH Links: Profile News Message Board | |
| Charts:- Daily , Weekly | |
| Add LBPH to Watchlist: View: Get Complete LBPH Trend Analysis ➞ | |
 | PKST Peakstone Realty Trust |
| Sector: Financials | |
| SubSector: REIT - Diversified | |
| MarketCap: 1050 Millions | |
| Recent Price: 14.35 Smart Investing & Trading Score: 59 | |
| Day Percent Change: 2.50% Day Change: 0.35 | |
| Week Change: 11.41% Year-to-date Change: -30.1% | |
| PKST Links: Profile News Message Board | |
| Charts:- Daily , Weekly | |
| Add PKST to Watchlist: View: Get Complete PKST Trend Analysis ➞ | |
 | SABR Sabre Corporation |
| Sector: Technology | |
| SubSector: Information Technology Services | |
| MarketCap: 152.468 Millions | |
| Recent Price: 2.76 Smart Investing & Trading Score: 74 | |
| Day Percent Change: 0.00% Day Change: 0.00 | |
| Week Change: 11.29% Year-to-date Change: -37.3% | |
| SABR Links: Profile News Message Board | |
| Charts:- Daily , Weekly | |
| Add SABR to Watchlist: View: Get Complete SABR Trend Analysis ➞ | |
 | TWST Twist Bioscience Corporation |
| Sector: Health Care | |
| SubSector: Medical Laboratories & Research | |
| MarketCap: 1065 Millions | |
| Recent Price: 31.05 Smart Investing & Trading Score: 27 | |
| Day Percent Change: 0.98% Day Change: 0.30 | |
| Week Change: 11.21% Year-to-date Change: -15.8% | |
| TWST Links: Profile News Message Board | |
| Charts:- Daily , Weekly | |
| Add TWST to Watchlist: View: Get Complete TWST Trend Analysis ➞ | |
 | FIP FTAI Infrastructure Inc. |
| Sector: Industrials | |
| SubSector: Industrials | |
| MarketCap: 368 Millions | |
| Recent Price: 7.41 Smart Investing & Trading Score: 93 | |
| Day Percent Change: -0.40% Day Change: -0.03 | |
| Week Change: 11.09% Year-to-date Change: 90.5% | |
| FIP Links: Profile News Message Board | |
| Charts:- Daily , Weekly | |
| Add FIP to Watchlist: View: Get Complete FIP Trend Analysis ➞ | |
| Too many stocks? View smallcap stocks filtered by marketcap & sector |
| Marketcap: All SmallCap Stocks (default-no microcap), Large, Mid-Range, Small & MicroCap |
| Sector: Tech, Finance, Energy, Staples, Retail, Industrial, Materials, Utilities & Medical |
|
Best Stocks Today 12Stocks.com |
© 2024 12Stocks.com Terms & Conditions Privacy Contact Us
All Information Provided Only For Education And Not To Be Used For Investing or Trading. See Terms & Conditions


One More Thing ... Get Best Stocks Delivered Daily!
Never Ever Miss A Move With Our Top Ten Stocks Lists
Find Best Stocks In Any Market - Bull or Bear Market
Take A Peek At Our Top Ten Stocks Lists: Daily, Weekly, Year-to-Date & Top Trends
Find Best Stocks In Any Market - Bull or Bear Market
Take A Peek At Our Top Ten Stocks Lists: Daily, Weekly, Year-to-Date & Top Trends
Smallcap Stocks With Best Up Trends [0-bearish to 100-bullish]: B. Riley[100], Central Pacific[100], California Water[100], Cricut [100], Carpenter [100], Haemonetics [100], Sanmina [100], Trustmark [100], Comstock Resources[100], EchoStar [100], Mueller Industries[100]
Best Smallcap Stocks Year-to-Date:
CareMax [490.72%], Janux [338.34%], Viking [270.02%], Alpine Immune[239.52%], Longboard [218%], Super Micro[177%], Arcutis Bio[166.56%], Avidity Biosciences[159.79%], Vera [149.94%], Hippo [128.87%], Stoke [122.15%] Best Smallcap Stocks This Week:
Matterport [168.97%], B. Riley[73.54%], Impinj [33.73%], ProKidney [32.84%], Seres [32.65%], Riot Blockchain[32.64%], Ribbon [25.58%], Cullinan Oncology[22.92%], P.A.M. Transportation[22.85%], NuScale Power[21.44%], Hibbett Sports[21.03%] Best Smallcap Stocks Daily:
Impinj [28.65%], P.A.M. Transportation[17.95%], B. Riley[16.61%], Strategic Education[16.28%], OptiNose [14.56%], JELD-WEN Holding[11.54%], Sonic Automotive[10.86%], Intevac [10.54%], SiTime [8.84%], Noodles & [8.08%], ProKidney [7.75%]