
 Login Sign Up


| |||||
 |  | ||||

| 12Stocks.com Market Intelligence |
Best SmallCap Stocks
|
| In a hurry? Small Cap Stock Lists: Performance Trends Table, Stock Charts
Sort Small Cap stocks: Daily, Weekly, Year-to-Date, Market Cap & Trends. Filter Small Cap stocks list by sector: Show all, Tech, Finance, Energy, Staples, Retail, Industrial, Materials, Utilities and HealthCare Filter Small Cap stocks list by size: All Large Medium Small and MicroCap |
| 12Stocks.com Small Cap Stocks Performances & Trends Daily | |||||||||
|
|  The overall Smart Investing & Trading Score is 58 (0-bearish to 100-bullish) which puts Small Cap index in short term neutral trend. The Smart Investing & Trading Score from previous trading session is 63 and hence a deterioration of trend.
| ||||||||
Here are the Smart Investing & Trading Scores of the most requested small cap stocks at 12Stocks.com (click stock name for detailed review):
|


| 12Stocks.com: Investing in Smallcap Index with Stocks | |
|
The following table helps investors and traders sort through current performance and trends (as measured by Smart Investing & Trading Score) of various
stocks in the Smallcap Index. Quick View: Move mouse or cursor over stock symbol (ticker) to view short-term technical chart and over stock name to view long term chart. Click on  to add stock symbol to your watchlist and to add stock symbol to your watchlist and  to view watchlist. Click on any ticker or stock name for detailed market intelligence report for that stock. to view watchlist. Click on any ticker or stock name for detailed market intelligence report for that stock. |
12Stocks.com Performance of Stocks in Smallcap Index
| Ticker | Stock Name | Watchlist | Category | Recent Price | Smart Investing & Trading Score | Change % | Weekly Change% |
| HLVX | HilleVax |   | Health Care | 12.73 | 25 | -0.59% | 3.46% |
| IOVA | Iovance Bio | | Health Care | 11.71 | 48 | -1.26% | 3.45% |
| HWKN | Hawkins | | Materials | 77.20 | 63 | 0.32% | 3.44% |
| CNXN | PC Connection | | Technology | 64.98 | 62 | -0.09% | 3.44% |
| WHD | Cactus | | Energy | 52.32 | 73 | -0.49% | 3.44% |
| SHOO | Steven Madden | | Consumer Staples | 40.46 | 49 | 0.05% | 3.43% |
| GEO | GEO Group | | Financials | 15.07 | 76 | 0.53% | 3.43% |
| BY | Byline Bancorp | | Financials | 21.43 | 74 | 0.61% | 3.43% |
| FWRG | First Watch | | Services & Goods | 23.07 | 73 | 1.47% | 3.43% |
| BZH | Beazer Homes | | Industrials | 27.21 | 32 | -2.40% | 3.42% |
| NOVA | Sunnova Energy | | Services & Goods | 3.93 | 15 | 0.26% | 3.42% |
| CPF | Central Pacific | | Financials | 19.95 | 100 | -0.05% | 3.42% |
| EWTX | Edgewise | | Health Care | 15.75 | 22 | 0.70% | 3.41% |
| PRIM | Primoris Services | | Industrials | 45.01 | 68 | -0.88% | 3.40% |
| SPSC | SPS Commerce | | Technology | 171.12 | 49 | 0.30% | 3.40% |
| IBOC | Bancshares | | Financials | 56.26 | 100 | 0.16% | 3.38% |
| RMBS | Rambus | | Technology | 56.52 | 42 | 0.14% | 3.37% |
| OPTN | OptiNose | | Health Care | 0.93 | 25 | -4.38% | 3.37% |
| NTGR | NETGEAR | | Technology | 14.74 | 68 | 1.10% | 3.37% |
| MOFG | MidWestOne Financial | | Financials | 21.45 | 35 | 0.47% | 3.37% |
| ALKS | Alkermes | | Health Care | 24.65 | 49 | 1.61% | 3.35% |
| EPRT | Essential Properties | | Financials | 26.33 | 75 | 0.19% | 3.34% |
| ESE | ESCO | | Technology | 104.28 | 83 | -0.32% | 3.33% |
| MCS | Marcus | | Services & Goods | 13.65 | 62 | 0.74% | 3.33% |
| GTLS | Chart Industries | | Industrials | 152.95 | 68 | -0.37% | 3.32% |


| Too many stocks? View smallcap stocks filtered by marketcap & sector |
| Marketcap: All SmallCap Stocks (default-no microcap), Large, Mid-Range, Small |
| Smallcap Sector: Tech, Finance, Energy, Staples, Retail, Industrial, Materials, & Medical |
|
Get the most comprehensive stock market coverage daily at 12Stocks.com ➞ Best Stocks Today ➞ Best Stocks Weekly ➞ Best Stocks Year-to-Date ➞ Best Stocks Trends ➞  Best Stocks Today 12Stocks.com Best Nasdaq Stocks ➞ Best S&P 500 Stocks ➞ Best Tech Stocks ➞ Best Biotech Stocks ➞ |
| Detailed Overview of SmallCap Stocks |
| SmallCap Technical Overview, Leaders & Laggards, Top SmallCap ETF Funds & Detailed SmallCap Stocks List, Charts, Trends & More |
| Smallcap: Technical Analysis, Trends & YTD Performance | |
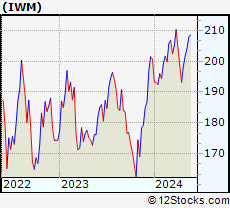
| SmallCap segment as represented by
IWM, an exchange-traded fund [ETF], holds basket of thousands of smallcap stocks from across all major sectors of the US stock market. The smallcap index (contains stocks like Riverbed & Sotheby's) is down by -1.51% and is currently underperforming the overall market by -7.17% year-to-date. Below is a quick view of technical charts and trends: | |
 IWM Weekly Chart |
|
| Long Term Trend: Good | |
| Medium Term Trend: Not Good | |
 IWM Daily Chart |
|
| Short Term Trend: Very Good | |
| Overall Trend Score: 58 | |
| YTD Performance: -1.51% | |
| **Trend Scores & Views Are Only For Educational Purposes And Not For Investing | |
| 12Stocks.com: Top Performing Small Cap Index Stocks | ||||||||||||||||||||||||||||||||||||||||||||||||
 The top performing Small Cap Index stocks year to date are
Now, more recently, over last week, the top performing Small Cap Index stocks on the move are


|
||||||||||||||||||||||||||||||||||||||||||||||||
| 12Stocks.com: Investing in Smallcap Index using Exchange Traded Funds | |
|
The following table shows list of key exchange traded funds (ETF) that
help investors track Smallcap index. The following list also includes leveraged ETF funds that track twice or thrice the daily returns of Smallcap indices. Short or inverse ETF funds move in the opposite direction to the index they track and are useful during market pullbacks or during bear markets. Quick View: Move mouse or cursor over ETF symbol (ticker) to view short-term technical chart and over ETF name to view long term chart. Click on ticker or stock name for detailed view. Click on to add stock symbol to your watchlist and to view watchlist. |
12Stocks.com List of ETFs that track Smallcap Index
| Ticker | ETF Name | Watchlist | Recent Price | Smart Investing & Trading Score | Change % | Week % | Year-to-date % |
| IWM | iShares Russell 2000 | | 197.68 | 58 | -0.45 | 2.35 | -1.51% |
| IJR | iShares Core S&P Small-Cap | | 105.71 | 85 | -0.24 | 2.41 | -2.35% |
| VTWO | Vanguard Russell 2000 ETF | | 79.93 | 63 | -0.45 | 2.37 | -1.44% |
| IWN | iShares Russell 2000 Value | | 151.28 | 75 | -0.30 | 2.37 | -2.61% |
| IWO | iShares Russell 2000 Growth | | 251.27 | 58 | -0.44 | 2.44 | -0.38% |
| IJS | iShares S&P Small-Cap 600 Value | | 97.71 | 60 | -0.43 | 2.2 | -5.2% |
| IJT | iShares S&P Small-Cap 600 Growth | | 125.37 | 70 | -0.28 | 2.59 | 0.18% |
| XSLV | PowerShares S&P SmallCap Low Volatil ETF | | 42.94 | 73 | -0.26 | 1.8 | -2.74% |
| SBB | ProShares Short SmallCap600 | | 16.37 | 33 | -0.02 | -2.79 | 2.76% |
| SMLV | SPDR SSGA US Small Cap Low Volatil ETF | | 108.43 | 73 | -0.31 | 2.21 | -3.63% |
| SAA | ProShares Ultra SmallCap600 | | 23.01 | 58 | -0.60 | 5.55 | -7.78% |
| SDD | ProShares UltraShort SmallCap600 | | 19.49 | 42 | 1.35 | -4.18 | 5.77% |
| 12Stocks.com: Charts, Trends, Fundamental Data and Performances of SmallCap Stocks | |
|
We now take in-depth look at all SmallCap stocks including charts, multi-period performances and overall trends (as measured by Smart Investing & Trading Score). One can sort SmallCap stocks (click link to choose) by Daily, Weekly and by Year-to-Date performances. Also, one can sort by size of the company or by market capitalization. |
| Select Your Default Chart Type: | |||||
| |||||
| Click on stock symbol or name for detailed view. Click on to add stock symbol to your watchlist and to view watchlist. Quick View: Move mouse or cursor over "Daily" to quickly view daily technical stock chart and over "Weekly" to view weekly technical stock chart. | |||||

 | HLVX HilleVax, Inc. |
| Sector: Health Care | |
| SubSector: Biotechnology | |
| MarketCap: 680 Millions | |
| Recent Price: 12.73 Smart Investing & Trading Score: 25 | |
| Day Percent Change: -0.59% Day Change: -0.08 | |
| Week Change: 3.46% Year-to-date Change: -22.8% | |
| HLVX Links: Profile News Message Board | |
| Charts:- Daily , Weekly | |
| Add HLVX to Watchlist: View: Get Complete HLVX Trend Analysis ➞ | |
 | IOVA Iovance Biotherapeutics, Inc. |
| Sector: Health Care | |
| SubSector: Biotechnology | |
| MarketCap: 3533.35 Millions | |
| Recent Price: 11.71 Smart Investing & Trading Score: 48 | |
| Day Percent Change: -1.26% Day Change: -0.15 | |
| Week Change: 3.45% Year-to-date Change: 44.0% | |
| IOVA Links: Profile News Message Board | |
| Charts:- Daily , Weekly | |
| Add IOVA to Watchlist: View: Get Complete IOVA Trend Analysis ➞ | |
 | HWKN Hawkins, Inc. |
| Sector: Materials | |
| SubSector: Specialty Chemicals | |
| MarketCap: 398.957 Millions | |
| Recent Price: 77.20 Smart Investing & Trading Score: 63 | |
| Day Percent Change: 0.32% Day Change: 0.25 | |
| Week Change: 3.44% Year-to-date Change: 9.6% | |
| HWKN Links: Profile News Message Board | |
| Charts:- Daily , Weekly | |
| Add HWKN to Watchlist: View: Get Complete HWKN Trend Analysis ➞ | |
 | CNXN PC Connection, Inc. |
| Sector: Technology | |
| SubSector: Computers Wholesale | |
| MarketCap: 1020.19 Millions | |
| Recent Price: 64.98 Smart Investing & Trading Score: 62 | |
| Day Percent Change: -0.09% Day Change: -0.06 | |
| Week Change: 3.44% Year-to-date Change: -3.3% | |
| CNXN Links: Profile News Message Board | |
| Charts:- Daily , Weekly | |
| Add CNXN to Watchlist: View: Get Complete CNXN Trend Analysis ➞ | |
 | WHD Cactus, Inc. |
| Sector: Energy | |
| SubSector: Oil & Gas Equipment & Services | |
| MarketCap: 920.261 Millions | |
| Recent Price: 52.32 Smart Investing & Trading Score: 73 | |
| Day Percent Change: -0.49% Day Change: -0.26 | |
| Week Change: 3.44% Year-to-date Change: 15.2% | |
| WHD Links: Profile News Message Board | |
| Charts:- Daily , Weekly | |
| Add WHD to Watchlist: View: Get Complete WHD Trend Analysis ➞ | |
 | SHOO Steven Madden, Ltd. |
| Sector: Consumer Staples | |
| SubSector: Textile - Apparel Footwear & Accessories | |
| MarketCap: 1756.3 Millions | |
| Recent Price: 40.46 Smart Investing & Trading Score: 49 | |
| Day Percent Change: 0.05% Day Change: 0.02 | |
| Week Change: 3.43% Year-to-date Change: -3.7% | |
| SHOO Links: Profile News Message Board | |
| Charts:- Daily , Weekly | |
| Add SHOO to Watchlist: View: Get Complete SHOO Trend Analysis ➞ | |
 | GEO The GEO Group, Inc. |
| Sector: Financials | |
| SubSector: REIT - Healthcare Facilities | |
| MarketCap: 1678.34 Millions | |
| Recent Price: 15.07 Smart Investing & Trading Score: 76 | |
| Day Percent Change: 0.53% Day Change: 0.08 | |
| Week Change: 3.43% Year-to-date Change: 39.2% | |
| GEO Links: Profile News Message Board | |
| Charts:- Daily , Weekly | |
| Add GEO to Watchlist: View: Get Complete GEO Trend Analysis ➞ | |
 | BY Byline Bancorp, Inc. |
| Sector: Financials | |
| SubSector: Regional - Midwest Banks | |
| MarketCap: 381.87 Millions | |
| Recent Price: 21.43 Smart Investing & Trading Score: 74 | |
| Day Percent Change: 0.61% Day Change: 0.13 | |
| Week Change: 3.43% Year-to-date Change: -9.0% | |
| BY Links: Profile News Message Board | |
| Charts:- Daily , Weekly | |
| Add BY to Watchlist: View: Get Complete BY Trend Analysis ➞ | |
 | FWRG First Watch Restaurant Group, Inc. |
| Sector: Services & Goods | |
| SubSector: Restaurants | |
| MarketCap: 1000 Millions | |
| Recent Price: 23.07 Smart Investing & Trading Score: 73 | |
| Day Percent Change: 1.47% Day Change: 0.34 | |
| Week Change: 3.43% Year-to-date Change: 15.7% | |
| FWRG Links: Profile News Message Board | |
| Charts:- Daily , Weekly | |
| Add FWRG to Watchlist: View: Get Complete FWRG Trend Analysis ➞ | |
 | BZH Beazer Homes USA, Inc. |
| Sector: Industrials | |
| SubSector: Residential Construction | |
| MarketCap: 180.106 Millions | |
| Recent Price: 27.21 Smart Investing & Trading Score: 32 | |
| Day Percent Change: -2.40% Day Change: -0.67 | |
| Week Change: 3.42% Year-to-date Change: -19.5% | |
| BZH Links: Profile News Message Board | |
| Charts:- Daily , Weekly | |
| Add BZH to Watchlist: View: Get Complete BZH Trend Analysis ➞ | |
 | NOVA Sunnova Energy International Inc. |
| Sector: Services & Goods | |
| SubSector: Management Services | |
| MarketCap: 1180.45 Millions | |
| Recent Price: 3.93 Smart Investing & Trading Score: 15 | |
| Day Percent Change: 0.26% Day Change: 0.01 | |
| Week Change: 3.42% Year-to-date Change: -74.2% | |
| NOVA Links: Profile News Message Board | |
| Charts:- Daily , Weekly | |
| Add NOVA to Watchlist: View: Get Complete NOVA Trend Analysis ➞ | |
 | CPF Central Pacific Financial Corp. |
| Sector: Financials | |
| SubSector: Regional - Pacific Banks | |
| MarketCap: 407.429 Millions | |
| Recent Price: 19.95 Smart Investing & Trading Score: 100 | |
| Day Percent Change: -0.05% Day Change: -0.01 | |
| Week Change: 3.42% Year-to-date Change: 1.4% | |
| CPF Links: Profile News Message Board | |
| Charts:- Daily , Weekly | |
| Add CPF to Watchlist: View: Get Complete CPF Trend Analysis ➞ | |
 | EWTX Edgewise Therapeutics, Inc. |
| Sector: Health Care | |
| SubSector: Biotechnology | |
| MarketCap: 492 Millions | |
| Recent Price: 15.75 Smart Investing & Trading Score: 22 | |
| Day Percent Change: 0.70% Day Change: 0.11 | |
| Week Change: 3.41% Year-to-date Change: 38.8% | |
| EWTX Links: Profile News Message Board | |
| Charts:- Daily , Weekly | |
| Add EWTX to Watchlist: View: Get Complete EWTX Trend Analysis ➞ | |
 | PRIM Primoris Services Corporation |
| Sector: Industrials | |
| SubSector: Heavy Construction | |
| MarketCap: 931.895 Millions | |
| Recent Price: 45.01 Smart Investing & Trading Score: 68 | |
| Day Percent Change: -0.88% Day Change: -0.40 | |
| Week Change: 3.4% Year-to-date Change: 35.5% | |
| PRIM Links: Profile News Message Board | |
| Charts:- Daily , Weekly | |
| Add PRIM to Watchlist: View: Get Complete PRIM Trend Analysis ➞ | |
 | SPSC SPS Commerce, Inc. |
| Sector: Technology | |
| SubSector: Application Software | |
| MarketCap: 1398.02 Millions | |
| Recent Price: 171.12 Smart Investing & Trading Score: 49 | |
| Day Percent Change: 0.30% Day Change: 0.52 | |
| Week Change: 3.4% Year-to-date Change: -11.7% | |
| SPSC Links: Profile News Message Board | |
| Charts:- Daily , Weekly | |
| Add SPSC to Watchlist: View: Get Complete SPSC Trend Analysis ➞ | |
 | IBOC International Bancshares Corporation |
| Sector: Financials | |
| SubSector: Regional - Southwest Banks | |
| MarketCap: 1159.45 Millions | |
| Recent Price: 56.26 Smart Investing & Trading Score: 100 | |
| Day Percent Change: 0.16% Day Change: 0.09 | |
| Week Change: 3.38% Year-to-date Change: 3.6% | |
| IBOC Links: Profile News Message Board | |
| Charts:- Daily , Weekly | |
| Add IBOC to Watchlist: View: Get Complete IBOC Trend Analysis ➞ | |
 | RMBS Rambus Inc. |
| Sector: Technology | |
| SubSector: Semiconductor- Memory Chips | |
| MarketCap: 1296 Millions | |
| Recent Price: 56.52 Smart Investing & Trading Score: 42 | |
| Day Percent Change: 0.14% Day Change: 0.08 | |
| Week Change: 3.37% Year-to-date Change: -17.2% | |
| RMBS Links: Profile News Message Board | |
| Charts:- Daily , Weekly | |
| Add RMBS to Watchlist: View: Get Complete RMBS Trend Analysis ➞ | |
 | OPTN OptiNose, Inc. |
| Sector: Health Care | |
| SubSector: Drugs - Generic | |
| MarketCap: 183.385 Millions | |
| Recent Price: 0.93 Smart Investing & Trading Score: 25 | |
| Day Percent Change: -4.38% Day Change: -0.04 | |
| Week Change: 3.37% Year-to-date Change: -28.3% | |
| OPTN Links: Profile News Message Board | |
| Charts:- Daily , Weekly | |
| Add OPTN to Watchlist: View: Get Complete OPTN Trend Analysis ➞ | |
 | NTGR NETGEAR, Inc. |
| Sector: Technology | |
| SubSector: Communication Equipment | |
| MarketCap: 558.839 Millions | |
| Recent Price: 14.74 Smart Investing & Trading Score: 68 | |
| Day Percent Change: 1.10% Day Change: 0.16 | |
| Week Change: 3.37% Year-to-date Change: 1.1% | |
| NTGR Links: Profile News Message Board | |
| Charts:- Daily , Weekly | |
| Add NTGR to Watchlist: View: Get Complete NTGR Trend Analysis ➞ | |
 | MOFG MidWestOne Financial Group, Inc. |
| Sector: Financials | |
| SubSector: Regional - Southwest Banks | |
| MarketCap: 345.265 Millions | |
| Recent Price: 21.45 Smart Investing & Trading Score: 35 | |
| Day Percent Change: 0.47% Day Change: 0.10 | |
| Week Change: 3.37% Year-to-date Change: -20.3% | |
| MOFG Links: Profile News Message Board | |
| Charts:- Daily , Weekly | |
| Add MOFG to Watchlist: View: Get Complete MOFG Trend Analysis ➞ | |
 | ALKS Alkermes plc |
| Sector: Health Care | |
| SubSector: Biotechnology | |
| MarketCap: 2311.95 Millions | |
| Recent Price: 24.65 Smart Investing & Trading Score: 49 | |
| Day Percent Change: 1.61% Day Change: 0.39 | |
| Week Change: 3.35% Year-to-date Change: -11.1% | |
| ALKS Links: Profile News Message Board | |
| Charts:- Daily , Weekly | |
| Add ALKS to Watchlist: View: Get Complete ALKS Trend Analysis ➞ | |
 | EPRT Essential Properties Realty Trust, Inc. |
| Sector: Financials | |
| SubSector: REIT - Diversified | |
| MarketCap: 1424.43 Millions | |
| Recent Price: 26.33 Smart Investing & Trading Score: 75 | |
| Day Percent Change: 0.19% Day Change: 0.05 | |
| Week Change: 3.34% Year-to-date Change: 3.0% | |
| EPRT Links: Profile News Message Board | |
| Charts:- Daily , Weekly | |
| Add EPRT to Watchlist: View: Get Complete EPRT Trend Analysis ➞ | |
 | ESE ESCO Technologies Inc. |
| Sector: Technology | |
| SubSector: Scientific & Technical Instruments | |
| MarketCap: 1968.03 Millions | |
| Recent Price: 104.28 Smart Investing & Trading Score: 83 | |
| Day Percent Change: -0.32% Day Change: -0.34 | |
| Week Change: 3.33% Year-to-date Change: -10.9% | |
| ESE Links: Profile News Message Board | |
| Charts:- Daily , Weekly | |
| Add ESE to Watchlist: View: Get Complete ESE Trend Analysis ➞ | |
 | MCS The Marcus Corporation |
| Sector: Services & Goods | |
| SubSector: Entertainment - Diversified | |
| MarketCap: 441.437 Millions | |
| Recent Price: 13.65 Smart Investing & Trading Score: 62 | |
| Day Percent Change: 0.74% Day Change: 0.10 | |
| Week Change: 3.33% Year-to-date Change: -6.4% | |
| MCS Links: Profile News Message Board | |
| Charts:- Daily , Weekly | |
| Add MCS to Watchlist: View: Get Complete MCS Trend Analysis ➞ | |
 | GTLS Chart Industries, Inc. |
| Sector: Industrials | |
| SubSector: Metal Fabrication | |
| MarketCap: 751.15 Millions | |
| Recent Price: 152.95 Smart Investing & Trading Score: 68 | |
| Day Percent Change: -0.37% Day Change: -0.57 | |
| Week Change: 3.32% Year-to-date Change: 12.2% | |
| GTLS Links: Profile News Message Board | |
| Charts:- Daily , Weekly | |
| Add GTLS to Watchlist: View: Get Complete GTLS Trend Analysis ➞ | |
| Too many stocks? View smallcap stocks filtered by marketcap & sector |
| Marketcap: All SmallCap Stocks (default-no microcap), Large, Mid-Range, Small & MicroCap |
| Sector: Tech, Finance, Energy, Staples, Retail, Industrial, Materials, Utilities & Medical |
|
Best Stocks Today 12Stocks.com |
© 2024 12Stocks.com Terms & Conditions Privacy Contact Us
All Information Provided Only For Education And Not To Be Used For Investing or Trading. See Terms & Conditions


One More Thing ... Get Best Stocks Delivered Daily!
Never Ever Miss A Move With Our Top Ten Stocks Lists
Find Best Stocks In Any Market - Bull or Bear Market
Take A Peek At Our Top Ten Stocks Lists: Daily, Weekly, Year-to-Date & Top Trends
Find Best Stocks In Any Market - Bull or Bear Market
Take A Peek At Our Top Ten Stocks Lists: Daily, Weekly, Year-to-Date & Top Trends
Smallcap Stocks With Best Up Trends [0-bearish to 100-bullish]: B. Riley[100], Ribbon [100], Group 1[100], Trustmark [100], MBIA [100], Integer [100], EchoStar [100], Comstock Resources[100], Vishay Inter[100], First Ban[100], Jamf Holding[100]
Best Smallcap Stocks Year-to-Date:
CareMax [574.23%], Janux [352.07%], Viking [249.65%], Alpine Immune[239.13%], Longboard [223.4%], Avidity Biosciences[177.71%], Arcutis Bio[170.9%], Super Micro[165.5%], Vera [149.61%], Hippo [130.79%], Y-mAbs [124.19%] Best Smallcap Stocks This Week:
Matterport [166.09%], B. Riley[48.82%], Seres [30.29%], Riot Blockchain[30.12%], CareMax [27.24%], Ribbon [25.97%], ProKidney [23.28%], SoundHound AI[22.54%], Cipher Mining[22.14%], Hibbett Sports[21.61%], Cullinan Oncology[20.69%] Best Smallcap Stocks Daily:
B. Riley[36.97%], Ribbon [26.46%], Babcock & Wilcox Enterprises[15.57%], Cullinan Oncology[13.55%], Amneal [12.04%], Comtech Tele[10.76%], Innodata [10.28%], Gritstone Oncology[10.06%], Navitas Semiconductor[8.83%], Eyenovia [8.68%], K12 [8.64%]