
 Login Sign Up


| |||||
 |  | ||||

| 12Stocks.com Market Intelligence |
Best SmallCap Stocks
|
| In a hurry? Small Cap Stock Lists: Performance Trends Table, Stock Charts
Sort Small Cap stocks: Daily, Weekly, Year-to-Date, Market Cap & Trends. Filter Small Cap stocks list by sector: Show all, Tech, Finance, Energy, Staples, Retail, Industrial, Materials, Utilities and HealthCare Filter Small Cap stocks list by size: All Large Medium Small and MicroCap |
| 12Stocks.com Small Cap Stocks Performances & Trends Daily | |||||||||
|
|  The overall Smart Investing & Trading Score is 0 (0-bearish to 100-bullish) which puts Small Cap index in short term bearish trend. The Smart Investing & Trading Score from previous trading session is 18 and hence a deterioration of trend.
| ||||||||
Here are the Smart Investing & Trading Scores of the most requested small cap stocks at 12Stocks.com (click stock name for detailed review):
|


| 12Stocks.com: Investing in Smallcap Index with Stocks | |
|
The following table helps investors and traders sort through current performance and trends (as measured by Smart Investing & Trading Score) of various
stocks in the Smallcap Index. Quick View: Move mouse or cursor over stock symbol (ticker) to view short-term technical chart and over stock name to view long term chart. Click on  to add stock symbol to your watchlist and to add stock symbol to your watchlist and  to view watchlist. Click on any ticker or stock name for detailed market intelligence report for that stock. to view watchlist. Click on any ticker or stock name for detailed market intelligence report for that stock. |
12Stocks.com Performance of Stocks in Smallcap Index
| Ticker | Stock Name | Watchlist | Category | Recent Price | Smart Investing & Trading Score | Change % | Weekly Change% |
| MORF | Morphic Holding |   | Health Care | 26.45 | 0 | -4.68% | -14.04% |
| ADPT | Adaptive Bio | | Health Care | 3.13 | 5 | -5.15% | -14.13% |
| SPWH | Sportsman s | | Consumer Staples | 2.64 | 10 | 0.38% | -14.29% |
| PROK | ProKidney | | Health Care | 2.73 | 61 | -8.08% | -14.42% |
| OM | Outset Medical | | Health Care | 3.85 | 43 | -1.53% | -14.44% |
| HIPO | Hippo | | Financials | 15.22 | 5 | -2.56% | -14.54% |
| EVER | EverQuote | | Financials | 19.18 | 26 | -4.77% | -14.57% |
| DDD | 3D Systems | | Technology | 3.51 | 32 | -5.90% | -14.81% |
| XMTR | Xometry | | Industrials | 12.67 | 0 | -3.80% | -14.91% |
| ORIC | ORIC | | Health Care | 7.49 | 0 | -2.47% | -15.18% |
| CMPX | Compass | | Health Care | 1.11 | 0 | -4.31% | -15.27% |
| SPWR | SunPower | | Technology | 2.80 | 10 | -9.82% | -15.54% |
| INGN | Inogen | | Health Care | 7.29 | 5 | -7.31% | -15.57% |
| UNIT | Uniti Group | | Financials | 2.75 | 10 | -11.58% | -15.64% |
| CGEM | Cullinan Oncology | | Health Care | 18.88 | 26 | -13.39% | -15.71% |
| SSP | E.W. Scripps | | Services & Goods | 2.03 | 10 | -5.58% | -15.77% |
| GBIO | Generation Bio | | Health Care | 2.74 | 5 | -19.88% | -15.95% |
| MEI | Methode Electronics | | Technology | 9.50 | 10 | -3.85% | -16.08% |
| WKHS | Workhorse Group | | Consumer Staples | 0.15 | 20 | 0.13% | -16.56% |
| ZNTL | Zentalis | | Health Care | 8.84 | 0 | -7.14% | -16.76% |
| LUNG | Pulmonx | | Health Care | 5.77 | 0 | -7.75% | -16.86% |
| EYEN | Eyenovia | | Health Care | 0.63 | 27 | 0.51% | -16.99% |
| SIG | Signet Jewelers | | Services & Goods | 87.18 | 0 | -5.50% | -17.54% |
| WW | WW | | Services & Goods | 1.29 | 5 | -10.07% | -18.04% |
| ZVIA | Zevia PBC | | Consumer Staples | 0.76 | 10 | -6.62% | -18.32% |


| Too many stocks? View smallcap stocks filtered by marketcap & sector |
| Marketcap: All SmallCap Stocks (default-no microcap), Large, Mid-Range, Small |
| Smallcap Sector: Tech, Finance, Energy, Staples, Retail, Industrial, Materials, & Medical |
|
Get the most comprehensive stock market coverage daily at 12Stocks.com ➞ Best Stocks Today ➞ Best Stocks Weekly ➞ Best Stocks Year-to-Date ➞ Best Stocks Trends ➞  Best Stocks Today 12Stocks.com Best Nasdaq Stocks ➞ Best S&P 500 Stocks ➞ Best Tech Stocks ➞ Best Biotech Stocks ➞ |
| Detailed Overview of SmallCap Stocks |
| SmallCap Technical Overview, Leaders & Laggards, Top SmallCap ETF Funds & Detailed SmallCap Stocks List, Charts, Trends & More |
| Smallcap: Technical Analysis, Trends & YTD Performance | |
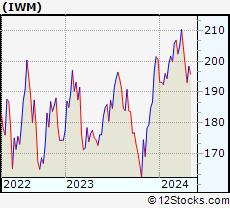
| SmallCap segment as represented by
IWM, an exchange-traded fund [ETF], holds basket of thousands of smallcap stocks from across all major sectors of the US stock market. The smallcap index (contains stocks like Riverbed & Sotheby's) is down by -0.99% and is currently underperforming the overall market by -13.41% year-to-date. Below is a quick view of technical charts and trends: | |
 IWM Weekly Chart |
|
| Long Term Trend: Not Good | |
| Medium Term Trend: Not Good | |
 IWM Daily Chart |
|
| Short Term Trend: Not Good | |
| Overall Trend Score: 0 | |
| YTD Performance: -0.99% | |
| **Trend Scores & Views Are Only For Educational Purposes And Not For Investing | |
| 12Stocks.com: Top Performing Small Cap Index Stocks | ||||||||||||||||||||||||||||||||||||||||||||||||
 The top performing Small Cap Index stocks year to date are
Now, more recently, over last week, the top performing Small Cap Index stocks on the move are


|
||||||||||||||||||||||||||||||||||||||||||||||||
| 12Stocks.com: Investing in Smallcap Index using Exchange Traded Funds | |
|
The following table shows list of key exchange traded funds (ETF) that
help investors track Smallcap index. The following list also includes leveraged ETF funds that track twice or thrice the daily returns of Smallcap indices. Short or inverse ETF funds move in the opposite direction to the index they track and are useful during market pullbacks or during bear markets. Quick View: Move mouse or cursor over ETF symbol (ticker) to view short-term technical chart and over ETF name to view long term chart. Click on ticker or stock name for detailed view. Click on to add stock symbol to your watchlist and to view watchlist. |
12Stocks.com List of ETFs that track Smallcap Index
| Ticker | ETF Name | Watchlist | Recent Price | Smart Investing & Trading Score | Change % | Week % | Year-to-date % |
| IWM | iShares Russell 2000 | | 198.73 | 0 | -1.59 | -1.23 | -0.99% |
| IJR | iShares Core S&P Small-Cap | | 104.68 | 10 | -1.49 | -2.23 | -3.3% |
| VTWO | Vanguard Russell 2000 ETF | | 80.61 | 8 | -1.56 | -0.95 | -0.61% |
| IWN | iShares Russell 2000 Value | | 148.78 | 10 | -1.54 | -2.19 | -4.22% |
| IWO | iShares Russell 2000 Growth | | 258.17 | 20 | -1.49 | -0.89 | 2.36% |
| IJS | iShares S&P Small-Cap 600 Value | | 95.28 | 0 | -1.41 | -2.71 | -7.56% |
| IJT | iShares S&P Small-Cap 600 Growth | | 125.96 | 0 | -1.69 | -1.68 | 0.66% |
| XSLV | PowerShares S&P SmallCap Low Volatil ETF | | 42.74 | 8 | -1.01 | -1.5 | -3.19% |
| SMLV | SPDR SSGA US Small Cap Low Volatil ETF | | 106.36 | 8 | -1.01 | -1.56 | -5.47% |
| SDD | ProShares UltraShort SmallCap600 | | 19.87 | 93 | 2.63 | 4.37 | 7.83% |
| SBB | ProShares Short SmallCap600 | | 16.68 | 100 | 1.90 | 2.39 | 4.71% |
| SAA | ProShares Ultra SmallCap600 | | 22.88 | 25 | -1.26 | -1.83 | -8.3% |
| 12Stocks.com: Charts, Trends, Fundamental Data and Performances of SmallCap Stocks | |
|
We now take in-depth look at all SmallCap stocks including charts, multi-period performances and overall trends (as measured by Smart Investing & Trading Score). One can sort SmallCap stocks (click link to choose) by Daily, Weekly and by Year-to-Date performances. Also, one can sort by size of the company or by market capitalization. |
| Select Your Default Chart Type: | |||||
| |||||
| Click on stock symbol or name for detailed view. Click on to add stock symbol to your watchlist and to view watchlist. Quick View: Move mouse or cursor over "Daily" to quickly view daily technical stock chart and over "Weekly" to view weekly technical stock chart. | |||||

 | MORF Morphic Holding, Inc. |
| Sector: Health Care | |
| SubSector: Biotechnology | |
| MarketCap: 484.885 Millions | |
| Recent Price: 26.45 Smart Investing & Trading Score: 0 | |
| Day Percent Change: -4.68% Day Change: -1.30 | |
| Week Change: -14.04% Year-to-date Change: -8.4% | |
| MORF Links: Profile News Message Board | |
| Charts:- Daily , Weekly | |
| Add MORF to Watchlist: View: Get Complete MORF Trend Analysis ➞ | |
 | ADPT Adaptive Biotechnologies Corporation |
| Sector: Health Care | |
| SubSector: Biotechnology | |
| MarketCap: 3525.75 Millions | |
| Recent Price: 3.13 Smart Investing & Trading Score: 5 | |
| Day Percent Change: -5.15% Day Change: -0.17 | |
| Week Change: -14.13% Year-to-date Change: -36.1% | |
| ADPT Links: Profile News Message Board | |
| Charts:- Daily , Weekly | |
| Add ADPT to Watchlist: View: Get Complete ADPT Trend Analysis ➞ | |
 | SPWH Sportsman s Warehouse Holdings, Inc. |
| Sector: Consumer Staples | |
| SubSector: Sporting Goods | |
| MarketCap: 247.144 Millions | |
| Recent Price: 2.64 Smart Investing & Trading Score: 10 | |
| Day Percent Change: 0.38% Day Change: 0.01 | |
| Week Change: -14.29% Year-to-date Change: -38.0% | |
| SPWH Links: Profile News Message Board | |
| Charts:- Daily , Weekly | |
| Add SPWH to Watchlist: View: Get Complete SPWH Trend Analysis ➞ | |
 | PROK ProKidney Corp. |
| Sector: Health Care | |
| SubSector: Biotechnology | |
| MarketCap: 2470 Millions | |
| Recent Price: 2.73 Smart Investing & Trading Score: 61 | |
| Day Percent Change: -8.08% Day Change: -0.24 | |
| Week Change: -14.42% Year-to-date Change: 56.5% | |
| PROK Links: Profile News Message Board | |
| Charts:- Daily , Weekly | |
| Add PROK to Watchlist: View: Get Complete PROK Trend Analysis ➞ | |
 | OM Outset Medical, Inc. |
| Sector: Health Care | |
| SubSector: Medical Devices | |
| MarketCap: 21787 Millions | |
| Recent Price: 3.85 Smart Investing & Trading Score: 43 | |
| Day Percent Change: -1.53% Day Change: -0.06 | |
| Week Change: -14.44% Year-to-date Change: -28.8% | |
| OM Links: Profile News Message Board | |
| Charts:- Daily , Weekly | |
| Add OM to Watchlist: View: Get Complete OM Trend Analysis ➞ | |
 | HIPO Hippo Holdings Inc. |
| Sector: Financials | |
| SubSector: Insurance - Specialty | |
| MarketCap: 377 Millions | |
| Recent Price: 15.22 Smart Investing & Trading Score: 5 | |
| Day Percent Change: -2.56% Day Change: -0.40 | |
| Week Change: -14.54% Year-to-date Change: 67.1% | |
| HIPO Links: Profile News Message Board | |
| Charts:- Daily , Weekly | |
| Add HIPO to Watchlist: View: Get Complete HIPO Trend Analysis ➞ | |
 | EVER EverQuote, Inc. |
| Sector: Financials | |
| SubSector: Regional - Southeast Banks | |
| MarketCap: 767.135 Millions | |
| Recent Price: 19.18 Smart Investing & Trading Score: 26 | |
| Day Percent Change: -4.77% Day Change: -0.96 | |
| Week Change: -14.57% Year-to-date Change: 56.7% | |
| EVER Links: Profile News Message Board | |
| Charts:- Daily , Weekly | |
| Add EVER to Watchlist: View: Get Complete EVER Trend Analysis ➞ | |
 | DDD 3D Systems Corporation |
| Sector: Technology | |
| SubSector: Computer Peripherals | |
| MarketCap: 842.989 Millions | |
| Recent Price: 3.51 Smart Investing & Trading Score: 32 | |
| Day Percent Change: -5.90% Day Change: -0.22 | |
| Week Change: -14.81% Year-to-date Change: -44.7% | |
| DDD Links: Profile News Message Board | |
| Charts:- Daily , Weekly | |
| Add DDD to Watchlist: View: Get Complete DDD Trend Analysis ➞ | |
 | XMTR Xometry, Inc. |
| Sector: Industrials | |
| SubSector: Specialty Industrial Machinery | |
| MarketCap: 1050 Millions | |
| Recent Price: 12.67 Smart Investing & Trading Score: 0 | |
| Day Percent Change: -3.80% Day Change: -0.50 | |
| Week Change: -14.91% Year-to-date Change: -65.5% | |
| XMTR Links: Profile News Message Board | |
| Charts:- Daily , Weekly | |
| Add XMTR to Watchlist: View: Get Complete XMTR Trend Analysis ➞ | |
 | ORIC ORIC Pharmaceuticals, Inc. |
| Sector: Health Care | |
| SubSector: Biotechnology | |
| MarketCap: 12787 Millions | |
| Recent Price: 7.49 Smart Investing & Trading Score: 0 | |
| Day Percent Change: -2.47% Day Change: -0.19 | |
| Week Change: -15.18% Year-to-date Change: -18.8% | |
| ORIC Links: Profile News Message Board | |
| Charts:- Daily , Weekly | |
| Add ORIC to Watchlist: View: Get Complete ORIC Trend Analysis ➞ | |
 | CMPX Compass Therapeutics, Inc. |
| Sector: Health Care | |
| SubSector: Biotechnology | |
| MarketCap: 406 Millions | |
| Recent Price: 1.11 Smart Investing & Trading Score: 0 | |
| Day Percent Change: -4.31% Day Change: -0.05 | |
| Week Change: -15.27% Year-to-date Change: -27.7% | |
| CMPX Links: Profile News Message Board | |
| Charts:- Daily , Weekly | |
| Add CMPX to Watchlist: View: Get Complete CMPX Trend Analysis ➞ | |
 | SPWR SunPower Corporation |
| Sector: Technology | |
| SubSector: Semiconductor - Specialized | |
| MarketCap: 1202.6 Millions | |
| Recent Price: 2.80 Smart Investing & Trading Score: 10 | |
| Day Percent Change: -9.82% Day Change: -0.31 | |
| Week Change: -15.54% Year-to-date Change: -42.0% | |
| SPWR Links: Profile News Message Board | |
| Charts:- Daily , Weekly | |
| Add SPWR to Watchlist: View: Get Complete SPWR Trend Analysis ➞ | |
 | INGN Inogen, Inc. |
| Sector: Health Care | |
| SubSector: Medical Instruments & Supplies | |
| MarketCap: 8803.6 Millions | |
| Recent Price: 7.29 Smart Investing & Trading Score: 5 | |
| Day Percent Change: -7.31% Day Change: -0.58 | |
| Week Change: -15.57% Year-to-date Change: 32.9% | |
| INGN Links: Profile News Message Board | |
| Charts:- Daily , Weekly | |
| Add INGN to Watchlist: View: Get Complete INGN Trend Analysis ➞ | |
 | UNIT Uniti Group Inc. |
| Sector: Financials | |
| SubSector: REIT - Industrial | |
| MarketCap: 1363.09 Millions | |
| Recent Price: 2.75 Smart Investing & Trading Score: 10 | |
| Day Percent Change: -11.58% Day Change: -0.36 | |
| Week Change: -15.64% Year-to-date Change: -52.4% | |
| UNIT Links: Profile News Message Board | |
| Charts:- Daily , Weekly | |
| Add UNIT to Watchlist: View: Get Complete UNIT Trend Analysis ➞ | |
 | CGEM Cullinan Oncology, Inc. |
| Sector: Health Care | |
| SubSector: Biotechnology | |
| MarketCap: 433 Millions | |
| Recent Price: 18.88 Smart Investing & Trading Score: 26 | |
| Day Percent Change: -13.39% Day Change: -2.92 | |
| Week Change: -15.71% Year-to-date Change: 85.2% | |
| CGEM Links: Profile News Message Board | |
| Charts:- Daily , Weekly | |
| Add CGEM to Watchlist: View: Get Complete CGEM Trend Analysis ➞ | |
 | SSP The E.W. Scripps Company |
| Sector: Services & Goods | |
| SubSector: Broadcasting - TV | |
| MarketCap: 766.163 Millions | |
| Recent Price: 2.03 Smart Investing & Trading Score: 10 | |
| Day Percent Change: -5.58% Day Change: -0.12 | |
| Week Change: -15.77% Year-to-date Change: -74.6% | |
| SSP Links: Profile News Message Board | |
| Charts:- Daily , Weekly | |
| Add SSP to Watchlist: View: Get Complete SSP Trend Analysis ➞ | |
 | GBIO Generation Bio Co. |
| Sector: Health Care | |
| SubSector: Biotechnology | |
| MarketCap: 17487 Millions | |
| Recent Price: 2.74 Smart Investing & Trading Score: 5 | |
| Day Percent Change: -19.88% Day Change: -0.68 | |
| Week Change: -15.95% Year-to-date Change: 66.1% | |
| GBIO Links: Profile News Message Board | |
| Charts:- Daily , Weekly | |
| Add GBIO to Watchlist: View: Get Complete GBIO Trend Analysis ➞ | |
 | MEI Methode Electronics, Inc. |
| Sector: Technology | |
| SubSector: Diversified Electronics | |
| MarketCap: 941.896 Millions | |
| Recent Price: 9.50 Smart Investing & Trading Score: 10 | |
| Day Percent Change: -3.85% Day Change: -0.38 | |
| Week Change: -16.08% Year-to-date Change: -58.2% | |
| MEI Links: Profile News Message Board | |
| Charts:- Daily , Weekly | |
| Add MEI to Watchlist: View: Get Complete MEI Trend Analysis ➞ | |
 | WKHS Workhorse Group Inc. |
| Sector: Consumer Staples | |
| SubSector: Auto Parts | |
| MarketCap: 129.839 Millions | |
| Recent Price: 0.15 Smart Investing & Trading Score: 20 | |
| Day Percent Change: 0.13% Day Change: 0.00 | |
| Week Change: -16.56% Year-to-date Change: -58.3% | |
| WKHS Links: Profile News Message Board | |
| Charts:- Daily , Weekly | |
| Add WKHS to Watchlist: View: Get Complete WKHS Trend Analysis ➞ | |
 | ZNTL Zentalis Pharmaceuticals, Inc. |
| Sector: Health Care | |
| SubSector: Biotechnology | |
| MarketCap: 22187 Millions | |
| Recent Price: 8.84 Smart Investing & Trading Score: 0 | |
| Day Percent Change: -7.14% Day Change: -0.68 | |
| Week Change: -16.76% Year-to-date Change: -41.7% | |
| ZNTL Links: Profile News Message Board | |
| Charts:- Daily , Weekly | |
| Add ZNTL to Watchlist: View: Get Complete ZNTL Trend Analysis ➞ | |
 | LUNG Pulmonx Corporation |
| Sector: Health Care | |
| SubSector: Medical Devices | |
| MarketCap: 18187 Millions | |
| Recent Price: 5.77 Smart Investing & Trading Score: 0 | |
| Day Percent Change: -7.75% Day Change: -0.49 | |
| Week Change: -16.86% Year-to-date Change: -54.8% | |
| LUNG Links: Profile News Message Board | |
| Charts:- Daily , Weekly | |
| Add LUNG to Watchlist: View: Get Complete LUNG Trend Analysis ➞ | |
 | EYEN Eyenovia, Inc. |
| Sector: Health Care | |
| SubSector: Biotechnology | |
| MarketCap: 52.2785 Millions | |
| Recent Price: 0.63 Smart Investing & Trading Score: 27 | |
| Day Percent Change: 0.51% Day Change: 0.00 | |
| Week Change: -16.99% Year-to-date Change: -69.8% | |
| EYEN Links: Profile News Message Board | |
| Charts:- Daily , Weekly | |
| Add EYEN to Watchlist: View: Get Complete EYEN Trend Analysis ➞ | |
 | SIG Signet Jewelers Limited |
| Sector: Services & Goods | |
| SubSector: Jewelry Stores | |
| MarketCap: 518.1 Millions | |
| Recent Price: 87.18 Smart Investing & Trading Score: 0 | |
| Day Percent Change: -5.50% Day Change: -5.07 | |
| Week Change: -17.54% Year-to-date Change: -18.7% | |
| SIG Links: Profile News Message Board | |
| Charts:- Daily , Weekly | |
| Add SIG to Watchlist: View: Get Complete SIG Trend Analysis ➞ | |
 | WW WW International, Inc. |
| Sector: Services & Goods | |
| SubSector: Personal Services | |
| MarketCap: 1186.25 Millions | |
| Recent Price: 1.29 Smart Investing & Trading Score: 5 | |
| Day Percent Change: -10.07% Day Change: -0.15 | |
| Week Change: -18.04% Year-to-date Change: -85.2% | |
| WW Links: Profile News Message Board | |
| Charts:- Daily , Weekly | |
| Add WW to Watchlist: View: Get Complete WW Trend Analysis ➞ | |
 | ZVIA Zevia PBC |
| Sector: Consumer Staples | |
| SubSector: Beverages - Non-Alcoholic | |
| MarketCap: 303 Millions | |
| Recent Price: 0.76 Smart Investing & Trading Score: 10 | |
| Day Percent Change: -6.62% Day Change: -0.05 | |
| Week Change: -18.32% Year-to-date Change: -62.4% | |
| ZVIA Links: Profile News Message Board | |
| Charts:- Daily , Weekly | |
| Add ZVIA to Watchlist: View: Get Complete ZVIA Trend Analysis ➞ | |
| Too many stocks? View smallcap stocks filtered by marketcap & sector |
| Marketcap: All SmallCap Stocks (default-no microcap), Large, Mid-Range, Small & MicroCap |
| Sector: Tech, Finance, Energy, Staples, Retail, Industrial, Materials, Utilities & Medical |
|
Best Stocks Today 12Stocks.com |
© 2024 12Stocks.com Terms & Conditions Privacy Contact Us
All Information Provided Only For Education And Not To Be Used For Investing or Trading. See Terms & Conditions


One More Thing ... Get Best Stocks Delivered Daily!
Never Ever Miss A Move With Our Top Ten Stocks Lists
Find Best Stocks In Any Market - Bull or Bear Market
Take A Peek At Our Top Ten Stocks Lists: Daily, Weekly, Year-to-Date & Top Trends
Find Best Stocks In Any Market - Bull or Bear Market
Take A Peek At Our Top Ten Stocks Lists: Daily, Weekly, Year-to-Date & Top Trends
Smallcap Stocks With Best Up Trends [0-bearish to 100-bullish]: 2U [100], Li-Cycle [100], UroGen Pharma[100], Chimera [100], Aurinia [100], Cinemark [100], Terns [100], BRC [100], Rackspace [100], Commvault Systems[100], Instructure [100]
Best Smallcap Stocks Year-to-Date:
Li-Cycle [581.56%], 2U [508.94%], CareMax [467.01%], Dominion Midstream[411.32%], Avidity Biosciences[338.5%], Janux [290.88%], Summit [221.46%], Stoke [208.94%], Longboard [203.11%], Novavax [200%], Super Micro[197.1%] Best Smallcap Stocks This Week:
Dominion Midstream[683.67%], Kaltura [49.88%], Li-Cycle [49.82%], Avidity Biosciences[49.02%], Scilex Holding[47.71%], UroGen Pharma[45.34%], Biomea Fusion[36.23%], Tango [29.42%], Nerdy [27.89%], Cipher Mining[22.83%], FiscalNote [21.93%] Best Smallcap Stocks Daily:
2U [3192.31%], Li-Cycle [18.44%], Disc Medicine[18.16%], Ocular Therapeutix[14.09%], FTC Solar[11.40%], UroGen Pharma[9.84%], DMC Global[9.15%], Scilex Holding[8.05%], Tutor Perini[7.92%], Grindr [7.64%], Chimera [7.54%]