
 Login Sign Up


| |||||
 |  | ||||

| 12Stocks.com Market Intelligence |
Best SmallCap Stocks
|
| In a hurry? Small Cap Stock Lists: Performance Trends Table, Stock Charts
Sort Small Cap stocks: Daily, Weekly, Year-to-Date, Market Cap & Trends. Filter Small Cap stocks list by sector: Show all, Tech, Finance, Energy, Staples, Retail, Industrial, Materials, Utilities and HealthCare Filter Small Cap stocks list by size: All Large Medium Small and MicroCap |
| 12Stocks.com Small Cap Stocks Performances & Trends Daily | |||||||||
|
|  The overall Smart Investing & Trading Score is 86 (0-bearish to 100-bullish) which puts Small Cap index in short term bullish trend. The Smart Investing & Trading Score from previous trading session is 48 and hence an improvement of trend.
| ||||||||
Here are the Smart Investing & Trading Scores of the most requested small cap stocks at 12Stocks.com (click stock name for detailed review):
|


| 12Stocks.com: Investing in Smallcap Index with Stocks | |
|
The following table helps investors and traders sort through current performance and trends (as measured by Smart Investing & Trading Score) of various
stocks in the Smallcap Index. Quick View: Move mouse or cursor over stock symbol (ticker) to view short-term technical chart and over stock name to view long term chart. Click on  to add stock symbol to your watchlist and to add stock symbol to your watchlist and  to view watchlist. Click on any ticker or stock name for detailed market intelligence report for that stock. to view watchlist. Click on any ticker or stock name for detailed market intelligence report for that stock. |
12Stocks.com Performance of Stocks in Smallcap Index
| Ticker | Stock Name | Watchlist | Category | Recent Price | Smart Investing & Trading Score | Change % | Weekly Change% |
| VRTS | Virtus |   | Financials | 228.59 | 50 | 0.84% | -1.74% |
| ATGE | Adtalem Global | | Services & Goods | 64.39 | 61 | -1.75% | -1.75% |
| BIRD | Allbirds | | Services & Goods | 0.59 | 30 | 1.90% | -1.75% |
| ENVX | Enovix | | Industrials | 10.62 | 61 | -5.01% | -1.76% |
| TRS | TriMas | | Industrials | 26.62 | 76 | -0.30% | -1.77% |
| HRMY | Harmony Biosciences | | Health Care | 29.40 | 38 | 1.84% | -1.77% |
| GCBC | Greene County | | Financials | 31.43 | 73 | 1.22% | -1.78% |
| HRI | Herc | | Transports | 145.07 | 32 | 2.47% | -1.78% |
| SHCR | Sharecare | | Health Care | 0.81 | 30 | -3.69% | -1.80% |
| CFFI | C&F Financial | | Financials | 43.84 | 32 | 0.09% | -1.81% |
| ITRI | Itron | | Technology | 107.55 | 58 | -0.62% | -1.82% |
| CCNE | CNB Financial | | Financials | 19.40 | 17 | 0.10% | -1.82% |
| CPF | Central Pacific | | Financials | 20.28 | 46 | -0.93% | -1.84% |
| VRRM | Verra Mobility | | Services & Goods | 26.64 | 69 | 0.04% | -1.84% |
| AEIS | Advanced Energy | | Technology | 107.43 | 76 | 0.53% | -1.85% |
| MMI | Marcus & Millichap | | Financials | 32.33 | 25 | 0.25% | -1.85% |
| IBOC | Bancshares | | Financials | 56.83 | 53 | 0.51% | -1.86% |
| AVTE | Aerovate | | Health Care | 17.45 | 32 | -1.19% | -1.86% |
| STC | Stewart Information | | Financials | 63.31 | 35 | -0.35% | -1.88% |
| ORRF | Orrstown Financial | | Financials | 26.11 | 27 | 1.20% | -1.88% |
| BCOV | Brightcove | | Technology | 2.09 | 42 | -0.95% | -1.88% |
| SPRY | ARS | | Health Care | 8.88 | 53 | -0.34% | -1.88% |
| EGAN | eGain | | Technology | 6.19 | 57 | 4.30% | -1.90% |
| NNI | Nelnet | | Financials | 103.66 | 51 | -0.55% | -1.91% |
| AVD | American Vanguard | | Materials | 8.69 | 10 | 0.35% | -1.92% |


| Too many stocks? View smallcap stocks filtered by marketcap & sector |
| Marketcap: All SmallCap Stocks (default-no microcap), Large, Mid-Range, Small |
| Smallcap Sector: Tech, Finance, Energy, Staples, Retail, Industrial, Materials, & Medical |
|
Get the most comprehensive stock market coverage daily at 12Stocks.com ➞ Best Stocks Today ➞ Best Stocks Weekly ➞ Best Stocks Year-to-Date ➞ Best Stocks Trends ➞  Best Stocks Today 12Stocks.com Best Nasdaq Stocks ➞ Best S&P 500 Stocks ➞ Best Tech Stocks ➞ Best Biotech Stocks ➞ |
| Detailed Overview of SmallCap Stocks |
| SmallCap Technical Overview, Leaders & Laggards, Top SmallCap ETF Funds & Detailed SmallCap Stocks List, Charts, Trends & More |
| Smallcap: Technical Analysis, Trends & YTD Performance | |
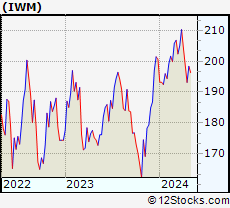
| SmallCap segment as represented by
IWM, an exchange-traded fund [ETF], holds basket of thousands of smallcap stocks from across all major sectors of the US stock market. The smallcap index (contains stocks like Riverbed & Sotheby's) is up by 2.52% and is currently underperforming the overall market by -7.27% year-to-date. Below is a quick view of technical charts and trends: | |
 IWM Weekly Chart |
|
| Long Term Trend: Very Good | |
| Medium Term Trend: Very Good | |
 IWM Daily Chart |
|
| Short Term Trend: Very Good | |
| Overall Trend Score: 86 | |
| YTD Performance: 2.52% | |
| **Trend Scores & Views Are Only For Educational Purposes And Not For Investing | |
| 12Stocks.com: Top Performing Small Cap Index Stocks | ||||||||||||||||||||||||||||||||||||||||||||||||
 The top performing Small Cap Index stocks year to date are
Now, more recently, over last week, the top performing Small Cap Index stocks on the move are


|
||||||||||||||||||||||||||||||||||||||||||||||||
| 12Stocks.com: Investing in Smallcap Index using Exchange Traded Funds | |
|
The following table shows list of key exchange traded funds (ETF) that
help investors track Smallcap index. The following list also includes leveraged ETF funds that track twice or thrice the daily returns of Smallcap indices. Short or inverse ETF funds move in the opposite direction to the index they track and are useful during market pullbacks or during bear markets. Quick View: Move mouse or cursor over ETF symbol (ticker) to view short-term technical chart and over ETF name to view long term chart. Click on ticker or stock name for detailed view. Click on to add stock symbol to your watchlist and to view watchlist. |
12Stocks.com List of ETFs that track Smallcap Index
| Ticker | ETF Name | Watchlist | Recent Price | Smart Investing & Trading Score | Change % | Week % | Year-to-date % |
| IWM | iShares Russell 2000 | | 205.77 | 86 | 0.84 | 0.16 | 2.52% |
| IJR | iShares Core S&P Small-Cap | | 109.65 | 93 | 1.14 | 0.76 | 1.29% |
| IWN | iShares Russell 2000 Value | | 155.88 | 76 | 1.17 | 0.46 | 0.35% |
| IWO | iShares Russell 2000 Growth | | 263.62 | 68 | 0.33 | -0.29 | 4.52% |
| VTWO | Vanguard Russell 2000 ETF | | 82.52 | 51 | -0.08 | -0.66 | 1.75% |
| IJS | iShares S&P Small-Cap 600 Value | | 99.74 | 37 | 0.69 | 0.18 | -3.23% |
| IJT | iShares S&P Small-Cap 600 Growth | | 130.21 | 81 | 0.05 | -0.33 | 4.05% |
| XSLV | PowerShares S&P SmallCap Low Volatil ETF | | 43.66 | 48 | 0.72 | -0.23 | -1.11% |
| SBB | ProShares Short SmallCap600 | | 15.97 | 20 | -0.62 | -0.28 | 0.25% |
| SAA | ProShares Ultra SmallCap600 | | 24.16 | 58 | 0.73 | 0.03 | -3.17% |
| SDD | ProShares UltraShort SmallCap600 | | 18.11 | 17 | -2.53 | -1.36 | -1.72% |
| SMLV | SPDR SSGA US Small Cap Low Volatil ETF | | 110.05 | 55 | 0.89 | -0.16 | -2.2% |
| 12Stocks.com: Charts, Trends, Fundamental Data and Performances of SmallCap Stocks | |
|
We now take in-depth look at all SmallCap stocks including charts, multi-period performances and overall trends (as measured by Smart Investing & Trading Score). One can sort SmallCap stocks (click link to choose) by Daily, Weekly and by Year-to-Date performances. Also, one can sort by size of the company or by market capitalization. |
| Select Your Default Chart Type: | |||||
| |||||
| Click on stock symbol or name for detailed view. Click on to add stock symbol to your watchlist and to view watchlist. Quick View: Move mouse or cursor over "Daily" to quickly view daily technical stock chart and over "Weekly" to view weekly technical stock chart. | |||||

 | VRTS Virtus Investment Partners, Inc. |
| Sector: Financials | |
| SubSector: Asset Management | |
| MarketCap: 601.303 Millions | |
| Recent Price: 228.59 Smart Investing & Trading Score: 50 | |
| Day Percent Change: 0.84% Day Change: 1.90 | |
| Week Change: -1.74% Year-to-date Change: -5.5% | |
| VRTS Links: Profile News Message Board | |
| Charts:- Daily , Weekly | |
| Add VRTS to Watchlist: View: Get Complete VRTS Trend Analysis ➞ | |
 | ATGE Adtalem Global Education Inc. |
| Sector: Services & Goods | |
| SubSector: Education & Training Services | |
| MarketCap: 1273.86 Millions | |
| Recent Price: 64.39 Smart Investing & Trading Score: 61 | |
| Day Percent Change: -1.75% Day Change: -1.15 | |
| Week Change: -1.75% Year-to-date Change: 9.2% | |
| ATGE Links: Profile News Message Board | |
| Charts:- Daily , Weekly | |
| Add ATGE to Watchlist: View: Get Complete ATGE Trend Analysis ➞ | |
 | BIRD Allbirds, Inc. |
| Sector: Services & Goods | |
| SubSector: Apparel Retail | |
| MarketCap: 184 Millions | |
| Recent Price: 0.59 Smart Investing & Trading Score: 30 | |
| Day Percent Change: 1.90% Day Change: 0.01 | |
| Week Change: -1.75% Year-to-date Change: -52.1% | |
| BIRD Links: Profile News Message Board | |
| Charts:- Daily , Weekly | |
| Add BIRD to Watchlist: View: Get Complete BIRD Trend Analysis ➞ | |
 | ENVX Enovix Corporation |
| Sector: Industrials | |
| SubSector: Electrical Equipment & Parts | |
| MarketCap: 2740 Millions | |
| Recent Price: 10.62 Smart Investing & Trading Score: 61 | |
| Day Percent Change: -5.01% Day Change: -0.56 | |
| Week Change: -1.76% Year-to-date Change: -15.7% | |
| ENVX Links: Profile News Message Board | |
| Charts:- Daily , Weekly | |
| Add ENVX to Watchlist: View: Get Complete ENVX Trend Analysis ➞ | |
 | TRS TriMas Corporation |
| Sector: Industrials | |
| SubSector: Industrial Equipment & Components | |
| MarketCap: 963.509 Millions | |
| Recent Price: 26.62 Smart Investing & Trading Score: 76 | |
| Day Percent Change: -0.30% Day Change: -0.08 | |
| Week Change: -1.77% Year-to-date Change: 5.1% | |
| TRS Links: Profile News Message Board | |
| Charts:- Daily , Weekly | |
| Add TRS to Watchlist: View: Get Complete TRS Trend Analysis ➞ | |
 | HRMY Harmony Biosciences Holdings, Inc. |
| Sector: Health Care | |
| SubSector: Biotechnology | |
| MarketCap: 24487 Millions | |
| Recent Price: 29.40 Smart Investing & Trading Score: 38 | |
| Day Percent Change: 1.84% Day Change: 0.53 | |
| Week Change: -1.77% Year-to-date Change: -9.0% | |
| HRMY Links: Profile News Message Board | |
| Charts:- Daily , Weekly | |
| Add HRMY to Watchlist: View: Get Complete HRMY Trend Analysis ➞ | |
 | GCBC Greene County Bancorp, Inc. |
| Sector: Financials | |
| SubSector: Savings & Loans | |
| MarketCap: 314.83 Millions | |
| Recent Price: 31.43 Smart Investing & Trading Score: 73 | |
| Day Percent Change: 1.22% Day Change: 0.38 | |
| Week Change: -1.78% Year-to-date Change: 11.5% | |
| GCBC Links: Profile News Message Board | |
| Charts:- Daily , Weekly | |
| Add GCBC to Watchlist: View: Get Complete GCBC Trend Analysis ➞ | |
 | HRI Herc Holdings Inc. |
| Sector: Transports | |
| SubSector: Rental & Leasing Services | |
| MarketCap: 469.344 Millions | |
| Recent Price: 145.07 Smart Investing & Trading Score: 32 | |
| Day Percent Change: 2.47% Day Change: 3.49 | |
| Week Change: -1.78% Year-to-date Change: -2.6% | |
| HRI Links: Profile News Message Board | |
| Charts:- Daily , Weekly | |
| Add HRI to Watchlist: View: Get Complete HRI Trend Analysis ➞ | |
 | SHCR Sharecare, Inc. |
| Sector: Health Care | |
| SubSector: Health Information Services | |
| MarketCap: 640 Millions | |
| Recent Price: 0.81 Smart Investing & Trading Score: 30 | |
| Day Percent Change: -3.69% Day Change: -0.03 | |
| Week Change: -1.8% Year-to-date Change: -25.0% | |
| SHCR Links: Profile News Message Board | |
| Charts:- Daily , Weekly | |
| Add SHCR to Watchlist: View: Get Complete SHCR Trend Analysis ➞ | |
 | CFFI C&F Financial Corporation |
| Sector: Financials | |
| SubSector: Regional - Mid-Atlantic Banks | |
| MarketCap: 145.559 Millions | |
| Recent Price: 43.84 Smart Investing & Trading Score: 32 | |
| Day Percent Change: 0.09% Day Change: 0.04 | |
| Week Change: -1.81% Year-to-date Change: -35.7% | |
| CFFI Links: Profile News Message Board | |
| Charts:- Daily , Weekly | |
| Add CFFI to Watchlist: View: Get Complete CFFI Trend Analysis ➞ | |
 | ITRI Itron, Inc. |
| Sector: Technology | |
| SubSector: Scientific & Technical Instruments | |
| MarketCap: 2222.23 Millions | |
| Recent Price: 107.55 Smart Investing & Trading Score: 58 | |
| Day Percent Change: -0.62% Day Change: -0.67 | |
| Week Change: -1.82% Year-to-date Change: 42.4% | |
| ITRI Links: Profile News Message Board | |
| Charts:- Daily , Weekly | |
| Add ITRI to Watchlist: View: Get Complete ITRI Trend Analysis ➞ | |
 | CCNE CNB Financial Corporation |
| Sector: Financials | |
| SubSector: Regional - Northeast Banks | |
| MarketCap: 286.599 Millions | |
| Recent Price: 19.40 Smart Investing & Trading Score: 17 | |
| Day Percent Change: 0.10% Day Change: 0.02 | |
| Week Change: -1.82% Year-to-date Change: -14.1% | |
| CCNE Links: Profile News Message Board | |
| Charts:- Daily , Weekly | |
| Add CCNE to Watchlist: View: Get Complete CCNE Trend Analysis ➞ | |
 | CPF Central Pacific Financial Corp. |
| Sector: Financials | |
| SubSector: Regional - Pacific Banks | |
| MarketCap: 407.429 Millions | |
| Recent Price: 20.28 Smart Investing & Trading Score: 46 | |
| Day Percent Change: -0.93% Day Change: -0.19 | |
| Week Change: -1.84% Year-to-date Change: 3.1% | |
| CPF Links: Profile News Message Board | |
| Charts:- Daily , Weekly | |
| Add CPF to Watchlist: View: Get Complete CPF Trend Analysis ➞ | |
 | VRRM Verra Mobility Corporation |
| Sector: Services & Goods | |
| SubSector: Security & Protection Services | |
| MarketCap: 1265.03 Millions | |
| Recent Price: 26.64 Smart Investing & Trading Score: 69 | |
| Day Percent Change: 0.04% Day Change: 0.01 | |
| Week Change: -1.84% Year-to-date Change: 15.7% | |
| VRRM Links: Profile News Message Board | |
| Charts:- Daily , Weekly | |
| Add VRRM to Watchlist: View: Get Complete VRRM Trend Analysis ➞ | |
 | AEIS Advanced Energy Industries, Inc. |
| Sector: Technology | |
| SubSector: Diversified Electronics | |
| MarketCap: 1641.86 Millions | |
| Recent Price: 107.43 Smart Investing & Trading Score: 76 | |
| Day Percent Change: 0.53% Day Change: 0.57 | |
| Week Change: -1.85% Year-to-date Change: -1.4% | |
| AEIS Links: Profile News Message Board | |
| Charts:- Daily , Weekly | |
| Add AEIS to Watchlist: View: Get Complete AEIS Trend Analysis ➞ | |
 | MMI Marcus & Millichap, Inc. |
| Sector: Financials | |
| SubSector: Real Estate Development | |
| MarketCap: 1005.19 Millions | |
| Recent Price: 32.33 Smart Investing & Trading Score: 25 | |
| Day Percent Change: 0.25% Day Change: 0.08 | |
| Week Change: -1.85% Year-to-date Change: -26.0% | |
| MMI Links: Profile News Message Board | |
| Charts:- Daily , Weekly | |
| Add MMI to Watchlist: View: Get Complete MMI Trend Analysis ➞ | |
 | IBOC International Bancshares Corporation |
| Sector: Financials | |
| SubSector: Regional - Southwest Banks | |
| MarketCap: 1159.45 Millions | |
| Recent Price: 56.83 Smart Investing & Trading Score: 53 | |
| Day Percent Change: 0.51% Day Change: 0.29 | |
| Week Change: -1.86% Year-to-date Change: 4.6% | |
| IBOC Links: Profile News Message Board | |
| Charts:- Daily , Weekly | |
| Add IBOC to Watchlist: View: Get Complete IBOC Trend Analysis ➞ | |
 | AVTE Aerovate Therapeutics, Inc. |
| Sector: Health Care | |
| SubSector: Biotechnology | |
| MarketCap: 478 Millions | |
| Recent Price: 17.45 Smart Investing & Trading Score: 32 | |
| Day Percent Change: -1.19% Day Change: -0.21 | |
| Week Change: -1.86% Year-to-date Change: -22.7% | |
| AVTE Links: Profile News Message Board | |
| Charts:- Daily , Weekly | |
| Add AVTE to Watchlist: View: Get Complete AVTE Trend Analysis ➞ | |
 | STC Stewart Information Services Corporation |
| Sector: Financials | |
| SubSector: Property & Casualty Insurance | |
| MarketCap: 629.912 Millions | |
| Recent Price: 63.31 Smart Investing & Trading Score: 35 | |
| Day Percent Change: -0.35% Day Change: -0.22 | |
| Week Change: -1.88% Year-to-date Change: 7.8% | |
| STC Links: Profile News Message Board | |
| Charts:- Daily , Weekly | |
| Add STC to Watchlist: View: Get Complete STC Trend Analysis ➞ | |
 | ORRF Orrstown Financial Services, Inc. |
| Sector: Financials | |
| SubSector: Regional - Northeast Banks | |
| MarketCap: 159.999 Millions | |
| Recent Price: 26.11 Smart Investing & Trading Score: 27 | |
| Day Percent Change: 1.20% Day Change: 0.31 | |
| Week Change: -1.88% Year-to-date Change: -11.5% | |
| ORRF Links: Profile News Message Board | |
| Charts:- Daily , Weekly | |
| Add ORRF to Watchlist: View: Get Complete ORRF Trend Analysis ➞ | |
 | BCOV Brightcove Inc. |
| Sector: Technology | |
| SubSector: Application Software | |
| MarketCap: 266.162 Millions | |
| Recent Price: 2.09 Smart Investing & Trading Score: 42 | |
| Day Percent Change: -0.95% Day Change: -0.02 | |
| Week Change: -1.88% Year-to-date Change: -19.3% | |
| BCOV Links: Profile News Message Board | |
| Charts:- Daily , Weekly | |
| Add BCOV to Watchlist: View: Get Complete BCOV Trend Analysis ➞ | |
 | SPRY ARS Pharmaceuticals, Inc. |
| Sector: Health Care | |
| SubSector: Biotechnology | |
| MarketCap: 632 Millions | |
| Recent Price: 8.88 Smart Investing & Trading Score: 53 | |
| Day Percent Change: -0.34% Day Change: -0.03 | |
| Week Change: -1.88% Year-to-date Change: 56.2% | |
| SPRY Links: Profile News Message Board | |
| Charts:- Daily , Weekly | |
| Add SPRY to Watchlist: View: Get Complete SPRY Trend Analysis ➞ | |
 | EGAN eGain Corporation |
| Sector: Technology | |
| SubSector: Business Software & Services | |
| MarketCap: 201.458 Millions | |
| Recent Price: 6.19 Smart Investing & Trading Score: 57 | |
| Day Percent Change: 4.30% Day Change: 0.26 | |
| Week Change: -1.9% Year-to-date Change: -25.7% | |
| EGAN Links: Profile News Message Board | |
| Charts:- Daily , Weekly | |
| Add EGAN to Watchlist: View: Get Complete EGAN Trend Analysis ➞ | |
 | NNI Nelnet, Inc. |
| Sector: Financials | |
| SubSector: Credit Services | |
| MarketCap: 1664.38 Millions | |
| Recent Price: 103.66 Smart Investing & Trading Score: 51 | |
| Day Percent Change: -0.55% Day Change: -0.57 | |
| Week Change: -1.91% Year-to-date Change: 17.5% | |
| NNI Links: Profile News Message Board | |
| Charts:- Daily , Weekly | |
| Add NNI to Watchlist: View: Get Complete NNI Trend Analysis ➞ | |
 | AVD American Vanguard Corporation |
| Sector: Materials | |
| SubSector: Agricultural Chemicals | |
| MarketCap: 419.329 Millions | |
| Recent Price: 8.69 Smart Investing & Trading Score: 10 | |
| Day Percent Change: 0.35% Day Change: 0.03 | |
| Week Change: -1.92% Year-to-date Change: -20.8% | |
| AVD Links: Profile News Message Board | |
| Charts:- Daily , Weekly | |
| Add AVD to Watchlist: View: Get Complete AVD Trend Analysis ➞ | |
| Too many stocks? View smallcap stocks filtered by marketcap & sector |
| Marketcap: All SmallCap Stocks (default-no microcap), Large, Mid-Range, Small & MicroCap |
| Sector: Tech, Finance, Energy, Staples, Retail, Industrial, Materials, Utilities & Medical |
|
Best Stocks Today 12Stocks.com |
© 2024 12Stocks.com Terms & Conditions Privacy Contact Us
All Information Provided Only For Education And Not To Be Used For Investing or Trading. See Terms & Conditions


One More Thing ... Get Best Stocks Delivered Daily!
Never Ever Miss A Move With Our Top Ten Stocks Lists
Find Best Stocks In Any Market - Bull or Bear Market
Take A Peek At Our Top Ten Stocks Lists: Daily, Weekly, Year-to-Date & Top Trends
Find Best Stocks In Any Market - Bull or Bear Market
Take A Peek At Our Top Ten Stocks Lists: Daily, Weekly, Year-to-Date & Top Trends
Smallcap Stocks With Best Up Trends [0-bearish to 100-bullish]: Ambarella [100], TPI Composites[100], Hallador Energy[100], Aaron s[100], Sportsman s[100], Heron [100], Federal Signal[100], Newpark Resources[100], Infinera [100], CONSOL Energy[100], Clean Energy[100]
Best Smallcap Stocks Year-to-Date:
CareMax [504.12%], Janux [397.91%], Viking [234.74%], Summit [232.76%], Novavax [213.13%], Longboard [208.84%], Avidity Biosciences[197.12%], Stoke [177.95%], Super Micro[175.98%], Sweetgreen [172.12%], NuScale Power[170.7%] Best Smallcap Stocks This Week:
Summit [156.95%], Insmed [150.23%], Forward Air[36.25%], Ikena Oncology[35.11%], Orchestra BioMed[32%], Credo [30.55%], Arcturus [27.58%], Semler Scientific[25.94%], Hallador Energy[25.72%], Foot Locker[25.65%], CommScope Holding[24.14%] Best Smallcap Stocks Daily:
Ambarella [20.60%], Eyenovia [13.48%], Accuray [12.74%], Slair Broadcast[12.08%], TPI Composites[12.07%], Akoustis [12.04%], Emergent BioSolutions[11.98%], Hallador Energy[11.29%], Aaron s[9.99%], Cogint [9.88%], Trinseo S.A[9.43%]