
 Login Sign Up


| |||||
 |  | ||||

| 12Stocks.com Market Intelligence |
Best S&P 500 Stocks
|
On this page, you will find the most comprehensive analysis of S&P 500 stocks and ETFs - from latest trends to performances to charts ➞. First, here are the year-to-date (YTD) performances of the most requested S&P 500 stocks at 12Stocks.com (click stock for review):
| NVIDIA 77% | ||
| Google 23% | ||
| Merck 20% | ||
| Amazon.com 18% | ||
| Caterpillar 16% | ||
| Walmart 14% | ||
| JPMorgan Chase 14% | ||
| Chevron 11% | ||
| Goldman Sachs 11% | ||
| Microsoft 8% | ||
| Johnson & Johnson -7% | ||
| McDonald s -8% | ||
| Starbucks -8% | ||
| Apple -12% | ||
| Gilead -19% | ||
| Boeing -36% | ||
| Intel -37% | ||
| Quick: S&P 500 Stocks Lists: Performances & Trends, S&P 500 Stock Charts
Sort S&P 500 stocks: Daily, Weekly, Year-to-Date, Market Cap & Trends. Filter S&P 500 stocks list by sector: Show all, Tech, Finance, Energy, Staples, Retail, Industrial, Materials, Utilities and HealthCare |
| 12Stocks.com S&P 500 Stocks Performances & Trends Daily Report | |||||||||
|
| 
The overall Smart Investing & Trading Score is 63 (0-bearish to 100-bullish) which puts S&P 500 index in short term neutral to bullish trend. The Smart Investing & Trading Score from previous trading session is 44 and hence an improvement of trend. | ||||||||
Here are the Smart Investing & Trading Scores of the most requested S&P 500 stocks at 12Stocks.com (click stock name for detailed review):
|


| 12Stocks.com: Top Performing S&P 500 Index Stocks | ||||||||||||||||||||||||||||||||||||||||||||||||
 The top performing S&P 500 Index stocks year to date are
Now, more recently, over last week, the top performing S&P 500 Index stocks on the move are


|
||||||||||||||||||||||||||||||||||||||||||||||||
| 12Stocks.com: Investing in S&P 500 Index with Stocks | |
|
The following table helps investors and traders sort through current performance and trends (as measured by Smart Investing & Trading Score) of various
stocks in the S&P 500 Index. Quick View: Move mouse or cursor over stock symbol (ticker) to view short-term technical chart and over stock name to view long term chart. Click on  to add stock symbol to your watchlist and to add stock symbol to your watchlist and  to view watchlist. Click on any ticker or stock name for detailed market intelligence report for that stock. to view watchlist. Click on any ticker or stock name for detailed market intelligence report for that stock. |
12Stocks.com Performance of Stocks in S&P 500 Index
| Ticker | Stock Name | Watchlist | Category | Recent Price | Smart Investing & Trading Score | Change % | YTD Change% |
| TJX | TJX |   | Services & Goods | 96.36 | 83 | -0.06% | 2.72% |
| TMUS | T-Mobile US | | Technology | 163.96 | 83 | -0.05% | 2.26% |
| AVGO | Broadcom | | Technology | 1344.07 | 81 | 3.84% | 20.41% |
| FSLR | First Solar | | Technology | 178.73 | 81 | 2.12% | 3.74% |
| CTRA | Contura | | Materials | 28.40 | 81 | 0.67% | 11.27% |
| FITB | Fifth Third | | Financials | 36.90 | 81 | 0.22% | 6.99% |
| HRL | Hormel Foods | | Consumer Staples | 35.32 | 81 | 0.14% | 10.00% |
| SCHW | Charles Schwab | | Financials | 74.99 | 81 | 0.13% | 9.00% |
| KMB | Kimberly-Clark | | Consumer Staples | 135.24 | 81 | -0.87% | 11.30% |
| WMB | Williams | | Energy | 39.26 | 81 | -0.48% | 12.72% |
| PHM | Pulte | | Industrials | 113.80 | 80 | 2.19% | 10.25% |
| MRNA | Moderna | | Health Care | 107.97 | 80 | 1.66% | 8.57% |
| WELL | Welltower | | Financials | 94.34 | 80 | 0.36% | 4.62% |
| EOG | EOG Resources | | Energy | 135.70 | 80 | 0.25% | 12.20% |
| URI | United Rentals | | Transports | 690.80 | 80 | -0.02% | 20.47% |
| GE | General Electric | | Industrials | 162.35 | 78 | 0.68% | 27.20% |
| AES | AES | | Utilities | 17.21 | 78 | 0.47% | -10.60% |
| UPS | United Parcel | | Transports | 147.59 | 78 | 0.14% | -6.13% |
| KMI | Kinder Morgan | | Energy | 18.68 | 78 | -0.64% | 5.90% |
| PCG | PG&E | | Utilities | 17.03 | 78 | -0.23% | -5.55% |
| NVDA | NVIDIA | | Technology | 877.35 | 76 | 6.18% | 77.16% |
| FANG | Diamondback | | Energy | 207.76 | 76 | 0.32% | 33.97% |
| CNP | CenterPoint | | Utilities | 28.85 | 76 | -1.67% | 0.98% |
| WEC | WEC | | Utilities | 81.49 | 76 | -1.59% | -3.18% |
| SO | Southern | | Utilities | 73.21 | 76 | -1.56% | 4.41% |
| For chart view version of above stock list: Chart View ➞ 0 - 25 , 25 - 50 , 50 - 75 , 75 - 100 , 100 - 125 , 125 - 150 , 150 - 175 , 175 - 200 , 200 - 225 , 225 - 250 , 250 - 275 , 275 - 300 , 300 - 325 , 325 - 350 , 350 - 375 , 375 - 400 , 400 - 425 , 425 - 450 , 450 - 475 , 475 - 500 | ||
 | Click To Change The Sort Order: By Market Cap or Company Size Performance: Year-to-date, Week and Day |  |
|
Get the most comprehensive stock market coverage daily at 12Stocks.com ➞ Best Stocks Today ➞ Best Stocks Weekly ➞ Best Stocks Year-to-Date ➞ Best Stocks Trends ➞  Best Stocks Today 12Stocks.com Best Nasdaq Stocks ➞ Best S&P 500 Stocks ➞ Best Tech Stocks ➞ Best Biotech Stocks ➞ |
| Detailed Overview of S&P 500 Stocks |
| S&P 500 Technical Overview, Leaders & Laggards, Top S&P 500 ETF Funds & Detailed S&P 500 Stocks List, Charts, Trends & More |
| S&P 500: Technical Analysis, Trends & YTD Performance | |
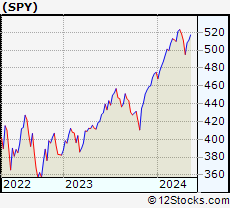
| S&P 500 index as represented by
SPY, an exchange-traded fund [ETF], holds basket of five hundred (mostly largecap) stocks from across all major sectors of the US stock market. The S&P 500 index (contains stocks like Apple and Exxon) is up by 6.93% and is currently outperforming the overall market by 0.79% year-to-date. Below is a quick view of technical charts and trends: | |
 SPY Weekly Chart |
|
| Long Term Trend: Good | |
| Medium Term Trend: Not Good | |
 SPY Daily Chart |
|
| Short Term Trend: Very Good | |
| Overall Trend Score: 63 | |
| YTD Performance: 6.93% | |
| **Trend Scores & Views Are Only For Educational Purposes And Not For Investing | |
| 12Stocks.com: Investing in S&P 500 Index using Exchange Traded Funds | |
|
The following table shows list of key exchange traded funds (ETF) that
help investors track S&P 500 index. The following list also includes leveraged ETF funds that track twice or thrice the daily returns of S&P 500 indices. Short or inverse ETF funds move in the opposite direction to the index they track and are useful during market pullbacks or during bear markets. Quick View: Move mouse or cursor over ETF symbol (ticker) to view short-term technical chart and over ETF name to view long term chart. Click on ticker or stock name for detailed view. Click on to add stock symbol to your watchlist and to view watchlist. |
12Stocks.com List of ETFs that track S&P 500 Index
| Ticker | ETF Name | Watchlist | Recent Price | Smart Investing & Trading Score | Change % | Week % | Year-to-date % |
| SPY | SPDR S&P 500 ETF | | 508.26 | 63 | 0.95 | 2.65 | 6.93% |
| IVV | iShares Core S&P 500 ETF | | 510.77 | 63 | 0.98 | 2.66 | 6.94% |
| VOO | Vanguard 500 ETF | | 467.21 | 63 | 1.00 | 2.66 | 6.96% |
| OEF | iShares S&P 100 | | 241.56 | 63 | 1.35 | 2.93 | 8.13% |
| SSO | ProShares Ultra S&P500 | | 72.71 | 63 | 1.95 | 5.21 | 11.74% |
| UPRO | ProShares UltraPro S&P500 | | 63.82 | 63 | 2.89 | 7.88 | 16.59% |
| SPXL | Direxion Daily S&P500 Bull 3X ETF | | 121.14 | 63 | 2.80 | 7.63 | 16.49% |
| SH | ProShares Short S&P500 | | 12.28 | 42 | -0.89 | -2.46 | -5.47% |
| SDS | ProShares UltraShort S&P500 | | 26.53 | 32 | -1.89 | -4.91 | -11.33% |
| SPXU | ProShares UltraPro Short S&P500 | | 35.50 | 42 | -2.79 | -7.38 | -17.44% |
| SPXS | Direxion Daily S&P 500 Bear 3X ETF | | 9.61 | 25 | -2.73 | -7.24 | -16.8% |
| 12Stocks.com: Charts, Trends, Fundamental Data and Performances of S&P 500 Stocks | |
|
We now take in-depth look at all S&P 500 stocks including charts, multi-period performances and overall trends (as measured by Smart Investing & Trading Score). One can sort S&P 500 stocks (click link to choose) by Daily, Weekly and by Year-to-Date performances. Also, one can sort by size of the company or by market capitalization. |
| Select Your Default Chart Type: | |||||
| |||||
| Click on stock symbol or name for detailed view. Click on to add stock symbol to your watchlist and to view watchlist. Quick View: Move mouse or cursor over "Daily" to quickly view daily technical stock chart and over "Weekly" to view weekly technical stock chart. | |||||

 | TJX The TJX Companies, Inc. |
| Sector: Services & Goods | |
| SubSector: Department Stores | |
| MarketCap: 50656.2 Millions | |
| Recent Price: 96.36 Smart Investing & Trading Score: 83 | |
| Day Percent Change: -0.06% Day Change: -0.06 | |
| Week Change: 3.21% Year-to-date Change: 2.7% | |
| TJX Links: Profile News Message Board | |
| Charts:- Daily , Weekly | |
| Add TJX to Watchlist: View: Get TJX Trend Analysis ➞ | |
 | TMUS T-Mobile US, Inc. |
| Sector: Technology | |
| SubSector: Wireless Communications | |
| MarketCap: 71949 Millions | |
| Recent Price: 163.96 Smart Investing & Trading Score: 83 | |
| Day Percent Change: -0.05% Day Change: -0.09 | |
| Week Change: 1% Year-to-date Change: 2.3% | |
| TMUS Links: Profile News Message Board | |
| Charts:- Daily , Weekly | |
| Add TMUS to Watchlist: View: Get TMUS Trend Analysis ➞ | |
 | AVGO Broadcom Inc. |
| Sector: Technology | |
| SubSector: Semiconductor - Broad Line | |
| MarketCap: 86329.1 Millions | |
| Recent Price: 1344.07 Smart Investing & Trading Score: 81 | |
| Day Percent Change: 3.84% Day Change: 49.65 | |
| Week Change: 11.57% Year-to-date Change: 20.4% | |
| AVGO Links: Profile News Message Board | |
| Charts:- Daily , Weekly | |
| Add AVGO to Watchlist: View: Get AVGO Trend Analysis ➞ | |
 | FSLR First Solar, Inc. |
| Sector: Technology | |
| SubSector: Semiconductor - Specialized | |
| MarketCap: 3617.9 Millions | |
| Recent Price: 178.73 Smart Investing & Trading Score: 81 | |
| Day Percent Change: 2.12% Day Change: 3.71 | |
| Week Change: 2.11% Year-to-date Change: 3.7% | |
| FSLR Links: Profile News Message Board | |
| Charts:- Daily , Weekly | |
| Add FSLR to Watchlist: View: Get FSLR Trend Analysis ➞ | |
 | CTRA Contura Energy, Inc. |
| Sector: Materials | |
| SubSector: Industrial Metals & Minerals | |
| MarketCap: 75.291 Millions | |
| Recent Price: 28.40 Smart Investing & Trading Score: 81 | |
| Day Percent Change: 0.67% Day Change: 0.19 | |
| Week Change: 2.32% Year-to-date Change: 11.3% | |
| CTRA Links: Profile News Message Board | |
| Charts:- Daily , Weekly | |
| Add CTRA to Watchlist: View: Get CTRA Trend Analysis ➞ | |
 | FITB Fifth Third Bancorp |
| Sector: Financials | |
| SubSector: Regional - Midwest Banks | |
| MarketCap: 10197 Millions | |
| Recent Price: 36.90 Smart Investing & Trading Score: 81 | |
| Day Percent Change: 0.22% Day Change: 0.08 | |
| Week Change: 1.79% Year-to-date Change: 7.0% | |
| FITB Links: Profile News Message Board | |
| Charts:- Daily , Weekly | |
| Add FITB to Watchlist: View: Get FITB Trend Analysis ➞ | |
 | HRL Hormel Foods Corporation |
| Sector: Consumer Staples | |
| SubSector: Meat Products | |
| MarketCap: 25590.2 Millions | |
| Recent Price: 35.32 Smart Investing & Trading Score: 81 | |
| Day Percent Change: 0.14% Day Change: 0.05 | |
| Week Change: 1.67% Year-to-date Change: 10.0% | |
| HRL Links: Profile News Message Board | |
| Charts:- Daily , Weekly | |
| Add HRL to Watchlist: View: Get HRL Trend Analysis ➞ | |
 | SCHW The Charles Schwab Corporation |
| Sector: Financials | |
| SubSector: Investment Brokerage - National | |
| MarketCap: 45115.8 Millions | |
| Recent Price: 74.99 Smart Investing & Trading Score: 81 | |
| Day Percent Change: 0.13% Day Change: 0.10 | |
| Week Change: 2.14% Year-to-date Change: 9.0% | |
| SCHW Links: Profile News Message Board | |
| Charts:- Daily , Weekly | |
| Add SCHW to Watchlist: View: Get SCHW Trend Analysis ➞ | |
 | KMB Kimberly-Clark Corporation |
| Sector: Consumer Staples | |
| SubSector: Personal Products | |
| MarketCap: 44300.5 Millions | |
| Recent Price: 135.24 Smart Investing & Trading Score: 81 | |
| Day Percent Change: -0.87% Day Change: -1.19 | |
| Week Change: 6.63% Year-to-date Change: 11.3% | |
| KMB Links: Profile News Message Board | |
| Charts:- Daily , Weekly | |
| Add KMB to Watchlist: View: Get KMB Trend Analysis ➞ | |
 | WMB The Williams Companies, Inc. |
| Sector: Energy | |
| SubSector: Oil & Gas Pipelines | |
| MarketCap: 16851.5 Millions | |
| Recent Price: 39.26 Smart Investing & Trading Score: 81 | |
| Day Percent Change: -0.48% Day Change: -0.19 | |
| Week Change: 1.95% Year-to-date Change: 12.7% | |
| WMB Links: Profile News Message Board | |
| Charts:- Daily , Weekly | |
| Add WMB to Watchlist: View: Get WMB Trend Analysis ➞ | |
 | PHM PulteGroup, Inc. |
| Sector: Industrials | |
| SubSector: Residential Construction | |
| MarketCap: 6186.46 Millions | |
| Recent Price: 113.80 Smart Investing & Trading Score: 80 | |
| Day Percent Change: 2.19% Day Change: 2.44 | |
| Week Change: 7.94% Year-to-date Change: 10.3% | |
| PHM Links: Profile News Message Board | |
| Charts:- Daily , Weekly | |
| Add PHM to Watchlist: View: Get PHM Trend Analysis ➞ | |
 | MRNA Moderna, Inc. |
| Sector: Health Care | |
| SubSector: Biotechnology | |
| MarketCap: 11006.4 Millions | |
| Recent Price: 107.97 Smart Investing & Trading Score: 80 | |
| Day Percent Change: 1.66% Day Change: 1.77 | |
| Week Change: 6.44% Year-to-date Change: 8.6% | |
| MRNA Links: Profile News Message Board | |
| Charts:- Daily , Weekly | |
| Add MRNA to Watchlist: View: Get MRNA Trend Analysis ➞ | |
 | WELL Welltower Inc. |
| Sector: Financials | |
| SubSector: REIT - Healthcare Facilities | |
| MarketCap: 21398.8 Millions | |
| Recent Price: 94.34 Smart Investing & Trading Score: 80 | |
| Day Percent Change: 0.36% Day Change: 0.34 | |
| Week Change: 3.31% Year-to-date Change: 4.6% | |
| WELL Links: Profile News Message Board | |
| Charts:- Daily , Weekly | |
| Add WELL to Watchlist: View: Get WELL Trend Analysis ➞ | |
 | EOG EOG Resources, Inc. |
| Sector: Energy | |
| SubSector: Independent Oil & Gas | |
| MarketCap: 24282.1 Millions | |
| Recent Price: 135.70 Smart Investing & Trading Score: 80 | |
| Day Percent Change: 0.25% Day Change: 0.34 | |
| Week Change: 1.9% Year-to-date Change: 12.2% | |
| EOG Links: Profile News Message Board | |
| Charts:- Daily , Weekly | |
| Add EOG to Watchlist: View: Get EOG Trend Analysis ➞ | |
 | URI United Rentals, Inc. |
| Sector: Transports | |
| SubSector: Rental & Leasing Services | |
| MarketCap: 6246.64 Millions | |
| Recent Price: 690.80 Smart Investing & Trading Score: 80 | |
| Day Percent Change: -0.02% Day Change: -0.12 | |
| Week Change: 9.94% Year-to-date Change: 20.5% | |
| URI Links: Profile News Message Board | |
| Charts:- Daily , Weekly | |
| Add URI to Watchlist: View: Get URI Trend Analysis ➞ | |
 | GE General Electric Company |
| Sector: Industrials | |
| SubSector: Diversified Machinery | |
| MarketCap: 64710.6 Millions | |
| Recent Price: 162.35 Smart Investing & Trading Score: 78 | |
| Day Percent Change: 0.68% Day Change: 1.09 | |
| Week Change: 9.65% Year-to-date Change: 27.2% | |
| GE Links: Profile News Message Board | |
| Charts:- Daily , Weekly | |
| Add GE to Watchlist: View: Get GE Trend Analysis ➞ | |
 | AES The AES Corporation |
| Sector: Utilities | |
| SubSector: Electric Utilities | |
| MarketCap: 9173.44 Millions | |
| Recent Price: 17.21 Smart Investing & Trading Score: 78 | |
| Day Percent Change: 0.47% Day Change: 0.08 | |
| Week Change: 4.94% Year-to-date Change: -10.6% | |
| AES Links: Profile News Message Board | |
| Charts:- Daily , Weekly | |
| Add AES to Watchlist: View: Get AES Trend Analysis ➞ | |
 | UPS United Parcel Service, Inc. |
| Sector: Transports | |
| SubSector: Air Delivery & Freight Services | |
| MarketCap: 81928.9 Millions | |
| Recent Price: 147.59 Smart Investing & Trading Score: 78 | |
| Day Percent Change: 0.14% Day Change: 0.20 | |
| Week Change: 3.38% Year-to-date Change: -6.1% | |
| UPS Links: Profile News Message Board | |
| Charts:- Daily , Weekly | |
| Add UPS to Watchlist: View: Get UPS Trend Analysis ➞ | |
 | KMI Kinder Morgan, Inc. |
| Sector: Energy | |
| SubSector: Oil & Gas Pipelines | |
| MarketCap: 31283.5 Millions | |
| Recent Price: 18.68 Smart Investing & Trading Score: 78 | |
| Day Percent Change: -0.64% Day Change: -0.12 | |
| Week Change: -0.85% Year-to-date Change: 5.9% | |
| KMI Links: Profile News Message Board | |
| Charts:- Daily , Weekly | |
| Add KMI to Watchlist: View: Get KMI Trend Analysis ➞ | |
 | PCG PG&E Corporation |
| Sector: Utilities | |
| SubSector: Electric Utilities | |
| MarketCap: 5078.04 Millions | |
| Recent Price: 17.03 Smart Investing & Trading Score: 78 | |
| Day Percent Change: -0.23% Day Change: -0.04 | |
| Week Change: 1.07% Year-to-date Change: -5.6% | |
| PCG Links: Profile News Message Board | |
| Charts:- Daily , Weekly | |
| Add PCG to Watchlist: View: Get PCG Trend Analysis ➞ | |
 | NVDA NVIDIA Corporation |
| Sector: Technology | |
| SubSector: Semiconductor - Specialized | |
| MarketCap: 143476 Millions | |
| Recent Price: 877.35 Smart Investing & Trading Score: 76 | |
| Day Percent Change: 6.18% Day Change: 51.03 | |
| Week Change: 15.14% Year-to-date Change: 77.2% | |
| NVDA Links: Profile News Message Board | |
| Charts:- Daily , Weekly | |
| Add NVDA to Watchlist: View: Get NVDA Trend Analysis ➞ | |
 | FANG Diamondback Energy, Inc. |
| Sector: Energy | |
| SubSector: Independent Oil & Gas | |
| MarketCap: 3009.13 Millions | |
| Recent Price: 207.76 Smart Investing & Trading Score: 76 | |
| Day Percent Change: 0.32% Day Change: 0.66 | |
| Week Change: 3.5% Year-to-date Change: 34.0% | |
| FANG Links: Profile News Message Board | |
| Charts:- Daily , Weekly | |
| Add FANG to Watchlist: View: Get FANG Trend Analysis ➞ | |
 | CNP CenterPoint Energy, Inc. |
| Sector: Utilities | |
| SubSector: Gas Utilities | |
| MarketCap: 7444.07 Millions | |
| Recent Price: 28.85 Smart Investing & Trading Score: 76 | |
| Day Percent Change: -1.67% Day Change: -0.49 | |
| Week Change: 1.12% Year-to-date Change: 1.0% | |
| CNP Links: Profile News Message Board | |
| Charts:- Daily , Weekly | |
| Add CNP to Watchlist: View: Get CNP Trend Analysis ➞ | |
 | WEC WEC Energy Group, Inc. |
| Sector: Utilities | |
| SubSector: Electric Utilities | |
| MarketCap: 24852 Millions | |
| Recent Price: 81.49 Smart Investing & Trading Score: 76 | |
| Day Percent Change: -1.59% Day Change: -1.32 | |
| Week Change: -0.09% Year-to-date Change: -3.2% | |
| WEC Links: Profile News Message Board | |
| Charts:- Daily , Weekly | |
| Add WEC to Watchlist: View: Get WEC Trend Analysis ➞ | |
 | SO The Southern Company |
| Sector: Utilities | |
| SubSector: Electric Utilities | |
| MarketCap: 54483.6 Millions | |
| Recent Price: 73.21 Smart Investing & Trading Score: 76 | |
| Day Percent Change: -1.56% Day Change: -1.16 | |
| Week Change: 1.47% Year-to-date Change: 4.4% | |
| SO Links: Profile News Message Board | |
| Charts:- Daily , Weekly | |
| Add SO to Watchlist: View: Get SO Trend Analysis ➞ | |
| For tabular summary view of above stock list: Summary View ➞ 0 - 25 , 25 - 50 , 50 - 75 , 75 - 100 , 100 - 125 , 125 - 150 , 150 - 175 , 175 - 200 , 200 - 225 , 225 - 250 , 250 - 275 , 275 - 300 , 300 - 325 , 325 - 350 , 350 - 375 , 375 - 400 , 400 - 425 , 425 - 450 , 450 - 475 , 475 - 500 | ||
| Click To Change The Sort Order: By Market Cap or Company Size Performance: Year-to-date, Week and Day | |
| Select Chart Type: | ||
|
Best Stocks Today 12Stocks.com |
© 2024 12Stocks.com Terms & Conditions Privacy Contact Us
All Information Provided Only For Education And Not To Be Used For Investing or Trading. See Terms & Conditions


One More Thing ... Get Best Stocks Delivered Daily!
Never Ever Miss A Move With Our Top Ten Stocks Lists
Find Best Stocks In Any Market - Bull or Bear Market
Take A Peek At Our Top Ten Stocks Lists: Daily, Weekly, Year-to-Date & Top Trends
Find Best Stocks In Any Market - Bull or Bear Market
Take A Peek At Our Top Ten Stocks Lists: Daily, Weekly, Year-to-Date & Top Trends
S&P 500 Stocks With Best Up Trends [0-bearish to 100-bullish]: ResMed [100], Google [100], Google [100], KLA [100], Teradyne [100], Tractor Supply[100], Carrier Global[100], Chipotle Mexican[100], Analog Devices[100], Colgate-Palmolive [100], Goldman Sachs[100]
Best S&P 500 Stocks Year-to-Date:
NVIDIA [77.16%], Constellation [60.86%], NRG [40.83%], Chipotle Mexican[39.35%], Western Digital[36.26%], Eaton [34.66%], Micron [34.57%], Targa Resources[34.52%], Diamondback [33.97%], Marathon [33.72%], Progressive [30.61%] Best S&P 500 Stocks This Week:
ResMed [21.92%], Teradyne [18.92%], Hasbro [16.65%], NVIDIA [15.14%], Microchip [14.59%], Monolithic Power[14.49%], Tesla [14.44%], Tyler Technologies[14.23%], Wabtec [14%], Globe Life[13.5%], NXP Semiconductors[12.82%] Best S&P 500 Stocks Daily:
ResMed [18.89%], Google [10.22%], Google [9.97%], NVIDIA [6.18%], KLA [4.95%], Teradyne [4.79%], T. Rowe[4.77%], Mohawk Industries[4.70%], Broadcom [3.84%], Enphase [3.80%], L3Harris Technologies[3.46%]