
 Login Sign Up


| |||||
 |  | ||||

| 12Stocks.com Market Intelligence |
Best S&P 500 Stocks
|
On this page, you will find the most comprehensive analysis of S&P 500 stocks and ETFs - from latest trends to performances to charts ➞. First, here are the year-to-date (YTD) performances of the most requested S&P 500 stocks at 12Stocks.com (click stock for review):
| NVIDIA 82% | ||
| Amazon.com 24% | ||
| Google 22% | ||
| Merck 19% | ||
| Caterpillar 16% | ||
| Walmart 15% | ||
| Goldman Sachs 15% | ||
| JPMorgan Chase 13% | ||
| Microsoft 10% | ||
| Chevron 9% | ||
| Johnson & Johnson -5% | ||
| Apple -5% | ||
| McDonald s -10% | ||
| Gilead -19% | ||
| Starbucks -23% | ||
| Boeing -32% | ||
| Intel -41% | ||
| Quick: S&P 500 Stocks Lists: Performances & Trends, S&P 500 Stock Charts
Sort S&P 500 stocks: Daily, Weekly, Year-to-Date, Market Cap & Trends. Filter S&P 500 stocks list by sector: Show all, Tech, Finance, Energy, Staples, Retail, Industrial, Materials, Utilities and HealthCare |
| 12Stocks.com S&P 500 Stocks Performances & Trends Daily Report | |||||||||
|
| 
The overall Smart Investing & Trading Score is 88 (0-bearish to 100-bullish) which puts S&P 500 index in short term bullish trend. The Smart Investing & Trading Score from previous trading session is 95 and hence a deterioration of trend. | ||||||||
Here are the Smart Investing & Trading Scores of the most requested S&P 500 stocks at 12Stocks.com (click stock name for detailed review):
|


| 12Stocks.com: Top Performing S&P 500 Index Stocks | ||||||||||||||||||||||||||||||||||||||||||||||||
 The top performing S&P 500 Index stocks year to date are
Now, more recently, over last week, the top performing S&P 500 Index stocks on the move are


|
||||||||||||||||||||||||||||||||||||||||||||||||
| 12Stocks.com: Investing in S&P 500 Index with Stocks | |
|
The following table helps investors and traders sort through current performance and trends (as measured by Smart Investing & Trading Score) of various
stocks in the S&P 500 Index. Quick View: Move mouse or cursor over stock symbol (ticker) to view short-term technical chart and over stock name to view long term chart. Click on  to add stock symbol to your watchlist and to add stock symbol to your watchlist and  to view watchlist. Click on any ticker or stock name for detailed market intelligence report for that stock. to view watchlist. Click on any ticker or stock name for detailed market intelligence report for that stock. |
12Stocks.com Performance of Stocks in S&P 500 Index
| Ticker | Stock Name | Watchlist | Category | Recent Price | Smart Investing & Trading Score | Change % | YTD Change% |
| AWK | American Water |   | Utilities | 132.11 | 95 | 0.22% | 0.09% |
| MCO | Moody s | | Services & Goods | 394.82 | 95 | 0.21% | 1.09% |
| AIG | American | | Financials | 80.44 | 95 | 0.20% | 18.73% |
| BRO | Brown & Brown | | Financials | 85.34 | 95 | 0.12% | 20.01% |
| CTAS | Cintas | | Services & Goods | 693.52 | 95 | 0.11% | 15.08% |
| EVRG | Evergy | | Utilities | 54.52 | 95 | 0.11% | 4.44% |
| GRMN | Garmin | | Technology | 170.03 | 95 | 0.04% | 32.28% |
| SO | Southern | | Utilities | 76.97 | 95 | 0.02% | 9.76% |
| CE | Celanese | | Materials | 162.74 | 95 | 0.01% | 4.74% |
| PODD | Insulet | | Health Care | 179.97 | 95 | -2.34% | -17.06% |
| FIS | Fidelity National | | Technology | 72.98 | 95 | -1.79% | 21.49% |
| VRSK | Verisk Analytics | | Services & Goods | 245.08 | 95 | -0.78% | 2.60% |
| COST | Costco Wholesale | | Services & Goods | 768.37 | 95 | -0.38% | 16.40% |
| ECL | Ecolab | | Materials | 232.25 | 95 | -0.29% | 17.09% |
| APD | Air Products | | Materials | 248.31 | 95 | -0.14% | -9.31% |
| GD | General Dynamics | | Industrials | 293.08 | 95 | -0.10% | 12.87% |
| EXC | Exelon | | Utilities | 37.88 | 95 | -0.09% | 5.50% |
| LHX | L3Harris Technologies | | Technology | 215.74 | 95 | -0.08% | 2.43% |
| EIX | Edison | | Utilities | 73.87 | 95 | -0.03% | 3.33% |
| HBAN | Huntington Bancshares | | Financials | 13.98 | 93 | 0.90% | 9.87% |
| PRU | Prudential Financial | | Financials | 116.43 | 93 | 0.17% | 12.26% |
| STT | State Street | | Financials | 75.36 | 93 | 0.02% | -2.70% |
| NDSN | Nordson | | Industrials | 270.02 | 93 | -0.75% | 2.22% |
| INVH | Invitation Homes | | Financials | 34.97 | 93 | -0.03% | 2.52% |
| XEL | Xcel | | Utilities | 55.03 | 93 | 0.03% | -11.10% |
| For chart view version of above stock list: Chart View ➞ 0 - 25 , 25 - 50 , 50 - 75 , 75 - 100 , 100 - 125 , 125 - 150 , 150 - 175 , 175 - 200 , 200 - 225 , 225 - 250 , 250 - 275 , 275 - 300 , 300 - 325 , 325 - 350 , 350 - 375 , 375 - 400 , 400 - 425 , 425 - 450 , 450 - 475 , 475 - 500 | ||
 | Click To Change The Sort Order: By Market Cap or Company Size Performance: Year-to-date, Week and Day |  |
|
Get the most comprehensive stock market coverage daily at 12Stocks.com ➞ Best Stocks Today ➞ Best Stocks Weekly ➞ Best Stocks Year-to-Date ➞ Best Stocks Trends ➞  Best Stocks Today 12Stocks.com Best Nasdaq Stocks ➞ Best S&P 500 Stocks ➞ Best Tech Stocks ➞ Best Biotech Stocks ➞ |
| Detailed Overview of S&P 500 Stocks |
| S&P 500 Technical Overview, Leaders & Laggards, Top S&P 500 ETF Funds & Detailed S&P 500 Stocks List, Charts, Trends & More |
| S&P 500: Technical Analysis, Trends & YTD Performance | |
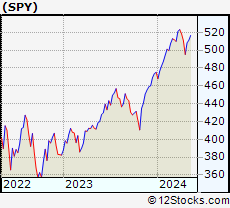
| S&P 500 index as represented by
SPY, an exchange-traded fund [ETF], holds basket of five hundred (mostly largecap) stocks from across all major sectors of the US stock market. The S&P 500 index (contains stocks like Apple and Exxon) is up by 8.8% and is currently outperforming the overall market by 0.71% year-to-date. Below is a quick view of technical charts and trends: | |
 SPY Weekly Chart |
|
| Long Term Trend: Good | |
| Medium Term Trend: Very Good | |
 SPY Daily Chart |
|
| Short Term Trend: Very Good | |
| Overall Trend Score: 88 | |
| YTD Performance: 8.8% | |
| **Trend Scores & Views Are Only For Educational Purposes And Not For Investing | |
| 12Stocks.com: Investing in S&P 500 Index using Exchange Traded Funds | |
|
The following table shows list of key exchange traded funds (ETF) that
help investors track S&P 500 index. The following list also includes leveraged ETF funds that track twice or thrice the daily returns of S&P 500 indices. Short or inverse ETF funds move in the opposite direction to the index they track and are useful during market pullbacks or during bear markets. Quick View: Move mouse or cursor over ETF symbol (ticker) to view short-term technical chart and over ETF name to view long term chart. Click on ticker or stock name for detailed view. Click on to add stock symbol to your watchlist and to view watchlist. |
12Stocks.com List of ETFs that track S&P 500 Index
| Ticker | ETF Name | Watchlist | Recent Price | Smart Investing & Trading Score | Change % | Week % | Year-to-date % |
| SPY | SPDR S&P 500 ETF | | 517.12 | 88 | 0.00 | 1.14 | 8.8% |
| IVV | iShares Core S&P 500 ETF | | 519.01 | 88 | -0.16 | 1.01 | 8.66% |
| VOO | Vanguard 500 ETF | | 474.53 | 88 | -0.18 | 0.97 | 8.64% |
| OEF | iShares S&P 100 | | 246.70 | 88 | 0.11 | 1.21 | 10.43% |
| SSO | ProShares Ultra S&P500 | | 75.14 | 88 | 0.05 | 2.29 | 15.48% |
| UPRO | ProShares UltraPro S&P500 | | 66.84 | 88 | -0.07 | 3.32 | 22.1% |
| SPXL | Direxion Daily S&P500 Bull 3X ETF | | 126.32 | 88 | -0.61 | 2.82 | 21.47% |
| SH | ProShares Short S&P500 | | 12.10 | 22 | 0.04 | -1.1 | -6.89% |
| SDS | ProShares UltraShort S&P500 | | 25.65 | 12 | -0.04 | -2.29 | -14.27% |
| SPXU | ProShares UltraPro Short S&P500 | | 33.78 | 12 | 0.15 | -3.18 | -21.44% |
| SPXS | Direxion Daily S&P 500 Bear 3X ETF | | 9.18 | 12 | 0.49 | -3.01 | -20.56% |
| 12Stocks.com: Charts, Trends, Fundamental Data and Performances of S&P 500 Stocks | |
|
We now take in-depth look at all S&P 500 stocks including charts, multi-period performances and overall trends (as measured by Smart Investing & Trading Score). One can sort S&P 500 stocks (click link to choose) by Daily, Weekly and by Year-to-Date performances. Also, one can sort by size of the company or by market capitalization. |
| Select Your Default Chart Type: | |||||
| |||||
| Click on stock symbol or name for detailed view. Click on to add stock symbol to your watchlist and to view watchlist. Quick View: Move mouse or cursor over "Daily" to quickly view daily technical stock chart and over "Weekly" to view weekly technical stock chart. | |||||

 | AWK American Water Works Company, Inc. |
| Sector: Utilities | |
| SubSector: Water Utilities | |
| MarketCap: 20029.2 Millions | |
| Recent Price: 132.11 Smart Investing & Trading Score: 95 | |
| Day Percent Change: 0.22% Day Change: 0.29 | |
| Week Change: 2.61% Year-to-date Change: 0.1% | |
| AWK Links: Profile News Message Board | |
| Charts:- Daily , Weekly | |
| Add AWK to Watchlist: View: Get AWK Trend Analysis ➞ | |
 | MCO Moody s Corporation |
| Sector: Services & Goods | |
| SubSector: Business Services | |
| MarketCap: 35998.5 Millions | |
| Recent Price: 394.82 Smart Investing & Trading Score: 95 | |
| Day Percent Change: 0.21% Day Change: 0.84 | |
| Week Change: 3.75% Year-to-date Change: 1.1% | |
| MCO Links: Profile News Message Board | |
| Charts:- Daily , Weekly | |
| Add MCO to Watchlist: View: Get MCO Trend Analysis ➞ | |
 | AIG American International Group, Inc. |
| Sector: Financials | |
| SubSector: Property & Casualty Insurance | |
| MarketCap: 21219 Millions | |
| Recent Price: 80.44 Smart Investing & Trading Score: 95 | |
| Day Percent Change: 0.20% Day Change: 0.16 | |
| Week Change: 2.5% Year-to-date Change: 18.7% | |
| AIG Links: Profile News Message Board | |
| Charts:- Daily , Weekly | |
| Add AIG to Watchlist: View: Get AIG Trend Analysis ➞ | |
 | BRO Brown & Brown, Inc. |
| Sector: Financials | |
| SubSector: Insurance Brokers | |
| MarketCap: 10475.7 Millions | |
| Recent Price: 85.34 Smart Investing & Trading Score: 95 | |
| Day Percent Change: 0.12% Day Change: 0.10 | |
| Week Change: 2.2% Year-to-date Change: 20.0% | |
| BRO Links: Profile News Message Board | |
| Charts:- Daily , Weekly | |
| Add BRO to Watchlist: View: Get BRO Trend Analysis ➞ | |
 | CTAS Cintas Corporation |
| Sector: Services & Goods | |
| SubSector: Business Services | |
| MarketCap: 20154.6 Millions | |
| Recent Price: 693.52 Smart Investing & Trading Score: 95 | |
| Day Percent Change: 0.11% Day Change: 0.75 | |
| Week Change: 2.89% Year-to-date Change: 15.1% | |
| CTAS Links: Profile News Message Board | |
| Charts:- Daily , Weekly | |
| Add CTAS to Watchlist: View: Get CTAS Trend Analysis ➞ | |
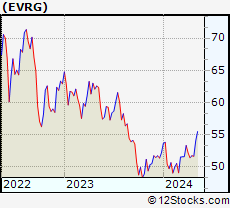 | EVRG Evergy, Inc. |
| Sector: Utilities | |
| SubSector: Electric Utilities | |
| MarketCap: 11914.8 Millions | |
| Recent Price: 54.52 Smart Investing & Trading Score: 95 | |
| Day Percent Change: 0.11% Day Change: 0.06 | |
| Week Change: 0.78% Year-to-date Change: 4.4% | |
| EVRG Links: Profile News Message Board | |
| Charts:- Daily , Weekly | |
| Add EVRG to Watchlist: View: Get EVRG Trend Analysis ➞ | |
 | GRMN Garmin Ltd. |
| Sector: Technology | |
| SubSector: Scientific & Technical Instruments | |
| MarketCap: 13909.3 Millions | |
| Recent Price: 170.03 Smart Investing & Trading Score: 95 | |
| Day Percent Change: 0.04% Day Change: 0.07 | |
| Week Change: 2.45% Year-to-date Change: 32.3% | |
| GRMN Links: Profile News Message Board | |
| Charts:- Daily , Weekly | |
| Add GRMN to Watchlist: View: Get GRMN Trend Analysis ➞ | |
 | SO The Southern Company |
| Sector: Utilities | |
| SubSector: Electric Utilities | |
| MarketCap: 54483.6 Millions | |
| Recent Price: 76.97 Smart Investing & Trading Score: 95 | |
| Day Percent Change: 0.02% Day Change: 0.02 | |
| Week Change: 1.47% Year-to-date Change: 9.8% | |
| SO Links: Profile News Message Board | |
| Charts:- Daily , Weekly | |
| Add SO to Watchlist: View: Get SO Trend Analysis ➞ | |
 | CE Celanese Corporation |
| Sector: Materials | |
| SubSector: Chemicals - Major Diversified | |
| MarketCap: 8521.06 Millions | |
| Recent Price: 162.74 Smart Investing & Trading Score: 95 | |
| Day Percent Change: 0.01% Day Change: 0.01 | |
| Week Change: 3.54% Year-to-date Change: 4.7% | |
| CE Links: Profile News Message Board | |
| Charts:- Daily , Weekly | |
| Add CE to Watchlist: View: Get CE Trend Analysis ➞ | |
 | PODD Insulet Corporation |
| Sector: Health Care | |
| SubSector: Medical Instruments & Supplies | |
| MarketCap: 9313.2 Millions | |
| Recent Price: 179.97 Smart Investing & Trading Score: 95 | |
| Day Percent Change: -2.34% Day Change: -4.31 | |
| Week Change: 3.18% Year-to-date Change: -17.1% | |
| PODD Links: Profile News Message Board | |
| Charts:- Daily , Weekly | |
| Add PODD to Watchlist: View: Get PODD Trend Analysis ➞ | |
 | FIS Fidelity National Information Services, Inc. |
| Sector: Technology | |
| SubSector: Information Technology Services | |
| MarketCap: 71126.8 Millions | |
| Recent Price: 72.98 Smart Investing & Trading Score: 95 | |
| Day Percent Change: -1.79% Day Change: -1.33 | |
| Week Change: 3.2% Year-to-date Change: 21.5% | |
| FIS Links: Profile News Message Board | |
| Charts:- Daily , Weekly | |
| Add FIS to Watchlist: View: Get FIS Trend Analysis ➞ | |
 | VRSK Verisk Analytics, Inc. |
| Sector: Services & Goods | |
| SubSector: Business Services | |
| MarketCap: 22033.2 Millions | |
| Recent Price: 245.08 Smart Investing & Trading Score: 95 | |
| Day Percent Change: -0.78% Day Change: -1.92 | |
| Week Change: 3.27% Year-to-date Change: 2.6% | |
| VRSK Links: Profile News Message Board | |
| Charts:- Daily , Weekly | |
| Add VRSK to Watchlist: View: Get VRSK Trend Analysis ➞ | |
 | COST Costco Wholesale Corporation |
| Sector: Services & Goods | |
| SubSector: Discount, Variety Stores | |
| MarketCap: 136355 Millions | |
| Recent Price: 768.37 Smart Investing & Trading Score: 95 | |
| Day Percent Change: -0.38% Day Change: -2.94 | |
| Week Change: 3.29% Year-to-date Change: 16.4% | |
| COST Links: Profile News Message Board | |
| Charts:- Daily , Weekly | |
| Add COST to Watchlist: View: Get COST Trend Analysis ➞ | |
 | ECL Ecolab Inc. |
| Sector: Materials | |
| SubSector: Specialty Chemicals | |
| MarketCap: 46215.9 Millions | |
| Recent Price: 232.25 Smart Investing & Trading Score: 95 | |
| Day Percent Change: -0.29% Day Change: -0.67 | |
| Week Change: 2.09% Year-to-date Change: 17.1% | |
| ECL Links: Profile News Message Board | |
| Charts:- Daily , Weekly | |
| Add ECL to Watchlist: View: Get ECL Trend Analysis ➞ | |
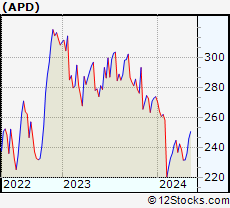 | APD Air Products and Chemicals, Inc. |
| Sector: Materials | |
| SubSector: Chemicals - Major Diversified | |
| MarketCap: 46203.6 Millions | |
| Recent Price: 248.31 Smart Investing & Trading Score: 95 | |
| Day Percent Change: -0.14% Day Change: -0.34 | |
| Week Change: 0.99% Year-to-date Change: -9.3% | |
| APD Links: Profile News Message Board | |
| Charts:- Daily , Weekly | |
| Add APD to Watchlist: View: Get APD Trend Analysis ➞ | |
 | GD General Dynamics Corporation |
| Sector: Industrials | |
| SubSector: Aerospace/Defense Products & Services | |
| MarketCap: 37063.8 Millions | |
| Recent Price: 293.08 Smart Investing & Trading Score: 95 | |
| Day Percent Change: -0.10% Day Change: -0.29 | |
| Week Change: 1.71% Year-to-date Change: 12.9% | |
| GD Links: Profile News Message Board | |
| Charts:- Daily , Weekly | |
| Add GD to Watchlist: View: Get GD Trend Analysis ➞ | |
 | EXC Exelon Corporation |
| Sector: Utilities | |
| SubSector: Diversified Utilities | |
| MarketCap: 34091.9 Millions | |
| Recent Price: 37.88 Smart Investing & Trading Score: 95 | |
| Day Percent Change: -0.09% Day Change: -0.03 | |
| Week Change: 1.24% Year-to-date Change: 5.5% | |
| EXC Links: Profile News Message Board | |
| Charts:- Daily , Weekly | |
| Add EXC to Watchlist: View: Get EXC Trend Analysis ➞ | |
 | LHX L3Harris Technologies, Inc. |
| Sector: Technology | |
| SubSector: Communication Equipment | |
| MarketCap: 37906.1 Millions | |
| Recent Price: 215.74 Smart Investing & Trading Score: 95 | |
| Day Percent Change: -0.08% Day Change: -0.17 | |
| Week Change: 1.65% Year-to-date Change: 2.4% | |
| LHX Links: Profile News Message Board | |
| Charts:- Daily , Weekly | |
| Add LHX to Watchlist: View: Get LHX Trend Analysis ➞ | |
 | EIX Edison International |
| Sector: Utilities | |
| SubSector: Electric Utilities | |
| MarketCap: 19358.1 Millions | |
| Recent Price: 73.87 Smart Investing & Trading Score: 95 | |
| Day Percent Change: -0.03% Day Change: -0.02 | |
| Week Change: 2.12% Year-to-date Change: 3.3% | |
| EIX Links: Profile News Message Board | |
| Charts:- Daily , Weekly | |
| Add EIX to Watchlist: View: Get EIX Trend Analysis ➞ | |
 | HBAN Huntington Bancshares Incorporated |
| Sector: Financials | |
| SubSector: Regional - Midwest Banks | |
| MarketCap: 8468.1 Millions | |
| Recent Price: 13.98 Smart Investing & Trading Score: 93 | |
| Day Percent Change: 0.90% Day Change: 0.13 | |
| Week Change: 1.27% Year-to-date Change: 9.9% | |
| HBAN Links: Profile News Message Board | |
| Charts:- Daily , Weekly | |
| Add HBAN to Watchlist: View: Get HBAN Trend Analysis ➞ | |
 | PRU Prudential Financial, Inc. |
| Sector: Financials | |
| SubSector: Life Insurance | |
| MarketCap: 21001.6 Millions | |
| Recent Price: 116.43 Smart Investing & Trading Score: 93 | |
| Day Percent Change: 0.17% Day Change: 0.20 | |
| Week Change: 3.71% Year-to-date Change: 12.3% | |
| PRU Links: Profile News Message Board | |
| Charts:- Daily , Weekly | |
| Add PRU to Watchlist: View: Get PRU Trend Analysis ➞ | |
 | STT State Street Corporation |
| Sector: Financials | |
| SubSector: Asset Management | |
| MarketCap: 18623 Millions | |
| Recent Price: 75.36 Smart Investing & Trading Score: 93 | |
| Day Percent Change: 0.02% Day Change: 0.02 | |
| Week Change: 1.31% Year-to-date Change: -2.7% | |
| STT Links: Profile News Message Board | |
| Charts:- Daily , Weekly | |
| Add STT to Watchlist: View: Get STT Trend Analysis ➞ | |
 | NDSN Nordson Corporation |
| Sector: Industrials | |
| SubSector: Diversified Machinery | |
| MarketCap: 7117.56 Millions | |
| Recent Price: 270.02 Smart Investing & Trading Score: 93 | |
| Day Percent Change: -0.75% Day Change: -2.04 | |
| Week Change: 1.66% Year-to-date Change: 2.2% | |
| NDSN Links: Profile News Message Board | |
| Charts:- Daily , Weekly | |
| Add NDSN to Watchlist: View: Get NDSN Trend Analysis ➞ | |
 | INVH Invitation Homes Inc. |
| Sector: Financials | |
| SubSector: Real Estate Development | |
| MarketCap: 9782.89 Millions | |
| Recent Price: 34.97 Smart Investing & Trading Score: 93 | |
| Day Percent Change: -0.03% Day Change: -0.01 | |
| Week Change: 1.69% Year-to-date Change: 2.5% | |
| INVH Links: Profile News Message Board | |
| Charts:- Daily , Weekly | |
| Add INVH to Watchlist: View: Get INVH Trend Analysis ➞ | |
 | XEL Xcel Energy Inc. |
| Sector: Utilities | |
| SubSector: Electric Utilities | |
| MarketCap: 28960.8 Millions | |
| Recent Price: 55.03 Smart Investing & Trading Score: 93 | |
| Day Percent Change: 0.03% Day Change: 0.01 | |
| Week Change: 1.45% Year-to-date Change: -11.1% | |
| XEL Links: Profile News Message Board | |
| Charts:- Daily , Weekly | |
| Add XEL to Watchlist: View: Get XEL Trend Analysis ➞ | |
| For tabular summary view of above stock list: Summary View ➞ 0 - 25 , 25 - 50 , 50 - 75 , 75 - 100 , 100 - 125 , 125 - 150 , 150 - 175 , 175 - 200 , 200 - 225 , 225 - 250 , 250 - 275 , 275 - 300 , 300 - 325 , 325 - 350 , 350 - 375 , 375 - 400 , 400 - 425 , 425 - 450 , 450 - 475 , 475 - 500 | ||
| Click To Change The Sort Order: By Market Cap or Company Size Performance: Year-to-date, Week and Day | |
| Select Chart Type: | ||
|
Best Stocks Today 12Stocks.com |
© 2024 12Stocks.com Terms & Conditions Privacy Contact Us
All Information Provided Only For Education And Not To Be Used For Investing or Trading. See Terms & Conditions


One More Thing ... Get Best Stocks Delivered Daily!
Never Ever Miss A Move With Our Top Ten Stocks Lists
Find Best Stocks In Any Market - Bull or Bear Market
Take A Peek At Our Top Ten Stocks Lists: Daily, Weekly, Year-to-Date & Top Trends
Find Best Stocks In Any Market - Bull or Bear Market
Take A Peek At Our Top Ten Stocks Lists: Daily, Weekly, Year-to-Date & Top Trends
S&P 500 Stocks With Best Up Trends [0-bearish to 100-bullish]: Flavors[100], Kenvue [100], Fox [100], HP [100], Twenty-First Century[100], M&T Bank[100], LyondellBasell Industries[100], Arch Capital[100], Sempra [100], NetApp [100], Agilent Technologies[100]
Best S&P 500 Stocks Year-to-Date:
NVIDIA [82.42%], Constellation [74.89%], NRG [47.83%], Micron [40.24%], Chipotle Mexican[40.11%], Eaton [37.91%], Western Digital[37.16%], Progressive [36.45%], Meta Platforms[33.86%], Leidos Holdings[33.78%], Arch Capital[33.71%] Best S&P 500 Stocks This Week:
Globe Life[12.71%], Flavors[11.87%], Henry Schein[7.53%], Paper[7.17%], FMC [7.03%], Kenvue [6.88%], Arista Networks[6.55%], Netflix [6.3%], Vertex [5.87%], Charter [5.66%], Eli Lilly[5.39%] Best S&P 500 Stocks Daily:
Arista Networks[6.71%], Charter [4.85%], NRG [4.13%], Vertex [3.51%], Comcast [3.20%], Emerson Electric[2.93%], Flavors[2.75%], Globe Life[2.64%], Henry Schein[2.37%], Norwegian Cruise[2.31%], Kenvue [2.19%]