
 Login Sign Up


| |||||
 |  | ||||

| 12Stocks.com Market Intelligence |
Best S&P 500 Stocks
|
On this page, you will find the most comprehensive analysis of S&P 500 stocks and ETFs - from latest trends to performances to charts ➞. First, here are the year-to-date (YTD) performances of the most requested S&P 500 stocks at 12Stocks.com (click stock for review):
| NVIDIA 61% | ||
| Caterpillar 21% | ||
| Amazon.com 17% | ||
| Merck 16% | ||
| Walmart 14% | ||
| Google 12% | ||
| JPMorgan Chase 11% | ||
| Chevron 9% | ||
| Goldman Sachs 8% | ||
| Microsoft 7% | ||
| Johnson & Johnson -5% | ||
| McDonald s -7% | ||
| Starbucks -8% | ||
| Apple -14% | ||
| Gilead -17% | ||
| Intel -32% | ||
| Boeing -35% | ||
| Quick: S&P 500 Stocks Lists: Performances & Trends, S&P 500 Stock Charts
Sort S&P 500 stocks: Daily, Weekly, Year-to-Date, Market Cap & Trends. Filter S&P 500 stocks list by sector: Show all, Tech, Finance, Energy, Staples, Retail, Industrial, Materials, Utilities and HealthCare |
| 12Stocks.com S&P 500 Stocks Performances & Trends Daily Report | |||||||||
|
| 
The overall Smart Investing & Trading Score is 51 (0-bearish to 100-bullish) which puts S&P 500 index in short term neutral trend. The Smart Investing & Trading Score from previous trading session is 26 and hence an improvement of trend. | ||||||||
Here are the Smart Investing & Trading Scores of the most requested S&P 500 stocks at 12Stocks.com (click stock name for detailed review):
|


| 12Stocks.com: Top Performing S&P 500 Index Stocks | ||||||||||||||||||||||||||||||||||||||||||||||||
 The top performing S&P 500 Index stocks year to date are
Now, more recently, over last week, the top performing S&P 500 Index stocks on the move are


|
||||||||||||||||||||||||||||||||||||||||||||||||
| 12Stocks.com: Investing in S&P 500 Index with Stocks | |
|
The following table helps investors and traders sort through current performance and trends (as measured by Smart Investing & Trading Score) of various
stocks in the S&P 500 Index. Quick View: Move mouse or cursor over stock symbol (ticker) to view short-term technical chart and over stock name to view long term chart. Click on  to add stock symbol to your watchlist and to add stock symbol to your watchlist and  to view watchlist. Click on any ticker or stock name for detailed market intelligence report for that stock. to view watchlist. Click on any ticker or stock name for detailed market intelligence report for that stock. |
12Stocks.com Performance of Stocks in S&P 500 Index
| Ticker | Stock Name | Watchlist | Category | Recent Price | Smart Investing & Trading Score | Change % | YTD Change% |
| CARR | Carrier Global |   | Industrials | 53.62 | 17 | -0.70% | -6.67% |
| HPQ | HP | | Technology | 27.70 | 17 | -0.40% | -7.94% |
| ROL | Rollins | | Services & Goods | 42.46 | 17 | -0.12% | -2.77% |
| SNA | Snap-on | | Industrials | 268.56 | 17 | -0.09% | -7.02% |
| JNPR | Juniper Networks | | Technology | 36.11 | 15 | 0.14% | 22.49% |
| MTCH | Match | | Technology | 31.96 | 15 | -0.68% | -12.44% |
| MPWR | Monolithic Power | | Technology | 600.63 | 13 | 1.54% | -4.78% |
| AMD | Advanced Micro | | Technology | 148.64 | 10 | 1.36% | 0.83% |
| NOW | ServiceNow | | Technology | 721.95 | 10 | 1.13% | 2.19% |
| SNPS | Synopsys | | Technology | 515.49 | 10 | 0.94% | 0.11% |
| ISRG | Intuitive Surgical | | Health Care | 368.93 | 10 | 0.71% | 9.36% |
| SYK | Stryker | | Health Care | 327.68 | 10 | 0.69% | 9.42% |
| INTC | Intel | | Technology | 34.41 | 10 | 0.61% | -31.52% |
| IT | Gartner | | Technology | 443.06 | 10 | 0.61% | -1.78% |
| PLD | Prologis | | Financials | 104.08 | 10 | 0.57% | -21.92% |
| EPAM | EPAM Systems | | Technology | 246.95 | 10 | 0.40% | -16.95% |
| EXR | Extra Space | | Financials | 132.74 | 10 | 0.21% | -17.21% |
| PPG | PPG Industries | | Materials | 131.16 | 10 | 0.20% | -12.30% |
| BIO | Bio-Rad | | Health Care | 280.13 | 10 | 0.14% | -13.24% |
| IP | Paper | | Consumer Staples | 34.76 | 10 | -1.72% | -3.85% |
| INCY | Incyte | | Health Care | 51.92 | 10 | -0.82% | -17.31% |
| KMX | CarMax | | Services & Goods | 67.88 | 10 | -0.67% | -11.55% |
| ZTS | Zoetis | | Health Care | 145.54 | 10 | -0.66% | -26.26% |
| DLTR | Dollar Tree | | Services & Goods | 121.69 | 10 | -0.28% | -14.33% |
| KEYS | Keysight Technologies | | Technology | 144.74 | 10 | -0.26% | -9.02% |
| For chart view version of above stock list: Chart View ➞ 0 - 25 , 25 - 50 , 50 - 75 , 75 - 100 , 100 - 125 , 125 - 150 , 150 - 175 , 175 - 200 , 200 - 225 , 225 - 250 , 250 - 275 , 275 - 300 , 300 - 325 , 325 - 350 , 350 - 375 , 375 - 400 , 400 - 425 , 425 - 450 , 450 - 475 , 475 - 500 | ||
 | Click To Change The Sort Order: By Market Cap or Company Size Performance: Year-to-date, Week and Day |  |
|
Get the most comprehensive stock market coverage daily at 12Stocks.com ➞ Best Stocks Today ➞ Best Stocks Weekly ➞ Best Stocks Year-to-Date ➞ Best Stocks Trends ➞  Best Stocks Today 12Stocks.com Best Nasdaq Stocks ➞ Best S&P 500 Stocks ➞ Best Tech Stocks ➞ Best Biotech Stocks ➞ |
| Detailed Overview of S&P 500 Stocks |
| S&P 500 Technical Overview, Leaders & Laggards, Top S&P 500 ETF Funds & Detailed S&P 500 Stocks List, Charts, Trends & More |
| S&P 500: Technical Analysis, Trends & YTD Performance | |
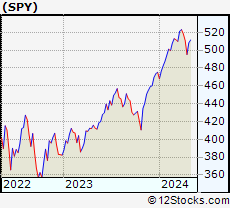
| S&P 500 index as represented by
SPY, an exchange-traded fund [ETF], holds basket of five hundred (mostly largecap) stocks from across all major sectors of the US stock market. The S&P 500 index (contains stocks like Apple and Exxon) is up by 5.14% and is currently outperforming the overall market by 0.75% year-to-date. Below is a quick view of technical charts and trends: | |
 SPY Weekly Chart |
|
| Long Term Trend: Good | |
| Medium Term Trend: Not Good | |
 SPY Daily Chart |
|
| Short Term Trend: Deteriorating | |
| Overall Trend Score: 51 | |
| YTD Performance: 5.14% | |
| **Trend Scores & Views Are Only For Educational Purposes And Not For Investing | |
| 12Stocks.com: Investing in S&P 500 Index using Exchange Traded Funds | |
|
The following table shows list of key exchange traded funds (ETF) that
help investors track S&P 500 index. The following list also includes leveraged ETF funds that track twice or thrice the daily returns of S&P 500 indices. Short or inverse ETF funds move in the opposite direction to the index they track and are useful during market pullbacks or during bear markets. Quick View: Move mouse or cursor over ETF symbol (ticker) to view short-term technical chart and over ETF name to view long term chart. Click on ticker or stock name for detailed view. Click on to add stock symbol to your watchlist and to view watchlist. |
12Stocks.com List of ETFs that track S&P 500 Index
| Ticker | ETF Name | Watchlist | Recent Price | Smart Investing & Trading Score | Change % | Week % | Year-to-date % |
| SPY | SPDR S&P 500 ETF | | 499.72 | 51 | 0.92 | 0.92 | 5.14% |
| IVV | iShares Core S&P 500 ETF | | 498.19 | 36 | 0.13 | 0.13 | 4.3% |
| VOO | Vanguard 500 ETF | | 455.61 | 36 | 0.11 | 0.11 | 4.31% |
| OEF | iShares S&P 100 | | 236.81 | 51 | 0.91 | 0.91 | 6.01% |
| SSO | ProShares Ultra S&P500 | | 70.33 | 51 | 1.77 | 1.77 | 8.08% |
| UPRO | ProShares UltraPro S&P500 | | 60.75 | 43 | 2.69 | 2.69 | 10.98% |
| SPXL | Direxion Daily S&P500 Bull 3X ETF | | 115.45 | 43 | 2.58 | 2.58 | 11.02% |
| SH | ProShares Short S&P500 | | 12.49 | 50 | -0.79 | -0.79 | -3.85% |
| SDS | ProShares UltraShort S&P500 | | 27.41 | 50 | -1.76 | -1.76 | -8.39% |
| SPXU | ProShares UltraPro Short S&P500 | | 37.34 | 50 | -2.58 | -2.58 | -13.16% |
| SPXS | Direxion Daily S&P 500 Bear 3X ETF | | 10.31 | 64 | -0.48 | -0.48 | -10.74% |
| 12Stocks.com: Charts, Trends, Fundamental Data and Performances of S&P 500 Stocks | |
|
We now take in-depth look at all S&P 500 stocks including charts, multi-period performances and overall trends (as measured by Smart Investing & Trading Score). One can sort S&P 500 stocks (click link to choose) by Daily, Weekly and by Year-to-Date performances. Also, one can sort by size of the company or by market capitalization. |
| Select Your Default Chart Type: | |||||
| |||||
| Click on stock symbol or name for detailed view. Click on to add stock symbol to your watchlist and to view watchlist. Quick View: Move mouse or cursor over "Daily" to quickly view daily technical stock chart and over "Weekly" to view weekly technical stock chart. | |||||

 | CARR Carrier Global Corporation |
| Sector: Industrials | |
| SubSector: Building Products & Equipment | |
| MarketCap: 32547 Millions | |
| Recent Price: 53.62 Smart Investing & Trading Score: 17 | |
| Day Percent Change: -0.70% Day Change: -0.38 | |
| Week Change: -0.7% Year-to-date Change: -6.7% | |
| CARR Links: Profile News Message Board | |
| Charts:- Daily , Weekly | |
| Add CARR to Watchlist: View: Get CARR Trend Analysis ➞ | |
 | HPQ HP Inc. |
| Sector: Technology | |
| SubSector: Diversified Computer Systems | |
| MarketCap: 22107.8 Millions | |
| Recent Price: 27.70 Smart Investing & Trading Score: 17 | |
| Day Percent Change: -0.40% Day Change: -0.11 | |
| Week Change: -0.4% Year-to-date Change: -7.9% | |
| HPQ Links: Profile News Message Board | |
| Charts:- Daily , Weekly | |
| Add HPQ to Watchlist: View: Get HPQ Trend Analysis ➞ | |
 | ROL Rollins, Inc. |
| Sector: Services & Goods | |
| SubSector: Business Services | |
| MarketCap: 12827.4 Millions | |
| Recent Price: 42.46 Smart Investing & Trading Score: 17 | |
| Day Percent Change: -0.12% Day Change: -0.05 | |
| Week Change: -0.12% Year-to-date Change: -2.8% | |
| ROL Links: Profile News Message Board | |
| Charts:- Daily , Weekly | |
| Add ROL to Watchlist: View: Get ROL Trend Analysis ➞ | |
 | SNA Snap-on Incorporated |
| Sector: Industrials | |
| SubSector: Small Tools & Accessories | |
| MarketCap: 5947.26 Millions | |
| Recent Price: 268.56 Smart Investing & Trading Score: 17 | |
| Day Percent Change: -0.09% Day Change: -0.24 | |
| Week Change: -0.09% Year-to-date Change: -7.0% | |
| SNA Links: Profile News Message Board | |
| Charts:- Daily , Weekly | |
| Add SNA to Watchlist: View: Get SNA Trend Analysis ➞ | |
 | JNPR Juniper Networks, Inc. |
| Sector: Technology | |
| SubSector: Communication Equipment | |
| MarketCap: 6161.49 Millions | |
| Recent Price: 36.11 Smart Investing & Trading Score: 15 | |
| Day Percent Change: 0.14% Day Change: 0.05 | |
| Week Change: 0.14% Year-to-date Change: 22.5% | |
| JNPR Links: Profile News Message Board | |
| Charts:- Daily , Weekly | |
| Add JNPR to Watchlist: View: Get JNPR Trend Analysis ➞ | |
 | MTCH Match Group, Inc. |
| Sector: Technology | |
| SubSector: Internet Information Providers | |
| MarketCap: 14655.8 Millions | |
| Recent Price: 31.96 Smart Investing & Trading Score: 15 | |
| Day Percent Change: -0.68% Day Change: -0.22 | |
| Week Change: -0.68% Year-to-date Change: -12.4% | |
| MTCH Links: Profile News Message Board | |
| Charts:- Daily , Weekly | |
| Add MTCH to Watchlist: View: Get MTCH Trend Analysis ➞ | |
 | MPWR Monolithic Power Systems, Inc. |
| Sector: Technology | |
| SubSector: Semiconductor - Specialized | |
| MarketCap: 6436.4 Millions | |
| Recent Price: 600.63 Smart Investing & Trading Score: 13 | |
| Day Percent Change: 1.54% Day Change: 9.11 | |
| Week Change: 1.54% Year-to-date Change: -4.8% | |
| MPWR Links: Profile News Message Board | |
| Charts:- Daily , Weekly | |
| Add MPWR to Watchlist: View: Get MPWR Trend Analysis ➞ | |
 | AMD Advanced Micro Devices, Inc. |
| Sector: Technology | |
| SubSector: Semiconductor - Broad Line | |
| MarketCap: 54275.1 Millions | |
| Recent Price: 148.64 Smart Investing & Trading Score: 10 | |
| Day Percent Change: 1.36% Day Change: 2.00 | |
| Week Change: 1.36% Year-to-date Change: 0.8% | |
| AMD Links: Profile News Message Board | |
| Charts:- Daily , Weekly | |
| Add AMD to Watchlist: View: Get AMD Trend Analysis ➞ | |
 | NOW ServiceNow, Inc. |
| Sector: Technology | |
| SubSector: Information Technology Services | |
| MarketCap: 53599.1 Millions | |
| Recent Price: 721.95 Smart Investing & Trading Score: 10 | |
| Day Percent Change: 1.13% Day Change: 8.04 | |
| Week Change: 1.13% Year-to-date Change: 2.2% | |
| NOW Links: Profile News Message Board | |
| Charts:- Daily , Weekly | |
| Add NOW to Watchlist: View: Get NOW Trend Analysis ➞ | |
 | SNPS Synopsys, Inc. |
| Sector: Technology | |
| SubSector: Semiconductor Equipment & Materials | |
| MarketCap: 18273.8 Millions | |
| Recent Price: 515.49 Smart Investing & Trading Score: 10 | |
| Day Percent Change: 0.94% Day Change: 4.78 | |
| Week Change: 0.94% Year-to-date Change: 0.1% | |
| SNPS Links: Profile News Message Board | |
| Charts:- Daily , Weekly | |
| Add SNPS to Watchlist: View: Get SNPS Trend Analysis ➞ | |
 | ISRG Intuitive Surgical, Inc. |
| Sector: Health Care | |
| SubSector: Medical Instruments & Supplies | |
| MarketCap: 50917.5 Millions | |
| Recent Price: 368.93 Smart Investing & Trading Score: 10 | |
| Day Percent Change: 0.71% Day Change: 2.59 | |
| Week Change: 0.71% Year-to-date Change: 9.4% | |
| ISRG Links: Profile News Message Board | |
| Charts:- Daily , Weekly | |
| Add ISRG to Watchlist: View: Get ISRG Trend Analysis ➞ | |
 | SYK Stryker Corporation |
| Sector: Health Care | |
| SubSector: Medical Appliances & Equipment | |
| MarketCap: 59441.3 Millions | |
| Recent Price: 327.68 Smart Investing & Trading Score: 10 | |
| Day Percent Change: 0.69% Day Change: 2.25 | |
| Week Change: 0.69% Year-to-date Change: 9.4% | |
| SYK Links: Profile News Message Board | |
| Charts:- Daily , Weekly | |
| Add SYK to Watchlist: View: Get SYK Trend Analysis ➞ | |
 | INTC Intel Corporation |
| Sector: Technology | |
| SubSector: Semiconductor - Broad Line | |
| MarketCap: 222357 Millions | |
| Recent Price: 34.41 Smart Investing & Trading Score: 10 | |
| Day Percent Change: 0.61% Day Change: 0.21 | |
| Week Change: 0.61% Year-to-date Change: -31.5% | |
| INTC Links: Profile News Message Board | |
| Charts:- Daily , Weekly | |
| Add INTC to Watchlist: View: Get INTC Trend Analysis ➞ | |
 | IT Gartner, Inc. |
| Sector: Technology | |
| SubSector: Information Technology Services | |
| MarketCap: 7767.98 Millions | |
| Recent Price: 443.06 Smart Investing & Trading Score: 10 | |
| Day Percent Change: 0.61% Day Change: 2.68 | |
| Week Change: 0.61% Year-to-date Change: -1.8% | |
| IT Links: Profile News Message Board | |
| Charts:- Daily , Weekly | |
| Add IT to Watchlist: View: Get IT Trend Analysis ➞ | |
 | PLD Prologis, Inc. |
| Sector: Financials | |
| SubSector: REIT - Industrial | |
| MarketCap: 48728.9 Millions | |
| Recent Price: 104.08 Smart Investing & Trading Score: 10 | |
| Day Percent Change: 0.57% Day Change: 0.59 | |
| Week Change: 0.57% Year-to-date Change: -21.9% | |
| PLD Links: Profile News Message Board | |
| Charts:- Daily , Weekly | |
| Add PLD to Watchlist: View: Get PLD Trend Analysis ➞ | |
 | EPAM EPAM Systems, Inc. |
| Sector: Technology | |
| SubSector: Information Technology Services | |
| MarketCap: 11519.6 Millions | |
| Recent Price: 246.95 Smart Investing & Trading Score: 10 | |
| Day Percent Change: 0.40% Day Change: 0.99 | |
| Week Change: 0.4% Year-to-date Change: -17.0% | |
| EPAM Links: Profile News Message Board | |
| Charts:- Daily , Weekly | |
| Add EPAM to Watchlist: View: Get EPAM Trend Analysis ➞ | |
 | EXR Extra Space Storage Inc. |
| Sector: Financials | |
| SubSector: REIT - Industrial | |
| MarketCap: 11203.9 Millions | |
| Recent Price: 132.74 Smart Investing & Trading Score: 10 | |
| Day Percent Change: 0.21% Day Change: 0.28 | |
| Week Change: 0.21% Year-to-date Change: -17.2% | |
| EXR Links: Profile News Message Board | |
| Charts:- Daily , Weekly | |
| Add EXR to Watchlist: View: Get EXR Trend Analysis ➞ | |
 | PPG PPG Industries, Inc. |
| Sector: Materials | |
| SubSector: Specialty Chemicals | |
| MarketCap: 20285.5 Millions | |
| Recent Price: 131.16 Smart Investing & Trading Score: 10 | |
| Day Percent Change: 0.20% Day Change: 0.26 | |
| Week Change: 0.2% Year-to-date Change: -12.3% | |
| PPG Links: Profile News Message Board | |
| Charts:- Daily , Weekly | |
| Add PPG to Watchlist: View: Get PPG Trend Analysis ➞ | |
 | BIO Bio-Rad Laboratories, Inc. |
| Sector: Health Care | |
| SubSector: Medical Laboratories & Research | |
| MarketCap: 10660 Millions | |
| Recent Price: 280.13 Smart Investing & Trading Score: 10 | |
| Day Percent Change: 0.14% Day Change: 0.40 | |
| Week Change: 0.14% Year-to-date Change: -13.2% | |
| BIO Links: Profile News Message Board | |
| Charts:- Daily , Weekly | |
| Add BIO to Watchlist: View: Get BIO Trend Analysis ➞ | |
 | IP International Paper Company |
| Sector: Consumer Staples | |
| SubSector: Packaging & Containers | |
| MarketCap: 13031.3 Millions | |
| Recent Price: 34.76 Smart Investing & Trading Score: 10 | |
| Day Percent Change: -1.72% Day Change: -0.61 | |
| Week Change: -1.72% Year-to-date Change: -3.9% | |
| IP Links: Profile News Message Board | |
| Charts:- Daily , Weekly | |
| Add IP to Watchlist: View: Get IP Trend Analysis ➞ | |
 | INCY Incyte Corporation |
| Sector: Health Care | |
| SubSector: Biotechnology | |
| MarketCap: 15343.2 Millions | |
| Recent Price: 51.92 Smart Investing & Trading Score: 10 | |
| Day Percent Change: -0.82% Day Change: -0.43 | |
| Week Change: -0.82% Year-to-date Change: -17.3% | |
| INCY Links: Profile News Message Board | |
| Charts:- Daily , Weekly | |
| Add INCY to Watchlist: View: Get INCY Trend Analysis ➞ | |
 | KMX CarMax, Inc. |
| Sector: Services & Goods | |
| SubSector: Auto Dealerships | |
| MarketCap: 8121.71 Millions | |
| Recent Price: 67.88 Smart Investing & Trading Score: 10 | |
| Day Percent Change: -0.67% Day Change: -0.46 | |
| Week Change: -0.67% Year-to-date Change: -11.6% | |
| KMX Links: Profile News Message Board | |
| Charts:- Daily , Weekly | |
| Add KMX to Watchlist: View: Get KMX Trend Analysis ➞ | |
 | ZTS Zoetis Inc. |
| Sector: Health Care | |
| SubSector: Drugs - Generic | |
| MarketCap: 51921.5 Millions | |
| Recent Price: 145.54 Smart Investing & Trading Score: 10 | |
| Day Percent Change: -0.66% Day Change: -0.96 | |
| Week Change: -0.66% Year-to-date Change: -26.3% | |
| ZTS Links: Profile News Message Board | |
| Charts:- Daily , Weekly | |
| Add ZTS to Watchlist: View: Get ZTS Trend Analysis ➞ | |
 | DLTR Dollar Tree, Inc. |
| Sector: Services & Goods | |
| SubSector: Discount, Variety Stores | |
| MarketCap: 21383.2 Millions | |
| Recent Price: 121.69 Smart Investing & Trading Score: 10 | |
| Day Percent Change: -0.28% Day Change: -0.34 | |
| Week Change: -0.28% Year-to-date Change: -14.3% | |
| DLTR Links: Profile News Message Board | |
| Charts:- Daily , Weekly | |
| Add DLTR to Watchlist: View: Get DLTR Trend Analysis ➞ | |
 | KEYS Keysight Technologies, Inc. |
| Sector: Technology | |
| SubSector: Scientific & Technical Instruments | |
| MarketCap: 17355.1 Millions | |
| Recent Price: 144.74 Smart Investing & Trading Score: 10 | |
| Day Percent Change: -0.26% Day Change: -0.38 | |
| Week Change: -0.26% Year-to-date Change: -9.0% | |
| KEYS Links: Profile News Message Board | |
| Charts:- Daily , Weekly | |
| Add KEYS to Watchlist: View: Get KEYS Trend Analysis ➞ | |
| For tabular summary view of above stock list: Summary View ➞ 0 - 25 , 25 - 50 , 50 - 75 , 75 - 100 , 100 - 125 , 125 - 150 , 150 - 175 , 175 - 200 , 200 - 225 , 225 - 250 , 250 - 275 , 275 - 300 , 300 - 325 , 325 - 350 , 350 - 375 , 375 - 400 , 400 - 425 , 425 - 450 , 450 - 475 , 475 - 500 | ||
| Click To Change The Sort Order: By Market Cap or Company Size Performance: Year-to-date, Week and Day | |
| Select Chart Type: | ||
|
Best Stocks Today 12Stocks.com |
© 2024 12Stocks.com Terms & Conditions Privacy Contact Us
All Information Provided Only For Education And Not To Be Used For Investing or Trading. See Terms & Conditions


One More Thing ... Get Best Stocks Delivered Daily!
Never Ever Miss A Move With Our Top Ten Stocks Lists
Find Best Stocks In Any Market - Bull or Bear Market
Take A Peek At Our Top Ten Stocks Lists: Daily, Weekly, Year-to-Date & Top Trends
Find Best Stocks In Any Market - Bull or Bear Market
Take A Peek At Our Top Ten Stocks Lists: Daily, Weekly, Year-to-Date & Top Trends
S&P 500 Stocks With Best Up Trends [0-bearish to 100-bullish]: United Airlines[100], EQT [100], Goldman Sachs[100], Capital One[100], Campbell Soup[100], Northrop Grumman[100], UDR [100], Kimberly-Clark [100], M&T Bank[100], Dominion [100], Church & Dwight Co[100]
Best S&P 500 Stocks Year-to-Date:
NVIDIA [60.57%], Constellation [56.45%], NRG [36.15%], Meta Platforms[36.08%], Progressive [33.73%], Marathon [33.63%], Targa Resources[31.01%], United Airlines[30.73%], Diamondback [30.63%], Western Digital[28.03%], Eaton [27.93%] Best S&P 500 Stocks This Week:
Ford Motor[6.1%], United Airlines[4.98%], NVIDIA [4.35%], Enphase [3.78%], DaVita [3.68%], EQT [3.6%], Zions Ban[3.51%], Truist Financial[3.42%], Goldman Sachs[3.3%], Seagate [3.3%], Blackstone [3.12%] Best S&P 500 Stocks Daily:
Ford Motor[6.10%], United Airlines[4.98%], NVIDIA [4.35%], Enphase [3.78%], DaVita [3.68%], EQT [3.60%], Zions Ban[3.51%], Truist Financial[3.42%], Goldman Sachs[3.30%], Seagate [3.30%], Blackstone [3.12%]