
 Login Sign Up


| |||||
 |  | ||||

| 12Stocks.com Market Intelligence |
Best S&P 500 Stocks
|
On this page, you will find the most comprehensive analysis of S&P 500 stocks and ETFs - from latest trends to performances to charts ➞. First, here are the year-to-date (YTD) performances of the most requested S&P 500 stocks at 12Stocks.com (click stock for review):
| NVIDIA 79% | ||
| Amazon.com 25% | ||
| Google 22% | ||
| Merck 19% | ||
| Caterpillar 19% | ||
| Goldman Sachs 18% | ||
| JPMorgan Chase 16% | ||
| Walmart 15% | ||
| Chevron 11% | ||
| Microsoft 10% | ||
| Apple -4% | ||
| Johnson & Johnson -4% | ||
| McDonald s -10% | ||
| Gilead -20% | ||
| Starbucks -21% | ||
| Boeing -30% | ||
| Intel -40% | ||
| Quick: S&P 500 Stocks Lists: Performances & Trends, S&P 500 Stock Charts
Sort S&P 500 stocks: Daily, Weekly, Year-to-Date, Market Cap & Trends. Filter S&P 500 stocks list by sector: Show all, Tech, Finance, Energy, Staples, Retail, Industrial, Materials, Utilities and HealthCare |
| 12Stocks.com S&P 500 Stocks Performances & Trends Daily Report | |||||||||
|
| 
The overall Smart Investing & Trading Score is 83 (0-bearish to 100-bullish) which puts S&P 500 index in short term bullish trend. The Smart Investing & Trading Score from previous trading session is 88 and hence a deterioration of trend. | ||||||||
Here are the Smart Investing & Trading Scores of the most requested S&P 500 stocks at 12Stocks.com (click stock name for detailed review):
|


| 12Stocks.com: Top Performing S&P 500 Index Stocks | ||||||||||||||||||||||||||||||||||||||||||||||||
 The top performing S&P 500 Index stocks year to date are
Now, more recently, over last week, the top performing S&P 500 Index stocks on the move are


|
||||||||||||||||||||||||||||||||||||||||||||||||
| 12Stocks.com: Investing in S&P 500 Index with Stocks | |
|
The following table helps investors and traders sort through current performance and trends (as measured by Smart Investing & Trading Score) of various
stocks in the S&P 500 Index. Quick View: Move mouse or cursor over stock symbol (ticker) to view short-term technical chart and over stock name to view long term chart. Click on  to add stock symbol to your watchlist and to add stock symbol to your watchlist and  to view watchlist. Click on any ticker or stock name for detailed market intelligence report for that stock. to view watchlist. Click on any ticker or stock name for detailed market intelligence report for that stock. |
12Stocks.com Performance of Stocks in S&P 500 Index
| Ticker | Stock Name | Watchlist | Category | Recent Price | Smart Investing & Trading Score | Change % | YTD Change% |
| TMO | Thermo Fisher |   | Health Care | 577.93 | 81 | 0.75% | 8.88% |
| PNC | PNC Financial | | Financials | 157.12 | 81 | -0.06% | 1.47% |
| MAA | Mid-America Apartment | | Financials | 136.34 | 80 | 2.52% | 1.40% |
| KEY | KeyCorp | | Financials | 15.08 | 80 | 0.40% | 4.72% |
| BG | Bunge | | Consumer Staples | 105.39 | 80 | 0.03% | 4.40% |
| WMT | Walmart | | Services & Goods | 60.44 | 78 | 0.23% | 15.01% |
| LLY | Eli Lilly | | Health Care | 771.55 | 78 | -0.45% | 32.36% |
| CAT | Caterpillar | | Industrials | 351.78 | 78 | 2.11% | 18.98% |
| CMG | Chipotle Mexican | | Services & Goods | 3232.97 | 78 | 1.56% | 41.37% |
| MLM | Martin Marietta | | Industrials | 603.20 | 78 | 1.10% | 20.90% |
| PHM | Pulte | | Industrials | 116.99 | 78 | 1.04% | 13.34% |
| C | Citi | | Financials | 63.32 | 78 | 0.91% | 23.09% |
| GOOGL | | Technology | 169.96 | 78 | 0.34% | 21.67% | |
| NXPI | NXP Semiconductors | | Technology | 260.80 | 78 | 0.23% | 13.55% |
| RF | Regions Financial | | Financials | 19.78 | 78 | 0.20% | 2.06% |
| WDC | Western Digital | | Technology | 72.09 | 78 | 0.07% | 37.66% |
| FICO | Fair Isaac | | Technology | 1286.78 | 77 | 2.82% | 10.55% |
| IRM | Iron Mountain | | Technology | 79.59 | 77 | 1.99% | 13.73% |
| ISRG | Intuitive Surgical | | Health Care | 385.45 | 77 | 1.34% | 14.25% |
| MHK | Mohawk Industries | | Consumer Staples | 119.72 | 77 | 1.27% | 15.67% |
| TJX | TJX | | Services & Goods | 98.91 | 77 | 0.42% | 5.44% |
| VRTX | Vertex | | Health Care | 418.99 | 77 | 0.04% | 2.97% |
| PODD | Insulet | | Health Care | 177.53 | 76 | 1.12% | -18.18% |
| STZ | Constellation Brands | | Consumer Staples | 260.70 | 76 | 0.91% | 7.84% |
| DD | DuPont de | | Materials | 78.80 | 76 | 0.77% | 2.43% |
| For chart view version of above stock list: Chart View ➞ 0 - 25 , 25 - 50 , 50 - 75 , 75 - 100 , 100 - 125 , 125 - 150 , 150 - 175 , 175 - 200 , 200 - 225 , 225 - 250 , 250 - 275 , 275 - 300 , 300 - 325 , 325 - 350 , 350 - 375 , 375 - 400 , 400 - 425 , 425 - 450 , 450 - 475 , 475 - 500 | ||
 | Click To Change The Sort Order: By Market Cap or Company Size Performance: Year-to-date, Week and Day |  |
|
Get the most comprehensive stock market coverage daily at 12Stocks.com ➞ Best Stocks Today ➞ Best Stocks Weekly ➞ Best Stocks Year-to-Date ➞ Best Stocks Trends ➞  Best Stocks Today 12Stocks.com Best Nasdaq Stocks ➞ Best S&P 500 Stocks ➞ Best Tech Stocks ➞ Best Biotech Stocks ➞ |
| Detailed Overview of S&P 500 Stocks |
| S&P 500 Technical Overview, Leaders & Laggards, Top S&P 500 ETF Funds & Detailed S&P 500 Stocks List, Charts, Trends & More |
| S&P 500: Technical Analysis, Trends & YTD Performance | |
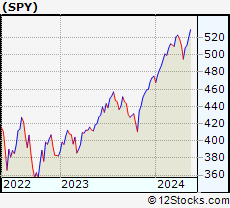
| S&P 500 index as represented by
SPY, an exchange-traded fund [ETF], holds basket of five hundred (mostly largecap) stocks from across all major sectors of the US stock market. The S&P 500 index (contains stocks like Apple and Exxon) is up by 9.44% and is currently outperforming the overall market by 0.76% year-to-date. Below is a quick view of technical charts and trends: | |
 SPY Weekly Chart |
|
| Long Term Trend: Very Good | |
| Medium Term Trend: Very Good | |
 SPY Daily Chart |
|
| Short Term Trend: Very Good | |
| Overall Trend Score: 83 | |
| YTD Performance: 9.44% | |
| **Trend Scores & Views Are Only For Educational Purposes And Not For Investing | |
| 12Stocks.com: Investing in S&P 500 Index using Exchange Traded Funds | |
|
The following table shows list of key exchange traded funds (ETF) that
help investors track S&P 500 index. The following list also includes leveraged ETF funds that track twice or thrice the daily returns of S&P 500 indices. Short or inverse ETF funds move in the opposite direction to the index they track and are useful during market pullbacks or during bear markets. Quick View: Move mouse or cursor over ETF symbol (ticker) to view short-term technical chart and over ETF name to view long term chart. Click on ticker or stock name for detailed view. Click on to add stock symbol to your watchlist and to view watchlist. |
12Stocks.com List of ETFs that track S&P 500 Index
| Ticker | ETF Name | Watchlist | Recent Price | Smart Investing & Trading Score | Change % | Week % | Year-to-date % |
| SPY | SPDR S&P 500 ETF | | 520.17 | 83 | 0.58 | 1.74 | 9.44% |
| IVV | iShares Core S&P 500 ETF | | 522.66 | 83 | 0.55 | 1.72 | 9.43% |
| VOO | Vanguard 500 ETF | | 478.15 | 83 | 0.57 | 1.74 | 9.47% |
| OEF | iShares S&P 100 | | 247.48 | 88 | 0.35 | 1.53 | 10.78% |
| SSO | ProShares Ultra S&P500 | | 75.91 | 95 | 1.07 | 3.34 | 16.66% |
| UPRO | ProShares UltraPro S&P500 | | 67.94 | 95 | 1.62 | 5.02 | 24.11% |
| SPXL | Direxion Daily S&P500 Bull 3X ETF | | 129.10 | 83 | 1.63 | 5.08 | 24.15% |
| SH | ProShares Short S&P500 | | 12.03 | 18 | -0.50 | -1.64 | -7.39% |
| SDS | ProShares UltraShort S&P500 | | 25.41 | 0 | -1.01 | -3.2 | -15.07% |
| SPXU | ProShares UltraPro Short S&P500 | | 33.22 | 0 | -1.57 | -4.79 | -22.74% |
| SPXS | Direxion Daily S&P 500 Bear 3X ETF | | 8.99 | 8 | -1.53 | -4.97 | -22.16% |
| 12Stocks.com: Charts, Trends, Fundamental Data and Performances of S&P 500 Stocks | |
|
We now take in-depth look at all S&P 500 stocks including charts, multi-period performances and overall trends (as measured by Smart Investing & Trading Score). One can sort S&P 500 stocks (click link to choose) by Daily, Weekly and by Year-to-Date performances. Also, one can sort by size of the company or by market capitalization. |
| Select Your Default Chart Type: | |||||
| |||||
| Click on stock symbol or name for detailed view. Click on to add stock symbol to your watchlist and to view watchlist. Quick View: Move mouse or cursor over "Daily" to quickly view daily technical stock chart and over "Weekly" to view weekly technical stock chart. | |||||

 | TMO Thermo Fisher Scientific Inc. |
| Sector: Health Care | |
| SubSector: Medical Laboratories & Research | |
| MarketCap: 112999 Millions | |
| Recent Price: 577.93 Smart Investing & Trading Score: 81 | |
| Day Percent Change: 0.75% Day Change: 4.29 | |
| Week Change: 0.97% Year-to-date Change: 8.9% | |
| TMO Links: Profile News Message Board | |
| Charts:- Daily , Weekly | |
| Add TMO to Watchlist: View: Get TMO Trend Analysis ➞ | |
 | PNC The PNC Financial Services Group, Inc. |
| Sector: Financials | |
| SubSector: Money Center Banks | |
| MarketCap: 41291.5 Millions | |
| Recent Price: 157.12 Smart Investing & Trading Score: 81 | |
| Day Percent Change: -0.06% Day Change: -0.09 | |
| Week Change: 0.58% Year-to-date Change: 1.5% | |
| PNC Links: Profile News Message Board | |
| Charts:- Daily , Weekly | |
| Add PNC to Watchlist: View: Get PNC Trend Analysis ➞ | |
 | MAA Mid-America Apartment Communities, Inc. |
| Sector: Financials | |
| SubSector: REIT - Residential | |
| MarketCap: 11385.5 Millions | |
| Recent Price: 136.34 Smart Investing & Trading Score: 80 | |
| Day Percent Change: 2.52% Day Change: 3.35 | |
| Week Change: 2.51% Year-to-date Change: 1.4% | |
| MAA Links: Profile News Message Board | |
| Charts:- Daily , Weekly | |
| Add MAA to Watchlist: View: Get MAA Trend Analysis ➞ | |
 | KEY KeyCorp |
| Sector: Financials | |
| SubSector: Regional - Midwest Banks | |
| MarketCap: 10045 Millions | |
| Recent Price: 15.08 Smart Investing & Trading Score: 80 | |
| Day Percent Change: 0.40% Day Change: 0.06 | |
| Week Change: 1% Year-to-date Change: 4.7% | |
| KEY Links: Profile News Message Board | |
| Charts:- Daily , Weekly | |
| Add KEY to Watchlist: View: Get KEY Trend Analysis ➞ | |
 | BG Bunge Limited |
| Sector: Consumer Staples | |
| SubSector: Farm Products | |
| MarketCap: 4975.77 Millions | |
| Recent Price: 105.39 Smart Investing & Trading Score: 80 | |
| Day Percent Change: 0.03% Day Change: 0.03 | |
| Week Change: 4.19% Year-to-date Change: 4.4% | |
| BG Links: Profile News Message Board | |
| Charts:- Daily , Weekly | |
| Add BG to Watchlist: View: Get BG Trend Analysis ➞ | |
 | WMT Walmart Inc. |
| Sector: Services & Goods | |
| SubSector: Discount, Variety Stores | |
| MarketCap: 355610 Millions | |
| Recent Price: 60.44 Smart Investing & Trading Score: 78 | |
| Day Percent Change: 0.23% Day Change: 0.14 | |
| Week Change: 1.04% Year-to-date Change: 15.0% | |
| WMT Links: Profile News Message Board | |
| Charts:- Daily , Weekly | |
| Add WMT to Watchlist: View: Get WMT Trend Analysis ➞ | |
 | LLY Eli Lilly and Company |
| Sector: Health Care | |
| SubSector: Drug Manufacturers - Major | |
| MarketCap: 130066 Millions | |
| Recent Price: 771.55 Smart Investing & Trading Score: 78 | |
| Day Percent Change: -0.45% Day Change: -3.45 | |
| Week Change: 4.98% Year-to-date Change: 32.4% | |
| LLY Links: Profile News Message Board | |
| Charts:- Daily , Weekly | |
| Add LLY to Watchlist: View: Get LLY Trend Analysis ➞ | |
 | CAT Caterpillar Inc. |
| Sector: Industrials | |
| SubSector: Farm & Construction Machinery | |
| MarketCap: 58636 Millions | |
| Recent Price: 351.78 Smart Investing & Trading Score: 78 | |
| Day Percent Change: 2.11% Day Change: 7.28 | |
| Week Change: 4.46% Year-to-date Change: 19.0% | |
| CAT Links: Profile News Message Board | |
| Charts:- Daily , Weekly | |
| Add CAT to Watchlist: View: Get CAT Trend Analysis ➞ | |
 | CMG Chipotle Mexican Grill, Inc. |
| Sector: Services & Goods | |
| SubSector: Restaurants | |
| MarketCap: 16849.9 Millions | |
| Recent Price: 3232.97 Smart Investing & Trading Score: 78 | |
| Day Percent Change: 1.56% Day Change: 49.72 | |
| Week Change: 2.46% Year-to-date Change: 41.4% | |
| CMG Links: Profile News Message Board | |
| Charts:- Daily , Weekly | |
| Add CMG to Watchlist: View: Get CMG Trend Analysis ➞ | |
 | MLM Martin Marietta Materials, Inc. |
| Sector: Industrials | |
| SubSector: General Building Materials | |
| MarketCap: 10624.3 Millions | |
| Recent Price: 603.20 Smart Investing & Trading Score: 78 | |
| Day Percent Change: 1.10% Day Change: 6.56 | |
| Week Change: 2.06% Year-to-date Change: 20.9% | |
| MLM Links: Profile News Message Board | |
| Charts:- Daily , Weekly | |
| Add MLM to Watchlist: View: Get MLM Trend Analysis ➞ | |
 | PHM PulteGroup, Inc. |
| Sector: Industrials | |
| SubSector: Residential Construction | |
| MarketCap: 6186.46 Millions | |
| Recent Price: 116.99 Smart Investing & Trading Score: 78 | |
| Day Percent Change: 1.04% Day Change: 1.20 | |
| Week Change: 0.3% Year-to-date Change: 13.3% | |
| PHM Links: Profile News Message Board | |
| Charts:- Daily , Weekly | |
| Add PHM to Watchlist: View: Get PHM Trend Analysis ➞ | |
 | C Citigroup Inc. |
| Sector: Financials | |
| SubSector: Money Center Banks | |
| MarketCap: 94128 Millions | |
| Recent Price: 63.32 Smart Investing & Trading Score: 78 | |
| Day Percent Change: 0.91% Day Change: 0.57 | |
| Week Change: 2.93% Year-to-date Change: 23.1% | |
| C Links: Profile News Message Board | |
| Charts:- Daily , Weekly | |
| Add C to Watchlist: View: Get C Trend Analysis ➞ | |
 | GOOGL Alphabet Inc. |
| Sector: Technology | |
| SubSector: Internet Information Providers | |
| MarketCap: 801264 Millions | |
| Recent Price: 169.96 Smart Investing & Trading Score: 78 | |
| Day Percent Change: 0.34% Day Change: 0.58 | |
| Week Change: 1.63% Year-to-date Change: 21.7% | |
| GOOGL Links: Profile News Message Board | |
| Charts:- Daily , Weekly | |
| Add GOOGL to Watchlist: View: Get GOOGL Trend Analysis ➞ | |
 | NXPI NXP Semiconductors N.V. |
| Sector: Technology | |
| SubSector: Semiconductor - Broad Line | |
| MarketCap: 22497.9 Millions | |
| Recent Price: 260.80 Smart Investing & Trading Score: 78 | |
| Day Percent Change: 0.23% Day Change: 0.59 | |
| Week Change: 1.14% Year-to-date Change: 13.6% | |
| NXPI Links: Profile News Message Board | |
| Charts:- Daily , Weekly | |
| Add NXPI to Watchlist: View: Get NXPI Trend Analysis ➞ | |
 | RF Regions Financial Corporation |
| Sector: Financials | |
| SubSector: Regional - Southeast Banks | |
| MarketCap: 8936.25 Millions | |
| Recent Price: 19.78 Smart Investing & Trading Score: 78 | |
| Day Percent Change: 0.20% Day Change: 0.04 | |
| Week Change: -0.1% Year-to-date Change: 2.1% | |
| RF Links: Profile News Message Board | |
| Charts:- Daily , Weekly | |
| Add RF to Watchlist: View: Get RF Trend Analysis ➞ | |
 | WDC Western Digital Corporation |
| Sector: Technology | |
| SubSector: Data Storage Devices | |
| MarketCap: 10712.9 Millions | |
| Recent Price: 72.09 Smart Investing & Trading Score: 78 | |
| Day Percent Change: 0.07% Day Change: 0.05 | |
| Week Change: 1.61% Year-to-date Change: 37.7% | |
| WDC Links: Profile News Message Board | |
| Charts:- Daily , Weekly | |
| Add WDC to Watchlist: View: Get WDC Trend Analysis ➞ | |
 | FICO Fair Isaac Corporation |
| Sector: Technology | |
| SubSector: Business Software & Services | |
| MarketCap: 7930.98 Millions | |
| Recent Price: 1286.78 Smart Investing & Trading Score: 77 | |
| Day Percent Change: 2.82% Day Change: 35.34 | |
| Week Change: 7.86% Year-to-date Change: 10.6% | |
| FICO Links: Profile News Message Board | |
| Charts:- Daily , Weekly | |
| Add FICO to Watchlist: View: Get FICO Trend Analysis ➞ | |
 | IRM Iron Mountain Incorporated |
| Sector: Technology | |
| SubSector: Business Software & Services | |
| MarketCap: 7339.18 Millions | |
| Recent Price: 79.59 Smart Investing & Trading Score: 77 | |
| Day Percent Change: 1.99% Day Change: 1.55 | |
| Week Change: 5.67% Year-to-date Change: 13.7% | |
| IRM Links: Profile News Message Board | |
| Charts:- Daily , Weekly | |
| Add IRM to Watchlist: View: Get IRM Trend Analysis ➞ | |
 | ISRG Intuitive Surgical, Inc. |
| Sector: Health Care | |
| SubSector: Medical Instruments & Supplies | |
| MarketCap: 50917.5 Millions | |
| Recent Price: 385.45 Smart Investing & Trading Score: 77 | |
| Day Percent Change: 1.34% Day Change: 5.08 | |
| Week Change: 1.07% Year-to-date Change: 14.3% | |
| ISRG Links: Profile News Message Board | |
| Charts:- Daily , Weekly | |
| Add ISRG to Watchlist: View: Get ISRG Trend Analysis ➞ | |
 | MHK Mohawk Industries, Inc. |
| Sector: Consumer Staples | |
| SubSector: Home Furnishings & Fixtures | |
| MarketCap: 4682.25 Millions | |
| Recent Price: 119.72 Smart Investing & Trading Score: 77 | |
| Day Percent Change: 1.27% Day Change: 1.50 | |
| Week Change: 2.88% Year-to-date Change: 15.7% | |
| MHK Links: Profile News Message Board | |
| Charts:- Daily , Weekly | |
| Add MHK to Watchlist: View: Get MHK Trend Analysis ➞ | |
 | TJX The TJX Companies, Inc. |
| Sector: Services & Goods | |
| SubSector: Department Stores | |
| MarketCap: 50656.2 Millions | |
| Recent Price: 98.91 Smart Investing & Trading Score: 77 | |
| Day Percent Change: 0.42% Day Change: 0.41 | |
| Week Change: 4% Year-to-date Change: 5.4% | |
| TJX Links: Profile News Message Board | |
| Charts:- Daily , Weekly | |
| Add TJX to Watchlist: View: Get TJX Trend Analysis ➞ | |
 | VRTX Vertex Pharmaceuticals Incorporated |
| Sector: Health Care | |
| SubSector: Biotechnology | |
| MarketCap: 57669.6 Millions | |
| Recent Price: 418.99 Smart Investing & Trading Score: 77 | |
| Day Percent Change: 0.04% Day Change: 0.17 | |
| Week Change: 4.47% Year-to-date Change: 3.0% | |
| VRTX Links: Profile News Message Board | |
| Charts:- Daily , Weekly | |
| Add VRTX to Watchlist: View: Get VRTX Trend Analysis ➞ | |
 | PODD Insulet Corporation |
| Sector: Health Care | |
| SubSector: Medical Instruments & Supplies | |
| MarketCap: 9313.2 Millions | |
| Recent Price: 177.53 Smart Investing & Trading Score: 76 | |
| Day Percent Change: 1.12% Day Change: 1.96 | |
| Week Change: 1.78% Year-to-date Change: -18.2% | |
| PODD Links: Profile News Message Board | |
| Charts:- Daily , Weekly | |
| Add PODD to Watchlist: View: Get PODD Trend Analysis ➞ | |
 | STZ Constellation Brands, Inc. |
| Sector: Consumer Staples | |
| SubSector: Beverages - Wineries & Distillers | |
| MarketCap: 27394.5 Millions | |
| Recent Price: 260.70 Smart Investing & Trading Score: 76 | |
| Day Percent Change: 0.91% Day Change: 2.34 | |
| Week Change: 1.8% Year-to-date Change: 7.8% | |
| STZ Links: Profile News Message Board | |
| Charts:- Daily , Weekly | |
| Add STZ to Watchlist: View: Get STZ Trend Analysis ➞ | |
 | DD DuPont de Nemours, Inc. |
| Sector: Materials | |
| SubSector: Agricultural Chemicals | |
| MarketCap: 25631.6 Millions | |
| Recent Price: 78.80 Smart Investing & Trading Score: 76 | |
| Day Percent Change: 0.77% Day Change: 0.60 | |
| Week Change: 1.45% Year-to-date Change: 2.4% | |
| DD Links: Profile News Message Board | |
| Charts:- Daily , Weekly | |
| Add DD to Watchlist: View: Get DD Trend Analysis ➞ | |
| For tabular summary view of above stock list: Summary View ➞ 0 - 25 , 25 - 50 , 50 - 75 , 75 - 100 , 100 - 125 , 125 - 150 , 150 - 175 , 175 - 200 , 200 - 225 , 225 - 250 , 250 - 275 , 275 - 300 , 300 - 325 , 325 - 350 , 350 - 375 , 375 - 400 , 400 - 425 , 425 - 450 , 450 - 475 , 475 - 500 | ||
| Click To Change The Sort Order: By Market Cap or Company Size Performance: Year-to-date, Week and Day | |
| Select Chart Type: | ||
|
Best Stocks Today 12Stocks.com |
© 2024 12Stocks.com Terms & Conditions Privacy Contact Us
All Information Provided Only For Education And Not To Be Used For Investing or Trading. See Terms & Conditions


One More Thing ... Get Best Stocks Delivered Daily!
Never Ever Miss A Move With Our Top Ten Stocks Lists
Find Best Stocks In Any Market - Bull or Bear Market
Take A Peek At Our Top Ten Stocks Lists: Daily, Weekly, Year-to-Date & Top Trends
Find Best Stocks In Any Market - Bull or Bear Market
Take A Peek At Our Top Ten Stocks Lists: Daily, Weekly, Year-to-Date & Top Trends
S&P 500 Stocks With Best Up Trends [0-bearish to 100-bullish]: NRG [100], Constellation [100], Extra Space[100], FMC [100], AES [100], Newmont [100], Mettler-Toledo [100], Emerson Electric[100], Morgan Stanley[100], Nordson [100], NextEra [100]
Best S&P 500 Stocks Year-to-Date:
Constellation [84.37%], NVIDIA [79.21%], NRG [58.14%], Chipotle Mexican[41.37%], Eaton [38.39%], Micron [38.05%], Western Digital[37.66%], Leidos Holdings[35.65%], Meta Platforms[34.3%], Progressive [34.18%], Arch Capital[34.15%] Best S&P 500 Stocks This Week:
Flavors[12.03%], Globe Life[12.03%], Constellation [10.83%], Equinix [10.32%], Paper[9.81%], STERIS [8.74%], Emerson Electric[8.49%], FMC [8.36%], Henry Schein[8.35%], Arista Networks[7.9%], Fair Isaac[7.86%] Best S&P 500 Stocks Daily:
Equinix [11.51%], NRG [7.83%], STERIS [7.57%], Universal Health[4.47%], HCA Healthcare[4.03%], Waters [3.90%], Constellation [3.80%], Extra Space[3.74%], Tapestry [3.57%], Builders FirstSource[3.55%], Bio-Rad [3.37%]