
 Login Sign Up


| |||||
 |  | ||||

| 12Stocks.com Market Intelligence |
Best S&P 500 Stocks
|
On this page, you will find the most comprehensive analysis of S&P 500 stocks and ETFs - from latest trends to performances to charts ➞. First, here are the year-to-date (YTD) performances of the most requested S&P 500 stocks at 12Stocks.com (click stock for review):
| NVIDIA 66% | ||
| Caterpillar 23% | ||
| Amazon.com 18% | ||
| Merck 16% | ||
| Google 13% | ||
| JPMorgan Chase 13% | ||
| Walmart 12% | ||
| Goldman Sachs 10% | ||
| Chevron 9% | ||
| Microsoft 8% | ||
| Johnson & Johnson -5% | ||
| McDonald s -7% | ||
| Starbucks -8% | ||
| Apple -13% | ||
| Gilead -17% | ||
| Intel -32% | ||
| Boeing -35% | ||
| Quick: S&P 500 Stocks Lists: Performances & Trends, S&P 500 Stock Charts
Sort S&P 500 stocks: Daily, Weekly, Year-to-Date, Market Cap & Trends. Filter S&P 500 stocks list by sector: Show all, Tech, Finance, Energy, Staples, Retail, Industrial, Materials, Utilities and HealthCare |
| 12Stocks.com S&P 500 Stocks Performances & Trends Daily Report | |||||||||
|
| 
The overall Smart Investing & Trading Score is 58 (0-bearish to 100-bullish) which puts S&P 500 index in short term neutral trend. The Smart Investing & Trading Score from previous trading session is 51 and hence an improvement of trend. | ||||||||
Here are the Smart Investing & Trading Scores of the most requested S&P 500 stocks at 12Stocks.com (click stock name for detailed review):
|


| 12Stocks.com: Top Performing S&P 500 Index Stocks | ||||||||||||||||||||||||||||||||||||||||||||||||
 The top performing S&P 500 Index stocks year to date are
Now, more recently, over last week, the top performing S&P 500 Index stocks on the move are


|
||||||||||||||||||||||||||||||||||||||||||||||||
| 12Stocks.com: Investing in S&P 500 Index with Stocks | |
|
The following table helps investors and traders sort through current performance and trends (as measured by Smart Investing & Trading Score) of various
stocks in the S&P 500 Index. Quick View: Move mouse or cursor over stock symbol (ticker) to view short-term technical chart and over stock name to view long term chart. Click on  to add stock symbol to your watchlist and to add stock symbol to your watchlist and  to view watchlist. Click on any ticker or stock name for detailed market intelligence report for that stock. to view watchlist. Click on any ticker or stock name for detailed market intelligence report for that stock. |
12Stocks.com Performance of Stocks in S&P 500 Index
| Ticker | Stock Name | Watchlist | Category | Recent Price | Smart Investing & Trading Score | Change % | YTD Change% |
| ADBE | Adobe |   | Technology | 472.90 | 35 | 1.29% | -20.73% |
| AAPL | Apple | | Technology | 166.90 | 35 | 0.64% | -13.31% |
| EXR | Extra Space | | Financials | 133.28 | 35 | 0.41% | -16.87% |
| MOS | Mosaic | | Materials | 30.41 | 35 | -1.07% | -14.89% |
| BA | Boeing | | Industrials | 169.18 | 35 | -0.76% | -35.10% |
| APD | Air Products | | Materials | 233.71 | 35 | -0.28% | -14.64% |
| ACN | Accenture | | Technology | 316.83 | 35 | -0.19% | -9.71% |
| WMT | Walmart | | Services & Goods | 59.09 | 34 | -1.75% | 12.45% |
| WAT | Waters | | Health Care | 313.30 | 32 | 4.70% | -4.84% |
| KMX | CarMax | | Services & Goods | 69.69 | 32 | 2.67% | -9.19% |
| NOW | ServiceNow | | Technology | 740.95 | 32 | 2.63% | 4.88% |
| EFX | Equifax | | Financials | 224.46 | 32 | 2.53% | -9.23% |
| SNPS | Synopsys | | Technology | 527.50 | 32 | 2.33% | 2.45% |
| DLR | Digital Realty | | Financials | 138.53 | 32 | 1.97% | 2.94% |
| BIO | Bio-Rad | | Health Care | 285.28 | 32 | 1.84% | -11.65% |
| COO | Cooper | | Health Care | 91.68 | 32 | 1.82% | -3.10% |
| CZR | Caesars Entertainment | | Services & Goods | 39.12 | 32 | 1.82% | -16.55% |
| SWKS | Skyworks Solutions | | Technology | 99.30 | 32 | 1.21% | -11.67% |
| AMT | American Tower | | Financials | 174.18 | 32 | 1.09% | -19.32% |
| CRM | salesforce.com | | Technology | 276.68 | 32 | 1.05% | 5.15% |
| SNA | Snap-on | | Industrials | 271.34 | 32 | 1.04% | -6.06% |
| MGM | MGM Resorts | | Services & Goods | 42.85 | 32 | 0.99% | -4.10% |
| HD | Home Depot | | Services & Goods | 339.00 | 32 | 0.86% | -2.18% |
| BLK | BlackRock | | Financials | 766.62 | 32 | 0.86% | -5.57% |
| BR | Broadridge Financial | | Technology | 195.91 | 32 | 0.86% | -4.78% |
| For chart view version of above stock list: Chart View ➞ 0 - 25 , 25 - 50 , 50 - 75 , 75 - 100 , 100 - 125 , 125 - 150 , 150 - 175 , 175 - 200 , 200 - 225 , 225 - 250 , 250 - 275 , 275 - 300 , 300 - 325 , 325 - 350 , 350 - 375 , 375 - 400 , 400 - 425 , 425 - 450 , 450 - 475 , 475 - 500 | ||
 | Click To Change The Sort Order: By Market Cap or Company Size Performance: Year-to-date, Week and Day |  |
|
Get the most comprehensive stock market coverage daily at 12Stocks.com ➞ Best Stocks Today ➞ Best Stocks Weekly ➞ Best Stocks Year-to-Date ➞ Best Stocks Trends ➞  Best Stocks Today 12Stocks.com Best Nasdaq Stocks ➞ Best S&P 500 Stocks ➞ Best Tech Stocks ➞ Best Biotech Stocks ➞ |
| Detailed Overview of S&P 500 Stocks |
| S&P 500 Technical Overview, Leaders & Laggards, Top S&P 500 ETF Funds & Detailed S&P 500 Stocks List, Charts, Trends & More |
| S&P 500: Technical Analysis, Trends & YTD Performance | |
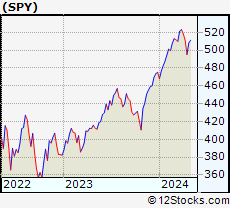
| S&P 500 index as represented by
SPY, an exchange-traded fund [ETF], holds basket of five hundred (mostly largecap) stocks from across all major sectors of the US stock market. The S&P 500 index (contains stocks like Apple and Exxon) is up by 6.38% and is currently outperforming the overall market by 0.74% year-to-date. Below is a quick view of technical charts and trends: | |
 SPY Weekly Chart |
|
| Long Term Trend: Good | |
| Medium Term Trend: Not Good | |
 SPY Daily Chart |
|
| Short Term Trend: Very Good | |
| Overall Trend Score: 58 | |
| YTD Performance: 6.38% | |
| **Trend Scores & Views Are Only For Educational Purposes And Not For Investing | |
| 12Stocks.com: Investing in S&P 500 Index using Exchange Traded Funds | |
|
The following table shows list of key exchange traded funds (ETF) that
help investors track S&P 500 index. The following list also includes leveraged ETF funds that track twice or thrice the daily returns of S&P 500 indices. Short or inverse ETF funds move in the opposite direction to the index they track and are useful during market pullbacks or during bear markets. Quick View: Move mouse or cursor over ETF symbol (ticker) to view short-term technical chart and over ETF name to view long term chart. Click on ticker or stock name for detailed view. Click on to add stock symbol to your watchlist and to view watchlist. |
12Stocks.com List of ETFs that track S&P 500 Index
| Ticker | ETF Name | Watchlist | Recent Price | Smart Investing & Trading Score | Change % | Week % | Year-to-date % |
| SPY | SPDR S&P 500 ETF | | 505.65 | 58 | 1.19 | 2.12 | 6.38% |
| IVV | iShares Core S&P 500 ETF | | 508.17 | 58 | 2.00 | 2.14 | 6.39% |
| VOO | Vanguard 500 ETF | | 464.84 | 58 | 2.03 | 2.14 | 6.42% |
| OEF | iShares S&P 100 | | 239.95 | 58 | 1.33 | 2.25 | 7.41% |
| SSO | ProShares Ultra S&P500 | | 72.04 | 58 | 2.43 | 4.24 | 10.71% |
| UPRO | ProShares UltraPro S&P500 | | 62.93 | 58 | 3.59 | 6.37 | 14.96% |
| SPXL | Direxion Daily S&P500 Bull 3X ETF | | 119.51 | 58 | 3.52 | 6.18 | 14.92% |
| SH | ProShares Short S&P500 | | 12.34 | 42 | -1.20 | -1.99 | -5% |
| SDS | ProShares UltraShort S&P500 | | 26.78 | 37 | -2.30 | -4.01 | -10.49% |
| SPXU | ProShares UltraPro Short S&P500 | | 35.99 | 42 | -3.62 | -6.1 | -16.3% |
| SPXS | Direxion Daily S&P 500 Bear 3X ETF | | 9.75 | 32 | -5.43 | -5.89 | -15.58% |
| 12Stocks.com: Charts, Trends, Fundamental Data and Performances of S&P 500 Stocks | |
|
We now take in-depth look at all S&P 500 stocks including charts, multi-period performances and overall trends (as measured by Smart Investing & Trading Score). One can sort S&P 500 stocks (click link to choose) by Daily, Weekly and by Year-to-Date performances. Also, one can sort by size of the company or by market capitalization. |
| Select Your Default Chart Type: | |||||
| |||||
| Click on stock symbol or name for detailed view. Click on to add stock symbol to your watchlist and to view watchlist. Quick View: Move mouse or cursor over "Daily" to quickly view daily technical stock chart and over "Weekly" to view weekly technical stock chart. | |||||

 | ADBE Adobe Inc. |
| Sector: Technology | |
| SubSector: Application Software | |
| MarketCap: 157868 Millions | |
| Recent Price: 472.90 Smart Investing & Trading Score: 35 | |
| Day Percent Change: 1.29% Day Change: 6.01 | |
| Week Change: 1.69% Year-to-date Change: -20.7% | |
| ADBE Links: Profile News Message Board | |
| Charts:- Daily , Weekly | |
| Add ADBE to Watchlist: View: Get ADBE Trend Analysis ➞ | |
 | AAPL Apple Inc. |
| Sector: Technology | |
| SubSector: Electronic Equipment | |
| MarketCap: 1112940 Millions | |
| Recent Price: 166.90 Smart Investing & Trading Score: 35 | |
| Day Percent Change: 0.64% Day Change: 1.06 | |
| Week Change: 1.15% Year-to-date Change: -13.3% | |
| AAPL Links: Profile News Message Board | |
| Charts:- Daily , Weekly | |
| Add AAPL to Watchlist: View: Get AAPL Trend Analysis ➞ | |
 | EXR Extra Space Storage Inc. |
| Sector: Financials | |
| SubSector: REIT - Industrial | |
| MarketCap: 11203.9 Millions | |
| Recent Price: 133.28 Smart Investing & Trading Score: 35 | |
| Day Percent Change: 0.41% Day Change: 0.54 | |
| Week Change: 0.62% Year-to-date Change: -16.9% | |
| EXR Links: Profile News Message Board | |
| Charts:- Daily , Weekly | |
| Add EXR to Watchlist: View: Get EXR Trend Analysis ➞ | |
 | MOS The Mosaic Company |
| Sector: Materials | |
| SubSector: Agricultural Chemicals | |
| MarketCap: 4299.59 Millions | |
| Recent Price: 30.41 Smart Investing & Trading Score: 35 | |
| Day Percent Change: -1.07% Day Change: -0.33 | |
| Week Change: -1.9% Year-to-date Change: -14.9% | |
| MOS Links: Profile News Message Board | |
| Charts:- Daily , Weekly | |
| Add MOS to Watchlist: View: Get MOS Trend Analysis ➞ | |
 | BA The Boeing Company |
| Sector: Industrials | |
| SubSector: Aerospace/Defense Products & Services | |
| MarketCap: 65336.4 Millions | |
| Recent Price: 169.18 Smart Investing & Trading Score: 35 | |
| Day Percent Change: -0.76% Day Change: -1.30 | |
| Week Change: -0.38% Year-to-date Change: -35.1% | |
| BA Links: Profile News Message Board | |
| Charts:- Daily , Weekly | |
| Add BA to Watchlist: View: Get BA Trend Analysis ➞ | |
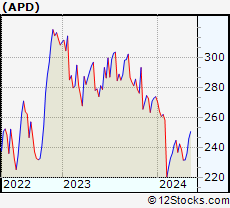 | APD Air Products and Chemicals, Inc. |
| Sector: Materials | |
| SubSector: Chemicals - Major Diversified | |
| MarketCap: 46203.6 Millions | |
| Recent Price: 233.71 Smart Investing & Trading Score: 35 | |
| Day Percent Change: -0.28% Day Change: -0.65 | |
| Week Change: 0.89% Year-to-date Change: -14.6% | |
| APD Links: Profile News Message Board | |
| Charts:- Daily , Weekly | |
| Add APD to Watchlist: View: Get APD Trend Analysis ➞ | |
 | ACN Accenture plc |
| Sector: Technology | |
| SubSector: Information Technology Services | |
| MarketCap: 106627 Millions | |
| Recent Price: 316.83 Smart Investing & Trading Score: 35 | |
| Day Percent Change: -0.19% Day Change: -0.59 | |
| Week Change: -0.02% Year-to-date Change: -9.7% | |
| ACN Links: Profile News Message Board | |
| Charts:- Daily , Weekly | |
| Add ACN to Watchlist: View: Get ACN Trend Analysis ➞ | |
 | WMT Walmart Inc. |
| Sector: Services & Goods | |
| SubSector: Discount, Variety Stores | |
| MarketCap: 355610 Millions | |
| Recent Price: 59.09 Smart Investing & Trading Score: 34 | |
| Day Percent Change: -1.75% Day Change: -1.05 | |
| Week Change: -0.74% Year-to-date Change: 12.5% | |
| WMT Links: Profile News Message Board | |
| Charts:- Daily , Weekly | |
| Add WMT to Watchlist: View: Get WMT Trend Analysis ➞ | |
 | WAT Waters Corporation |
| Sector: Health Care | |
| SubSector: Medical Instruments & Supplies | |
| MarketCap: 11882 Millions | |
| Recent Price: 313.30 Smart Investing & Trading Score: 32 | |
| Day Percent Change: 4.70% Day Change: 14.07 | |
| Week Change: 5.81% Year-to-date Change: -4.8% | |
| WAT Links: Profile News Message Board | |
| Charts:- Daily , Weekly | |
| Add WAT to Watchlist: View: Get WAT Trend Analysis ➞ | |
 | KMX CarMax, Inc. |
| Sector: Services & Goods | |
| SubSector: Auto Dealerships | |
| MarketCap: 8121.71 Millions | |
| Recent Price: 69.69 Smart Investing & Trading Score: 32 | |
| Day Percent Change: 2.67% Day Change: 1.81 | |
| Week Change: 1.98% Year-to-date Change: -9.2% | |
| KMX Links: Profile News Message Board | |
| Charts:- Daily , Weekly | |
| Add KMX to Watchlist: View: Get KMX Trend Analysis ➞ | |
 | NOW ServiceNow, Inc. |
| Sector: Technology | |
| SubSector: Information Technology Services | |
| MarketCap: 53599.1 Millions | |
| Recent Price: 740.95 Smart Investing & Trading Score: 32 | |
| Day Percent Change: 2.63% Day Change: 19.00 | |
| Week Change: 3.79% Year-to-date Change: 4.9% | |
| NOW Links: Profile News Message Board | |
| Charts:- Daily , Weekly | |
| Add NOW to Watchlist: View: Get NOW Trend Analysis ➞ | |
 | EFX Equifax Inc. |
| Sector: Financials | |
| SubSector: Credit Services | |
| MarketCap: 13754.6 Millions | |
| Recent Price: 224.46 Smart Investing & Trading Score: 32 | |
| Day Percent Change: 2.53% Day Change: 5.53 | |
| Week Change: 3.82% Year-to-date Change: -9.2% | |
| EFX Links: Profile News Message Board | |
| Charts:- Daily , Weekly | |
| Add EFX to Watchlist: View: Get EFX Trend Analysis ➞ | |
 | SNPS Synopsys, Inc. |
| Sector: Technology | |
| SubSector: Semiconductor Equipment & Materials | |
| MarketCap: 18273.8 Millions | |
| Recent Price: 527.50 Smart Investing & Trading Score: 32 | |
| Day Percent Change: 2.33% Day Change: 12.01 | |
| Week Change: 3.29% Year-to-date Change: 2.5% | |
| SNPS Links: Profile News Message Board | |
| Charts:- Daily , Weekly | |
| Add SNPS to Watchlist: View: Get SNPS Trend Analysis ➞ | |
 | DLR Digital Realty Trust, Inc. |
| Sector: Financials | |
| SubSector: REIT - Office | |
| MarketCap: 27038.6 Millions | |
| Recent Price: 138.53 Smart Investing & Trading Score: 32 | |
| Day Percent Change: 1.97% Day Change: 2.67 | |
| Week Change: 1.24% Year-to-date Change: 2.9% | |
| DLR Links: Profile News Message Board | |
| Charts:- Daily , Weekly | |
| Add DLR to Watchlist: View: Get DLR Trend Analysis ➞ | |
 | BIO Bio-Rad Laboratories, Inc. |
| Sector: Health Care | |
| SubSector: Medical Laboratories & Research | |
| MarketCap: 10660 Millions | |
| Recent Price: 285.28 Smart Investing & Trading Score: 32 | |
| Day Percent Change: 1.84% Day Change: 5.15 | |
| Week Change: 1.98% Year-to-date Change: -11.7% | |
| BIO Links: Profile News Message Board | |
| Charts:- Daily , Weekly | |
| Add BIO to Watchlist: View: Get BIO Trend Analysis ➞ | |
 | COO The Cooper Companies, Inc. |
| Sector: Health Care | |
| SubSector: Medical Instruments & Supplies | |
| MarketCap: 15460 Millions | |
| Recent Price: 91.68 Smart Investing & Trading Score: 32 | |
| Day Percent Change: 1.82% Day Change: 1.64 | |
| Week Change: 1.39% Year-to-date Change: -3.1% | |
| COO Links: Profile News Message Board | |
| Charts:- Daily , Weekly | |
| Add COO to Watchlist: View: Get COO Trend Analysis ➞ | |
 | CZR Caesars Entertainment Corporation |
| Sector: Services & Goods | |
| SubSector: Resorts & Casinos | |
| MarketCap: 4618.44 Millions | |
| Recent Price: 39.12 Smart Investing & Trading Score: 32 | |
| Day Percent Change: 1.82% Day Change: 0.70 | |
| Week Change: 2.41% Year-to-date Change: -16.6% | |
| CZR Links: Profile News Message Board | |
| Charts:- Daily , Weekly | |
| Add CZR to Watchlist: View: Get CZR Trend Analysis ➞ | |
 | SWKS Skyworks Solutions, Inc. |
| Sector: Technology | |
| SubSector: Semiconductor - Integrated Circuits | |
| MarketCap: 13981 Millions | |
| Recent Price: 99.30 Smart Investing & Trading Score: 32 | |
| Day Percent Change: 1.21% Day Change: 1.19 | |
| Week Change: 3.32% Year-to-date Change: -11.7% | |
| SWKS Links: Profile News Message Board | |
| Charts:- Daily , Weekly | |
| Add SWKS to Watchlist: View: Get SWKS Trend Analysis ➞ | |
 | AMT American Tower Corporation (REIT) |
| Sector: Financials | |
| SubSector: REIT - Diversified | |
| MarketCap: 92527 Millions | |
| Recent Price: 174.18 Smart Investing & Trading Score: 32 | |
| Day Percent Change: 1.09% Day Change: 1.88 | |
| Week Change: 1.68% Year-to-date Change: -19.3% | |
| AMT Links: Profile News Message Board | |
| Charts:- Daily , Weekly | |
| Add AMT to Watchlist: View: Get AMT Trend Analysis ➞ | |
 | CRM salesforce.com, inc. |
| Sector: Technology | |
| SubSector: Application Software | |
| MarketCap: 137120 Millions | |
| Recent Price: 276.68 Smart Investing & Trading Score: 32 | |
| Day Percent Change: 1.05% Day Change: 2.87 | |
| Week Change: 2.33% Year-to-date Change: 5.2% | |
| CRM Links: Profile News Message Board | |
| Charts:- Daily , Weekly | |
| Add CRM to Watchlist: View: Get CRM Trend Analysis ➞ | |
 | SNA Snap-on Incorporated |
| Sector: Industrials | |
| SubSector: Small Tools & Accessories | |
| MarketCap: 5947.26 Millions | |
| Recent Price: 271.34 Smart Investing & Trading Score: 32 | |
| Day Percent Change: 1.04% Day Change: 2.78 | |
| Week Change: 0.94% Year-to-date Change: -6.1% | |
| SNA Links: Profile News Message Board | |
| Charts:- Daily , Weekly | |
| Add SNA to Watchlist: View: Get SNA Trend Analysis ➞ | |
 | MGM MGM Resorts International |
| Sector: Services & Goods | |
| SubSector: Resorts & Casinos | |
| MarketCap: 5315.04 Millions | |
| Recent Price: 42.85 Smart Investing & Trading Score: 32 | |
| Day Percent Change: 0.99% Day Change: 0.42 | |
| Week Change: 1.01% Year-to-date Change: -4.1% | |
| MGM Links: Profile News Message Board | |
| Charts:- Daily , Weekly | |
| Add MGM to Watchlist: View: Get MGM Trend Analysis ➞ | |
 | HD The Home Depot, Inc. |
| Sector: Services & Goods | |
| SubSector: Home Improvement Stores | |
| MarketCap: 185389 Millions | |
| Recent Price: 339.00 Smart Investing & Trading Score: 32 | |
| Day Percent Change: 0.86% Day Change: 2.89 | |
| Week Change: 1.09% Year-to-date Change: -2.2% | |
| HD Links: Profile News Message Board | |
| Charts:- Daily , Weekly | |
| Add HD to Watchlist: View: Get HD Trend Analysis ➞ | |
 | BLK BlackRock, Inc. |
| Sector: Financials | |
| SubSector: Asset Management | |
| MarketCap: 61284.9 Millions | |
| Recent Price: 766.62 Smart Investing & Trading Score: 32 | |
| Day Percent Change: 0.86% Day Change: 6.51 | |
| Week Change: 2.22% Year-to-date Change: -5.6% | |
| BLK Links: Profile News Message Board | |
| Charts:- Daily , Weekly | |
| Add BLK to Watchlist: View: Get BLK Trend Analysis ➞ | |
 | BR Broadridge Financial Solutions, Inc. |
| Sector: Technology | |
| SubSector: Information Technology Services | |
| MarketCap: 10633.8 Millions | |
| Recent Price: 195.91 Smart Investing & Trading Score: 32 | |
| Day Percent Change: 0.86% Day Change: 1.68 | |
| Week Change: 1.31% Year-to-date Change: -4.8% | |
| BR Links: Profile News Message Board | |
| Charts:- Daily , Weekly | |
| Add BR to Watchlist: View: Get BR Trend Analysis ➞ | |
| For tabular summary view of above stock list: Summary View ➞ 0 - 25 , 25 - 50 , 50 - 75 , 75 - 100 , 100 - 125 , 125 - 150 , 150 - 175 , 175 - 200 , 200 - 225 , 225 - 250 , 250 - 275 , 275 - 300 , 300 - 325 , 325 - 350 , 350 - 375 , 375 - 400 , 400 - 425 , 425 - 450 , 450 - 475 , 475 - 500 | ||
| Click To Change The Sort Order: By Market Cap or Company Size Performance: Year-to-date, Week and Day | |
| Select Chart Type: | ||
|
Best Stocks Today 12Stocks.com |
© 2024 12Stocks.com Terms & Conditions Privacy Contact Us
All Information Provided Only For Education And Not To Be Used For Investing or Trading. See Terms & Conditions


One More Thing ... Get Best Stocks Delivered Daily!
Never Ever Miss A Move With Our Top Ten Stocks Lists
Find Best Stocks In Any Market - Bull or Bear Market
Take A Peek At Our Top Ten Stocks Lists: Daily, Weekly, Year-to-Date & Top Trends
Find Best Stocks In Any Market - Bull or Bear Market
Take A Peek At Our Top Ten Stocks Lists: Daily, Weekly, Year-to-Date & Top Trends
S&P 500 Stocks With Best Up Trends [0-bearish to 100-bullish]: Danaher [100], Kimberly-Clark [100], Quest Diagnostics[100], Hasbro [100], Philip Morris[100], Citi [100], American Express[100], Truist Financial[100], Morgan Stanley[100], Federal Realty[100], Bank of America[100]
Best S&P 500 Stocks Year-to-Date:
NVIDIA [66.44%], Constellation [60.75%], Meta Platforms[40.09%], NRG [38.28%], Marathon [34.57%], Progressive [34.37%], Targa Resources[33.54%], Western Digital[33.51%], Micron [31.78%], Diamondback [31.78%], United Airlines[30.95%] Best S&P 500 Stocks This Week:
Globe Life[13.52%], General Electric[9.83%], NVIDIA [8.17%], Danaher [7.47%], Enphase [7.28%], Kimberly-Clark [7.26%], Pulte [6.95%], Norwegian Cruise[6.83%], Ford Motor[6.59%], General Motors[6.44%], Quest Diagnostics[6.43%] Best S&P 500 Stocks Daily:
Globe Life[14.11%], General Electric[8.28%], Danaher [7.21%], Kimberly-Clark [5.51%], Norwegian Cruise[5.39%], United Rentals[5.09%], Quest Diagnostics[5.08%], Builders FirstSource[5.07%], Thermo Fisher[4.78%], Waters [4.70%], Pulte [4.57%]