
 Login Sign Up


| |||||
 |  | ||||

| 12Stocks.com Market Intelligence |
Best S&P 500 Stocks
|
On this page, you will find the most comprehensive analysis of S&P 500 stocks and ETFs - from latest trends to performances to charts ➞. First, here are the year-to-date (YTD) performances of the most requested S&P 500 stocks at 12Stocks.com (click stock for review):
| NVIDIA 79% | ||
| Amazon.com 23% | ||
| Google 20% | ||
| Merck 17% | ||
| Caterpillar 14% | ||
| Walmart 14% | ||
| Goldman Sachs 14% | ||
| JPMorgan Chase 12% | ||
| Microsoft 8% | ||
| Chevron 7% | ||
| Apple -5% | ||
| Johnson & Johnson -5% | ||
| McDonald s -9% | ||
| Gilead -20% | ||
| Starbucks -24% | ||
| Boeing -31% | ||
| Intel -39% | ||
| Quick: S&P 500 Stocks Lists: Performances & Trends, S&P 500 Stock Charts
Sort S&P 500 stocks: Daily, Weekly, Year-to-Date, Market Cap & Trends. Filter S&P 500 stocks list by sector: Show all, Tech, Finance, Energy, Staples, Retail, Industrial, Materials, Utilities and HealthCare |
| 12Stocks.com S&P 500 Stocks Performances & Trends Daily Report | |||||||||
|
| 
The overall Smart Investing & Trading Score is 60 (0-bearish to 100-bullish) which puts S&P 500 index in short term neutral to bullish trend. The Smart Investing & Trading Score from previous trading session is 30 and hence an improvement of trend. | ||||||||
Here are the Smart Investing & Trading Scores of the most requested S&P 500 stocks at 12Stocks.com (click stock name for detailed review):
|


| 12Stocks.com: Top Performing S&P 500 Index Stocks | ||||||||||||||||||||||||||||||||||||||||||||||||
 The top performing S&P 500 Index stocks year to date are
Now, more recently, over last week, the top performing S&P 500 Index stocks on the move are


|
||||||||||||||||||||||||||||||||||||||||||||||||
| 12Stocks.com: Investing in S&P 500 Index with Stocks | |
|
The following table helps investors and traders sort through current performance and trends (as measured by Smart Investing & Trading Score) of various
stocks in the S&P 500 Index. Quick View: Move mouse or cursor over stock symbol (ticker) to view short-term technical chart and over stock name to view long term chart. Click on  to add stock symbol to your watchlist and to add stock symbol to your watchlist and  to view watchlist. Click on any ticker or stock name for detailed market intelligence report for that stock. to view watchlist. Click on any ticker or stock name for detailed market intelligence report for that stock. |
12Stocks.com Performance of Stocks in S&P 500 Index
| Ticker | Stock Name | Watchlist | Category | Recent Price | Smart Investing & Trading Score | Change % | YTD Change% |
| ADI | Analog Devices |   | Technology | 199.63 | 88 | 1.60% | 0.54% |
| NXPI | NXP Semiconductors | | Technology | 257.85 | 88 | 1.41% | 12.26% |
| AMZN | Amazon.com | | Services & Goods | 186.21 | 88 | 0.81% | 22.55% |
| ECL | Ecolab | | Materials | 227.50 | 88 | 0.33% | 14.70% |
| EXR | Extra Space | | Financials | 141.87 | 87 | 1.49% | -11.51% |
| CTAS | Cintas | | Services & Goods | 674.04 | 85 | 1.77% | 11.84% |
| BSX | Boston Scientific | | Health Care | 72.85 | 85 | 1.14% | 26.02% |
| PRU | Prudential Financial | | Financials | 112.26 | 85 | 0.87% | 8.24% |
| CTRA | Contura | | Materials | 28.19 | 83 | 3.79% | 10.46% |
| DE | Deere & | | Industrials | 400.96 | 83 | 1.26% | 0.27% |
| KMI | Kinder Morgan | | Energy | 18.57 | 83 | 0.60% | 5.27% |
| D | Dominion | | Utilities | 51.40 | 83 | 0.47% | 9.36% |
| RJF | Raymond James | | Financials | 124.42 | 83 | 0.36% | 11.59% |
| CNP | CenterPoint | | Utilities | 29.45 | 83 | 0.17% | 3.08% |
| MCHP | Microchip | | Technology | 91.36 | 83 | 2.12% | 1.31% |
| EMN | Eastman Chemical | | Materials | 97.50 | 83 | 1.65% | 8.55% |
| DGX | Quest Diagnostics | | Health Care | 137.38 | 83 | 0.76% | -0.36% |
| PEP | PepsiCo | | Consumer Staples | 176.15 | 83 | 0.40% | 3.72% |
| WAB | Wabtec | | Transports | 162.21 | 83 | 0.20% | 27.83% |
| DLR | Digital Realty | | Financials | 147.00 | 82 | 4.89% | 9.23% |
| WEC | WEC | | Utilities | 83.22 | 81 | 0.17% | -1.13% |
| STT | State Street | | Financials | 74.39 | 78 | 1.63% | -3.96% |
| BK | Bank of New York | | Financials | 57.00 | 78 | 0.71% | 9.51% |
| WMB | Williams | | Energy | 38.67 | 78 | 0.34% | 11.02% |
| HES | Hess | | Energy | 158.86 | 78 | 0.19% | 10.20% |
| For chart view version of above stock list: Chart View ➞ 0 - 25 , 25 - 50 , 50 - 75 , 75 - 100 , 100 - 125 , 125 - 150 , 150 - 175 , 175 - 200 , 200 - 225 , 225 - 250 , 250 - 275 , 275 - 300 , 300 - 325 , 325 - 350 , 350 - 375 , 375 - 400 , 400 - 425 , 425 - 450 , 450 - 475 , 475 - 500 | ||
 | Click To Change The Sort Order: By Market Cap or Company Size Performance: Year-to-date, Week and Day |  |
|
Get the most comprehensive stock market coverage daily at 12Stocks.com ➞ Best Stocks Today ➞ Best Stocks Weekly ➞ Best Stocks Year-to-Date ➞ Best Stocks Trends ➞  Best Stocks Today 12Stocks.com Best Nasdaq Stocks ➞ Best S&P 500 Stocks ➞ Best Tech Stocks ➞ Best Biotech Stocks ➞ |
| Detailed Overview of S&P 500 Stocks |
| S&P 500 Technical Overview, Leaders & Laggards, Top S&P 500 ETF Funds & Detailed S&P 500 Stocks List, Charts, Trends & More |
| S&P 500: Technical Analysis, Trends & YTD Performance | |
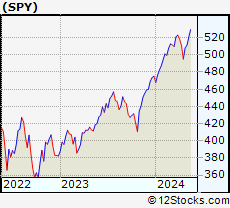
| S&P 500 index as represented by
SPY, an exchange-traded fund [ETF], holds basket of five hundred (mostly largecap) stocks from across all major sectors of the US stock market. The S&P 500 index (contains stocks like Apple and Exxon) is up by 7.57% and is currently outperforming the overall market by 0.69% year-to-date. Below is a quick view of technical charts and trends: | |
 SPY Weekly Chart |
|
| Long Term Trend: Good | |
| Medium Term Trend: Good | |
 SPY Daily Chart |
|
| Short Term Trend: Very Good | |
| Overall Trend Score: 60 | |
| YTD Performance: 7.57% | |
| **Trend Scores & Views Are Only For Educational Purposes And Not For Investing | |
| 12Stocks.com: Investing in S&P 500 Index using Exchange Traded Funds | |
|
The following table shows list of key exchange traded funds (ETF) that
help investors track S&P 500 index. The following list also includes leveraged ETF funds that track twice or thrice the daily returns of S&P 500 indices. Short or inverse ETF funds move in the opposite direction to the index they track and are useful during market pullbacks or during bear markets. Quick View: Move mouse or cursor over ETF symbol (ticker) to view short-term technical chart and over ETF name to view long term chart. Click on ticker or stock name for detailed view. Click on to add stock symbol to your watchlist and to view watchlist. |
12Stocks.com List of ETFs that track S&P 500 Index
| Ticker | ETF Name | Watchlist | Recent Price | Smart Investing & Trading Score | Change % | Week % | Year-to-date % |
| SPY | SPDR S&P 500 ETF | | 511.29 | 60 | 1.24 | 0.6 | 7.57% |
| IVV | iShares Core S&P 500 ETF | | 513.84 | 60 | 1.26 | 0.6 | 7.58% |
| VOO | Vanguard 500 ETF | | 469.98 | 60 | 1.24 | 0.59 | 7.6% |
| OEF | iShares S&P 100 | | 243.74 | 83 | 1.46 | 0.9 | 9.11% |
| SSO | ProShares Ultra S&P500 | | 73.46 | 60 | 2.51 | 1.03 | 12.89% |
| UPRO | ProShares UltraPro S&P500 | | 64.69 | 52 | 3.72 | 1.36 | 18.18% |
| SPXL | Direxion Daily S&P500 Bull 3X ETF | | 122.86 | 52 | 3.73 | 1.42 | 18.15% |
| SH | ProShares Short S&P500 | | 12.23 | 41 | -1.21 | -0.41 | -5.85% |
| SDS | ProShares UltraShort S&P500 | | 26.25 | 28 | -2.42 | -1.06 | -12.27% |
| SPXU | ProShares UltraPro Short S&P500 | | 34.89 | 23 | -3.78 | -1.72 | -18.86% |
| SPXS | Direxion Daily S&P 500 Bear 3X ETF | | 9.46 | 23 | -3.57 | -1.56 | -18.1% |
| 12Stocks.com: Charts, Trends, Fundamental Data and Performances of S&P 500 Stocks | |
|
We now take in-depth look at all S&P 500 stocks including charts, multi-period performances and overall trends (as measured by Smart Investing & Trading Score). One can sort S&P 500 stocks (click link to choose) by Daily, Weekly and by Year-to-Date performances. Also, one can sort by size of the company or by market capitalization. |
| Select Your Default Chart Type: | |||||
| |||||
| Click on stock symbol or name for detailed view. Click on to add stock symbol to your watchlist and to view watchlist. Quick View: Move mouse or cursor over "Daily" to quickly view daily technical stock chart and over "Weekly" to view weekly technical stock chart. | |||||

 | ADI Analog Devices, Inc. |
| Sector: Technology | |
| SubSector: Semiconductor - Integrated Circuits | |
| MarketCap: 32859 Millions | |
| Recent Price: 199.63 Smart Investing & Trading Score: 88 | |
| Day Percent Change: 1.60% Day Change: 3.14 | |
| Week Change: -1.16% Year-to-date Change: 0.5% | |
| ADI Links: Profile News Message Board | |
| Charts:- Daily , Weekly | |
| Add ADI to Watchlist: View: Get ADI Trend Analysis ➞ | |
 | NXPI NXP Semiconductors N.V. |
| Sector: Technology | |
| SubSector: Semiconductor - Broad Line | |
| MarketCap: 22497.9 Millions | |
| Recent Price: 257.85 Smart Investing & Trading Score: 88 | |
| Day Percent Change: 1.41% Day Change: 3.59 | |
| Week Change: 6.24% Year-to-date Change: 12.3% | |
| NXPI Links: Profile News Message Board | |
| Charts:- Daily , Weekly | |
| Add NXPI to Watchlist: View: Get NXPI Trend Analysis ➞ | |
 | AMZN Amazon.com, Inc. |
| Sector: Services & Goods | |
| SubSector: Catalog & Mail Order Houses | |
| MarketCap: 998070 Millions | |
| Recent Price: 186.21 Smart Investing & Trading Score: 88 | |
| Day Percent Change: 0.81% Day Change: 1.49 | |
| Week Change: 3.67% Year-to-date Change: 22.6% | |
| AMZN Links: Profile News Message Board | |
| Charts:- Daily , Weekly | |
| Add AMZN to Watchlist: View: Get AMZN Trend Analysis ➞ | |
 | ECL Ecolab Inc. |
| Sector: Materials | |
| SubSector: Specialty Chemicals | |
| MarketCap: 46215.9 Millions | |
| Recent Price: 227.50 Smart Investing & Trading Score: 88 | |
| Day Percent Change: 0.33% Day Change: 0.74 | |
| Week Change: 2.89% Year-to-date Change: 14.7% | |
| ECL Links: Profile News Message Board | |
| Charts:- Daily , Weekly | |
| Add ECL to Watchlist: View: Get ECL Trend Analysis ➞ | |
 | EXR Extra Space Storage Inc. |
| Sector: Financials | |
| SubSector: REIT - Industrial | |
| MarketCap: 11203.9 Millions | |
| Recent Price: 141.87 Smart Investing & Trading Score: 87 | |
| Day Percent Change: 1.49% Day Change: 2.08 | |
| Week Change: 6.29% Year-to-date Change: -11.5% | |
| EXR Links: Profile News Message Board | |
| Charts:- Daily , Weekly | |
| Add EXR to Watchlist: View: Get EXR Trend Analysis ➞ | |
 | CTAS Cintas Corporation |
| Sector: Services & Goods | |
| SubSector: Business Services | |
| MarketCap: 20154.6 Millions | |
| Recent Price: 674.04 Smart Investing & Trading Score: 85 | |
| Day Percent Change: 1.77% Day Change: 11.75 | |
| Week Change: 1.17% Year-to-date Change: 11.8% | |
| CTAS Links: Profile News Message Board | |
| Charts:- Daily , Weekly | |
| Add CTAS to Watchlist: View: Get CTAS Trend Analysis ➞ | |
 | BSX Boston Scientific Corporation |
| Sector: Health Care | |
| SubSector: Medical Appliances & Equipment | |
| MarketCap: 41541.2 Millions | |
| Recent Price: 72.85 Smart Investing & Trading Score: 85 | |
| Day Percent Change: 1.14% Day Change: 0.82 | |
| Week Change: -0.44% Year-to-date Change: 26.0% | |
| BSX Links: Profile News Message Board | |
| Charts:- Daily , Weekly | |
| Add BSX to Watchlist: View: Get BSX Trend Analysis ➞ | |
 | PRU Prudential Financial, Inc. |
| Sector: Financials | |
| SubSector: Life Insurance | |
| MarketCap: 21001.6 Millions | |
| Recent Price: 112.26 Smart Investing & Trading Score: 85 | |
| Day Percent Change: 0.87% Day Change: 0.97 | |
| Week Change: 1.59% Year-to-date Change: 8.2% | |
| PRU Links: Profile News Message Board | |
| Charts:- Daily , Weekly | |
| Add PRU to Watchlist: View: Get PRU Trend Analysis ➞ | |
 | CTRA Contura Energy, Inc. |
| Sector: Materials | |
| SubSector: Industrial Metals & Minerals | |
| MarketCap: 75.291 Millions | |
| Recent Price: 28.19 Smart Investing & Trading Score: 83 | |
| Day Percent Change: 3.79% Day Change: 1.03 | |
| Week Change: -0.35% Year-to-date Change: 10.5% | |
| CTRA Links: Profile News Message Board | |
| Charts:- Daily , Weekly | |
| Add CTRA to Watchlist: View: Get CTRA Trend Analysis ➞ | |
 | DE Deere & Company |
| Sector: Industrials | |
| SubSector: Farm & Construction Machinery | |
| MarketCap: 39168.7 Millions | |
| Recent Price: 400.96 Smart Investing & Trading Score: 83 | |
| Day Percent Change: 1.26% Day Change: 5.00 | |
| Week Change: 1.94% Year-to-date Change: 0.3% | |
| DE Links: Profile News Message Board | |
| Charts:- Daily , Weekly | |
| Add DE to Watchlist: View: Get DE Trend Analysis ➞ | |
 | KMI Kinder Morgan, Inc. |
| Sector: Energy | |
| SubSector: Oil & Gas Pipelines | |
| MarketCap: 31283.5 Millions | |
| Recent Price: 18.57 Smart Investing & Trading Score: 83 | |
| Day Percent Change: 0.60% Day Change: 0.11 | |
| Week Change: -0.59% Year-to-date Change: 5.3% | |
| KMI Links: Profile News Message Board | |
| Charts:- Daily , Weekly | |
| Add KMI to Watchlist: View: Get KMI Trend Analysis ➞ | |
 | D Dominion Energy, Inc. |
| Sector: Utilities | |
| SubSector: Electric Utilities | |
| MarketCap: 62365.3 Millions | |
| Recent Price: 51.40 Smart Investing & Trading Score: 83 | |
| Day Percent Change: 0.47% Day Change: 0.24 | |
| Week Change: 1.88% Year-to-date Change: 9.4% | |
| D Links: Profile News Message Board | |
| Charts:- Daily , Weekly | |
| Add D to Watchlist: View: Get D Trend Analysis ➞ | |
 | RJF Raymond James Financial, Inc. |
| Sector: Financials | |
| SubSector: Investment Brokerage - Regional | |
| MarketCap: 9490.65 Millions | |
| Recent Price: 124.42 Smart Investing & Trading Score: 83 | |
| Day Percent Change: 0.36% Day Change: 0.45 | |
| Week Change: 2.1% Year-to-date Change: 11.6% | |
| RJF Links: Profile News Message Board | |
| Charts:- Daily , Weekly | |
| Add RJF to Watchlist: View: Get RJF Trend Analysis ➞ | |
 | CNP CenterPoint Energy, Inc. |
| Sector: Utilities | |
| SubSector: Gas Utilities | |
| MarketCap: 7444.07 Millions | |
| Recent Price: 29.45 Smart Investing & Trading Score: 83 | |
| Day Percent Change: 0.17% Day Change: 0.05 | |
| Week Change: 2.08% Year-to-date Change: 3.1% | |
| CNP Links: Profile News Message Board | |
| Charts:- Daily , Weekly | |
| Add CNP to Watchlist: View: Get CNP Trend Analysis ➞ | |
 | MCHP Microchip Technology Incorporated |
| Sector: Technology | |
| SubSector: Semiconductor - Broad Line | |
| MarketCap: 16826.3 Millions | |
| Recent Price: 91.36 Smart Investing & Trading Score: 83 | |
| Day Percent Change: 2.12% Day Change: 1.90 | |
| Week Change: -2.39% Year-to-date Change: 1.3% | |
| MCHP Links: Profile News Message Board | |
| Charts:- Daily , Weekly | |
| Add MCHP to Watchlist: View: Get MCHP Trend Analysis ➞ | |
 | EMN Eastman Chemical Company |
| Sector: Materials | |
| SubSector: Chemicals - Major Diversified | |
| MarketCap: 6217.06 Millions | |
| Recent Price: 97.50 Smart Investing & Trading Score: 83 | |
| Day Percent Change: 1.65% Day Change: 1.58 | |
| Week Change: 2.03% Year-to-date Change: 8.6% | |
| EMN Links: Profile News Message Board | |
| Charts:- Daily , Weekly | |
| Add EMN to Watchlist: View: Get EMN Trend Analysis ➞ | |
 | DGX Quest Diagnostics Incorporated |
| Sector: Health Care | |
| SubSector: Medical Laboratories & Research | |
| MarketCap: 11076.1 Millions | |
| Recent Price: 137.38 Smart Investing & Trading Score: 83 | |
| Day Percent Change: 0.76% Day Change: 1.04 | |
| Week Change: 2.32% Year-to-date Change: -0.4% | |
| DGX Links: Profile News Message Board | |
| Charts:- Daily , Weekly | |
| Add DGX to Watchlist: View: Get DGX Trend Analysis ➞ | |
 | PEP PepsiCo, Inc. |
| Sector: Consumer Staples | |
| SubSector: Beverages - Soft Drinks | |
| MarketCap: 162458 Millions | |
| Recent Price: 176.15 Smart Investing & Trading Score: 83 | |
| Day Percent Change: 0.40% Day Change: 0.70 | |
| Week Change: 0.32% Year-to-date Change: 3.7% | |
| PEP Links: Profile News Message Board | |
| Charts:- Daily , Weekly | |
| Add PEP to Watchlist: View: Get PEP Trend Analysis ➞ | |
 | WAB Wabtec Corporation |
| Sector: Transports | |
| SubSector: Railroads | |
| MarketCap: 8230.22 Millions | |
| Recent Price: 162.21 Smart Investing & Trading Score: 83 | |
| Day Percent Change: 0.20% Day Change: 0.33 | |
| Week Change: -1.31% Year-to-date Change: 27.8% | |
| WAB Links: Profile News Message Board | |
| Charts:- Daily , Weekly | |
| Add WAB to Watchlist: View: Get WAB Trend Analysis ➞ | |
 | DLR Digital Realty Trust, Inc. |
| Sector: Financials | |
| SubSector: REIT - Office | |
| MarketCap: 27038.6 Millions | |
| Recent Price: 147.00 Smart Investing & Trading Score: 82 | |
| Day Percent Change: 4.89% Day Change: 6.85 | |
| Week Change: 2.92% Year-to-date Change: 9.2% | |
| DLR Links: Profile News Message Board | |
| Charts:- Daily , Weekly | |
| Add DLR to Watchlist: View: Get DLR Trend Analysis ➞ | |
 | WEC WEC Energy Group, Inc. |
| Sector: Utilities | |
| SubSector: Electric Utilities | |
| MarketCap: 24852 Millions | |
| Recent Price: 83.22 Smart Investing & Trading Score: 81 | |
| Day Percent Change: 0.17% Day Change: 0.14 | |
| Week Change: 2.12% Year-to-date Change: -1.1% | |
| WEC Links: Profile News Message Board | |
| Charts:- Daily , Weekly | |
| Add WEC to Watchlist: View: Get WEC Trend Analysis ➞ | |
 | STT State Street Corporation |
| Sector: Financials | |
| SubSector: Asset Management | |
| MarketCap: 18623 Millions | |
| Recent Price: 74.39 Smart Investing & Trading Score: 78 | |
| Day Percent Change: 1.63% Day Change: 1.19 | |
| Week Change: 1.36% Year-to-date Change: -4.0% | |
| STT Links: Profile News Message Board | |
| Charts:- Daily , Weekly | |
| Add STT to Watchlist: View: Get STT Trend Analysis ➞ | |
 | BK The Bank of New York Mellon Corporation |
| Sector: Financials | |
| SubSector: Asset Management | |
| MarketCap: 29807.5 Millions | |
| Recent Price: 57.00 Smart Investing & Trading Score: 78 | |
| Day Percent Change: 0.71% Day Change: 0.40 | |
| Week Change: -0.56% Year-to-date Change: 9.5% | |
| BK Links: Profile News Message Board | |
| Charts:- Daily , Weekly | |
| Add BK to Watchlist: View: Get BK Trend Analysis ➞ | |
 | WMB The Williams Companies, Inc. |
| Sector: Energy | |
| SubSector: Oil & Gas Pipelines | |
| MarketCap: 16851.5 Millions | |
| Recent Price: 38.67 Smart Investing & Trading Score: 78 | |
| Day Percent Change: 0.34% Day Change: 0.13 | |
| Week Change: -1.5% Year-to-date Change: 11.0% | |
| WMB Links: Profile News Message Board | |
| Charts:- Daily , Weekly | |
| Add WMB to Watchlist: View: Get WMB Trend Analysis ➞ | |
 | HES Hess Corporation |
| Sector: Energy | |
| SubSector: Independent Oil & Gas | |
| MarketCap: 10465.3 Millions | |
| Recent Price: 158.86 Smart Investing & Trading Score: 78 | |
| Day Percent Change: 0.19% Day Change: 0.30 | |
| Week Change: -2.26% Year-to-date Change: 10.2% | |
| HES Links: Profile News Message Board | |
| Charts:- Daily , Weekly | |
| Add HES to Watchlist: View: Get HES Trend Analysis ➞ | |
| For tabular summary view of above stock list: Summary View ➞ 0 - 25 , 25 - 50 , 50 - 75 , 75 - 100 , 100 - 125 , 125 - 150 , 150 - 175 , 175 - 200 , 200 - 225 , 225 - 250 , 250 - 275 , 275 - 300 , 300 - 325 , 325 - 350 , 350 - 375 , 375 - 400 , 400 - 425 , 425 - 450 , 450 - 475 , 475 - 500 | ||
| Click To Change The Sort Order: By Market Cap or Company Size Performance: Year-to-date, Week and Day | |
| Select Chart Type: | ||
|
Best Stocks Today 12Stocks.com |
© 2024 12Stocks.com Terms & Conditions Privacy Contact Us
All Information Provided Only For Education And Not To Be Used For Investing or Trading. See Terms & Conditions


One More Thing ... Get Best Stocks Delivered Daily!
Never Ever Miss A Move With Our Top Ten Stocks Lists
Find Best Stocks In Any Market - Bull or Bear Market
Take A Peek At Our Top Ten Stocks Lists: Daily, Weekly, Year-to-Date & Top Trends
Find Best Stocks In Any Market - Bull or Bear Market
Take A Peek At Our Top Ten Stocks Lists: Daily, Weekly, Year-to-Date & Top Trends
S&P 500 Stocks With Best Up Trends [0-bearish to 100-bullish]: Amgen [100], First Solar[100], Apple [100], Motorola Solutions[100], Camden Property[100], Aptiv [100], Rollins [100], Teradyne [100], Comerica [100], BorgWarner [100], Bio-Techne [100]
Best S&P 500 Stocks Year-to-Date:
NVIDIA [79.29%], Constellation [66.35%], NRG [48.26%], Chipotle Mexican[37.97%], Western Digital[35.48%], Micron [34.4%], Eaton [33.09%], Progressive [31.04%], Leidos Holdings[30.89%], Diamondback [29.93%], Targa Resources[29.29%] Best S&P 500 Stocks This Week:
Bio-Techne [20.65%], Moderna [15.77%], Garmin [15.7%], C.H. Robinson[15.64%], Amgen [15.3%], Aptiv [13.5%], Amcor [11.59%], BorgWarner [9.79%], Albemarle [9.6%], Pfizer [9.49%], Leidos Holdings[8.68%] Best S&P 500 Stocks Daily:
Amgen [11.82%], Enphase [7.67%], Live Nation[7.24%], First Solar[6.12%], Apple [5.98%], Motorola Solutions[5.19%], Digital Realty[4.89%], Constellation [4.87%], Arista Networks[4.79%], Camden Property[4.53%], Aptiv [3.90%]