
 Login Sign Up


| |||||
 |  | ||||

| 12Stocks.com Market Intelligence |
Best S&P 500 Stocks
|
On this page, you will find the most comprehensive analysis of S&P 500 stocks and ETFs - from latest trends to performances to charts ➞. First, here are the year-to-date (YTD) performances of the most requested S&P 500 stocks at 12Stocks.com (click stock for review):
| NVIDIA 72% | ||
| Amazon.com 20% | ||
| Merck 19% | ||
| Google 18% | ||
| Walmart 13% | ||
| Caterpillar 13% | ||
| JPMorgan Chase 12% | ||
| Goldman Sachs 12% | ||
| Chevron 8% | ||
| Microsoft 6% | ||
| Johnson & Johnson -4% | ||
| McDonald s -7% | ||
| Apple -11% | ||
| Gilead -19% | ||
| Starbucks -23% | ||
| Boeing -32% | ||
| Intel -39% | ||
| Quick: S&P 500 Stocks Lists: Performances & Trends, S&P 500 Stock Charts
Sort S&P 500 stocks: Daily, Weekly, Year-to-Date, Market Cap & Trends. Filter S&P 500 stocks list by sector: Show all, Tech, Finance, Energy, Staples, Retail, Industrial, Materials, Utilities and HealthCare |
| 12Stocks.com S&P 500 Stocks Performances & Trends Daily Report | |||||||||
|
| 
The overall Smart Investing & Trading Score is 17 (0-bearish to 100-bullish) which puts S&P 500 index in short term bearish trend. The Smart Investing & Trading Score from previous trading session is 7 and hence an improvement of trend. | ||||||||
Here are the Smart Investing & Trading Scores of the most requested S&P 500 stocks at 12Stocks.com (click stock name for detailed review):
|


| 12Stocks.com: Top Performing S&P 500 Index Stocks | ||||||||||||||||||||||||||||||||||||||||||||||||
 The top performing S&P 500 Index stocks year to date are
Now, more recently, over last week, the top performing S&P 500 Index stocks on the move are


|
||||||||||||||||||||||||||||||||||||||||||||||||
| 12Stocks.com: Investing in S&P 500 Index with Stocks | |
|
The following table helps investors and traders sort through current performance and trends (as measured by Smart Investing & Trading Score) of various
stocks in the S&P 500 Index. Quick View: Move mouse or cursor over stock symbol (ticker) to view short-term technical chart and over stock name to view long term chart. Click on  to add stock symbol to your watchlist and to add stock symbol to your watchlist and  to view watchlist. Click on any ticker or stock name for detailed market intelligence report for that stock. to view watchlist. Click on any ticker or stock name for detailed market intelligence report for that stock. |
12Stocks.com Performance of Stocks in S&P 500 Index
| Ticker | Stock Name | Watchlist | Category | Recent Price | Smart Investing & Trading Score | Change % | YTD Change% |
| TSCO | Tractor Supply |   | Services & Goods | 267.99 | 63 | -1.17% | 24.63% |
| CINF | Cincinnati Financial | | Financials | 116.15 | 63 | -0.98% | 12.27% |
| UDR | UDR | | Financials | 37.29 | 63 | -0.53% | -2.61% |
| LMT | Lockheed Martin | | Industrials | 460.94 | 63 | -0.17% | 1.70% |
| T | AT&T | | Technology | 16.87 | 62 | -0.30% | 0.54% |
| XEL | Xcel | | Utilities | 53.83 | 61 | 0.09% | -13.05% |
| PXD | Pioneer Natural | | Energy | 270.49 | 61 | 1.06% | 20.28% |
| WFC | Wells Fargo | | Financials | 59.71 | 61 | 0.32% | 21.31% |
| MRK | Merck | | Health Care | 129.22 | 61 | 0.32% | 18.52% |
| UPS | United Parcel | | Transports | 147.42 | 60 | 1.03% | -6.24% |
| ECL | Ecolab | | Materials | 226.08 | 60 | 0.49% | 13.98% |
| PNC | PNC Financial | | Financials | 154.58 | 60 | 0.39% | -0.17% |
| ALB | Albemarle | | Materials | 123.73 | 59 | 3.97% | -14.36% |
| INCY | Incyte | | Health Care | 53.05 | 59 | 0.21% | -15.51% |
| MKTX | MarketAxess Holdings | | Financials | 206.07 | 59 | -0.08% | -29.63% |
| GM | General Motors | | Consumer Staples | 45.04 | 58 | 1.28% | 25.39% |
| MKC | McCormick & | | Consumer Staples | 75.05 | 58 | 0.67% | 9.69% |
| HIG | Hartford Financial | | Financials | 97.75 | 58 | 0.55% | 21.61% |
| AMP | Ameriprise Financial | | Financials | 415.66 | 58 | 0.54% | 9.43% |
| RCL | Royal Caribbean | | Services & Goods | 138.21 | 58 | 0.50% | 6.73% |
| WST | West Pharmaceutical | | Health Care | 364.68 | 58 | 0.34% | 3.57% |
| OMC | Omnicom | | Services & Goods | 93.94 | 58 | 0.31% | 8.59% |
| ROL | Rollins | | Services & Goods | 44.77 | 58 | 0.20% | 2.52% |
| BSX | Boston Scientific | | Health Care | 71.58 | 58 | -0.87% | 23.83% |
| CARR | Carrier Global | | Industrials | 60.81 | 58 | -0.51% | 5.85% |
| For chart view version of above stock list: Chart View ➞ 0 - 25 , 25 - 50 , 50 - 75 , 75 - 100 , 100 - 125 , 125 - 150 , 150 - 175 , 175 - 200 , 200 - 225 , 225 - 250 , 250 - 275 , 275 - 300 , 300 - 325 , 325 - 350 , 350 - 375 , 375 - 400 , 400 - 425 , 425 - 450 , 450 - 475 | ||
 | Click To Change The Sort Order: By Market Cap or Company Size Performance: Year-to-date, Week and Day |  |
|
Get the most comprehensive stock market coverage daily at 12Stocks.com ➞ Best Stocks Today ➞ Best Stocks Weekly ➞ Best Stocks Year-to-Date ➞ Best Stocks Trends ➞  Best Stocks Today 12Stocks.com Best Nasdaq Stocks ➞ Best S&P 500 Stocks ➞ Best Tech Stocks ➞ Best Biotech Stocks ➞ |
| Detailed Overview of S&P 500 Stocks |
| S&P 500 Technical Overview, Leaders & Laggards, Top S&P 500 ETF Funds & Detailed S&P 500 Stocks List, Charts, Trends & More |
| S&P 500: Technical Analysis, Trends & YTD Performance | |
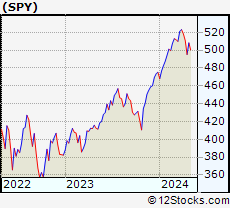
| S&P 500 index as represented by
SPY, an exchange-traded fund [ETF], holds basket of five hundred (mostly largecap) stocks from across all major sectors of the US stock market. The S&P 500 index (contains stocks like Apple and Exxon) is up by 5.83% and is currently outperforming the overall market by 0.68% year-to-date. Below is a quick view of technical charts and trends: | |
 SPY Weekly Chart |
|
| Long Term Trend: Not Good | |
| Medium Term Trend: Not Good | |
 SPY Daily Chart |
|
| Short Term Trend: Deteriorating | |
| Overall Trend Score: 17 | |
| YTD Performance: 5.83% | |
| **Trend Scores & Views Are Only For Educational Purposes And Not For Investing | |
| 12Stocks.com: Investing in S&P 500 Index using Exchange Traded Funds | |
|
The following table shows list of key exchange traded funds (ETF) that
help investors track S&P 500 index. The following list also includes leveraged ETF funds that track twice or thrice the daily returns of S&P 500 indices. Short or inverse ETF funds move in the opposite direction to the index they track and are useful during market pullbacks or during bear markets. Quick View: Move mouse or cursor over ETF symbol (ticker) to view short-term technical chart and over ETF name to view long term chart. Click on ticker or stock name for detailed view. Click on to add stock symbol to your watchlist and to view watchlist. |
12Stocks.com List of ETFs that track S&P 500 Index
| Ticker | ETF Name | Watchlist | Recent Price | Smart Investing & Trading Score | Change % | Week % | Year-to-date % |
| SPY | SPDR S&P 500 ETF | | 503.02 | 17 | 0.53 | -1.03 | 5.83% |
| IVV | iShares Core S&P 500 ETF | | 505.50 | 17 | 0.52 | -1.03 | 5.84% |
| VOO | Vanguard 500 ETF | | 462.39 | 17 | 0.53 | -1.03 | 5.86% |
| OEF | iShares S&P 100 | | 238.79 | 17 | 0.55 | -1.15 | 6.89% |
| SSO | ProShares Ultra S&P500 | | 70.90 | 17 | 0.72 | -2.49 | 8.96% |
| UPRO | ProShares UltraPro S&P500 | | 61.66 | 17 | 1.58 | -3.38 | 12.64% |
| SPXL | Direxion Daily S&P500 Bull 3X ETF | | 117.07 | 17 | 1.49 | -3.36 | 12.58% |
| SH | ProShares Short S&P500 | | 12.44 | 83 | -0.40 | 1.3 | -4.23% |
| SDS | ProShares UltraShort S&P500 | | 27.13 | 83 | -0.99 | 2.26 | -9.32% |
| SPXU | ProShares UltraPro Short S&P500 | | 36.70 | 78 | -1.38 | 3.37 | -14.66% |
| SPXS | Direxion Daily S&P 500 Bear 3X ETF | | 9.93 | 78 | -1.39 | 3.33 | -14.03% |
| 12Stocks.com: Charts, Trends, Fundamental Data and Performances of S&P 500 Stocks | |
|
We now take in-depth look at all S&P 500 stocks including charts, multi-period performances and overall trends (as measured by Smart Investing & Trading Score). One can sort S&P 500 stocks (click link to choose) by Daily, Weekly and by Year-to-Date performances. Also, one can sort by size of the company or by market capitalization. |
| Select Your Default Chart Type: | |||||
| |||||
| Click on stock symbol or name for detailed view. Click on to add stock symbol to your watchlist and to view watchlist. Quick View: Move mouse or cursor over "Daily" to quickly view daily technical stock chart and over "Weekly" to view weekly technical stock chart. | |||||

 | TSCO Tractor Supply Company |
| Sector: Services & Goods | |
| SubSector: Specialty Retail, Other | |
| MarketCap: 9692.94 Millions | |
| Recent Price: 267.99 Smart Investing & Trading Score: 63 | |
| Day Percent Change: -1.17% Day Change: -3.18 | |
| Week Change: -2.16% Year-to-date Change: 24.6% | |
| TSCO Links: Profile News Message Board | |
| Charts:- Daily , Weekly | |
| Add TSCO to Watchlist: View: Get TSCO Trend Analysis ➞ | |
 | CINF Cincinnati Financial Corporation |
| Sector: Financials | |
| SubSector: Property & Casualty Insurance | |
| MarketCap: 13637 Millions | |
| Recent Price: 116.15 Smart Investing & Trading Score: 63 | |
| Day Percent Change: -0.98% Day Change: -1.15 | |
| Week Change: 4.75% Year-to-date Change: 12.3% | |
| CINF Links: Profile News Message Board | |
| Charts:- Daily , Weekly | |
| Add CINF to Watchlist: View: Get CINF Trend Analysis ➞ | |
 | UDR UDR, Inc. |
| Sector: Financials | |
| SubSector: REIT - Residential | |
| MarketCap: 10180.1 Millions | |
| Recent Price: 37.29 Smart Investing & Trading Score: 63 | |
| Day Percent Change: -0.53% Day Change: -0.20 | |
| Week Change: -1.64% Year-to-date Change: -2.6% | |
| UDR Links: Profile News Message Board | |
| Charts:- Daily , Weekly | |
| Add UDR to Watchlist: View: Get UDR Trend Analysis ➞ | |
 | LMT Lockheed Martin Corporation |
| Sector: Industrials | |
| SubSector: Aerospace/Defense Products & Services | |
| MarketCap: 94116.4 Millions | |
| Recent Price: 460.94 Smart Investing & Trading Score: 63 | |
| Day Percent Change: -0.17% Day Change: -0.79 | |
| Week Change: -0.07% Year-to-date Change: 1.7% | |
| LMT Links: Profile News Message Board | |
| Charts:- Daily , Weekly | |
| Add LMT to Watchlist: View: Get LMT Trend Analysis ➞ | |
 | T AT&T Inc. |
| Sector: Technology | |
| SubSector: Telecom Services - Domestic | |
| MarketCap: 224847 Millions | |
| Recent Price: 16.87 Smart Investing & Trading Score: 62 | |
| Day Percent Change: -0.30% Day Change: -0.05 | |
| Week Change: 0.72% Year-to-date Change: 0.5% | |
| T Links: Profile News Message Board | |
| Charts:- Daily , Weekly | |
| Add T to Watchlist: View: Get T Trend Analysis ➞ | |
 | XEL Xcel Energy Inc. |
| Sector: Utilities | |
| SubSector: Electric Utilities | |
| MarketCap: 28960.8 Millions | |
| Recent Price: 53.83 Smart Investing & Trading Score: 61 | |
| Day Percent Change: 0.09% Day Change: 0.05 | |
| Week Change: -0.24% Year-to-date Change: -13.1% | |
| XEL Links: Profile News Message Board | |
| Charts:- Daily , Weekly | |
| Add XEL to Watchlist: View: Get XEL Trend Analysis ➞ | |
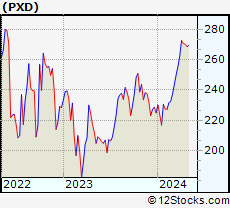 | PXD Pioneer Natural Resources Company |
| Sector: Energy | |
| SubSector: Independent Oil & Gas | |
| MarketCap: 11846.2 Millions | |
| Recent Price: 270.49 Smart Investing & Trading Score: 61 | |
| Day Percent Change: 1.06% Day Change: 2.83 | |
| Week Change: 0.6% Year-to-date Change: 20.3% | |
| PXD Links: Profile News Message Board | |
| Charts:- Daily , Weekly | |
| Add PXD to Watchlist: View: Get PXD Trend Analysis ➞ | |
 | WFC Wells Fargo & Company |
| Sector: Financials | |
| SubSector: Money Center Banks | |
| MarketCap: 129138 Millions | |
| Recent Price: 59.71 Smart Investing & Trading Score: 61 | |
| Day Percent Change: 0.32% Day Change: 0.19 | |
| Week Change: -0.33% Year-to-date Change: 21.3% | |
| WFC Links: Profile News Message Board | |
| Charts:- Daily , Weekly | |
| Add WFC to Watchlist: View: Get WFC Trend Analysis ➞ | |
 | MRK Merck & Co., Inc. |
| Sector: Health Care | |
| SubSector: Drug Manufacturers - Major | |
| MarketCap: 192657 Millions | |
| Recent Price: 129.22 Smart Investing & Trading Score: 61 | |
| Day Percent Change: 0.32% Day Change: 0.41 | |
| Week Change: -1.51% Year-to-date Change: 18.5% | |
| MRK Links: Profile News Message Board | |
| Charts:- Daily , Weekly | |
| Add MRK to Watchlist: View: Get MRK Trend Analysis ➞ | |
 | UPS United Parcel Service, Inc. |
| Sector: Transports | |
| SubSector: Air Delivery & Freight Services | |
| MarketCap: 81928.9 Millions | |
| Recent Price: 147.42 Smart Investing & Trading Score: 60 | |
| Day Percent Change: 1.03% Day Change: 1.50 | |
| Week Change: -0.12% Year-to-date Change: -6.2% | |
| UPS Links: Profile News Message Board | |
| Charts:- Daily , Weekly | |
| Add UPS to Watchlist: View: Get UPS Trend Analysis ➞ | |
 | ECL Ecolab Inc. |
| Sector: Materials | |
| SubSector: Specialty Chemicals | |
| MarketCap: 46215.9 Millions | |
| Recent Price: 226.08 Smart Investing & Trading Score: 60 | |
| Day Percent Change: 0.49% Day Change: 1.10 | |
| Week Change: 2.25% Year-to-date Change: 14.0% | |
| ECL Links: Profile News Message Board | |
| Charts:- Daily , Weekly | |
| Add ECL to Watchlist: View: Get ECL Trend Analysis ➞ | |
 | PNC The PNC Financial Services Group, Inc. |
| Sector: Financials | |
| SubSector: Money Center Banks | |
| MarketCap: 41291.5 Millions | |
| Recent Price: 154.58 Smart Investing & Trading Score: 60 | |
| Day Percent Change: 0.39% Day Change: 0.60 | |
| Week Change: -0.98% Year-to-date Change: -0.2% | |
| PNC Links: Profile News Message Board | |
| Charts:- Daily , Weekly | |
| Add PNC to Watchlist: View: Get PNC Trend Analysis ➞ | |
 | ALB Albemarle Corporation |
| Sector: Materials | |
| SubSector: Specialty Chemicals | |
| MarketCap: 6139.27 Millions | |
| Recent Price: 123.73 Smart Investing & Trading Score: 59 | |
| Day Percent Change: 3.97% Day Change: 4.73 | |
| Week Change: 5.86% Year-to-date Change: -14.4% | |
| ALB Links: Profile News Message Board | |
| Charts:- Daily , Weekly | |
| Add ALB to Watchlist: View: Get ALB Trend Analysis ➞ | |
 | INCY Incyte Corporation |
| Sector: Health Care | |
| SubSector: Biotechnology | |
| MarketCap: 15343.2 Millions | |
| Recent Price: 53.05 Smart Investing & Trading Score: 59 | |
| Day Percent Change: 0.21% Day Change: 0.11 | |
| Week Change: 2.65% Year-to-date Change: -15.5% | |
| INCY Links: Profile News Message Board | |
| Charts:- Daily , Weekly | |
| Add INCY to Watchlist: View: Get INCY Trend Analysis ➞ | |
 | MKTX MarketAxess Holdings Inc. |
| Sector: Financials | |
| SubSector: Investment Brokerage - National | |
| MarketCap: 12431.5 Millions | |
| Recent Price: 206.07 Smart Investing & Trading Score: 59 | |
| Day Percent Change: -0.08% Day Change: -0.17 | |
| Week Change: 2.12% Year-to-date Change: -29.6% | |
| MKTX Links: Profile News Message Board | |
| Charts:- Daily , Weekly | |
| Add MKTX to Watchlist: View: Get MKTX Trend Analysis ➞ | |
 | GM General Motors Company |
| Sector: Consumer Staples | |
| SubSector: Auto Manufacturers - Major | |
| MarketCap: 29252.4 Millions | |
| Recent Price: 45.04 Smart Investing & Trading Score: 58 | |
| Day Percent Change: 1.28% Day Change: 0.57 | |
| Week Change: -1.75% Year-to-date Change: 25.4% | |
| GM Links: Profile News Message Board | |
| Charts:- Daily , Weekly | |
| Add GM to Watchlist: View: Get GM Trend Analysis ➞ | |
 | MKC McCormick & Company, Incorporated |
| Sector: Consumer Staples | |
| SubSector: Processed & Packaged Goods | |
| MarketCap: 18522.8 Millions | |
| Recent Price: 75.05 Smart Investing & Trading Score: 58 | |
| Day Percent Change: 0.67% Day Change: 0.50 | |
| Week Change: -0.9% Year-to-date Change: 9.7% | |
| MKC Links: Profile News Message Board | |
| Charts:- Daily , Weekly | |
| Add MKC to Watchlist: View: Get MKC Trend Analysis ➞ | |
 | HIG The Hartford Financial Services Group, Inc. |
| Sector: Financials | |
| SubSector: Property & Casualty Insurance | |
| MarketCap: 12582.8 Millions | |
| Recent Price: 97.75 Smart Investing & Trading Score: 58 | |
| Day Percent Change: 0.55% Day Change: 0.53 | |
| Week Change: 2.57% Year-to-date Change: 21.6% | |
| HIG Links: Profile News Message Board | |
| Charts:- Daily , Weekly | |
| Add HIG to Watchlist: View: Get HIG Trend Analysis ➞ | |
 | AMP Ameriprise Financial, Inc. |
| Sector: Financials | |
| SubSector: Asset Management | |
| MarketCap: 13270.5 Millions | |
| Recent Price: 415.66 Smart Investing & Trading Score: 58 | |
| Day Percent Change: 0.54% Day Change: 2.22 | |
| Week Change: 1.38% Year-to-date Change: 9.4% | |
| AMP Links: Profile News Message Board | |
| Charts:- Daily , Weekly | |
| Add AMP to Watchlist: View: Get AMP Trend Analysis ➞ | |
 | RCL Royal Caribbean Cruises Ltd. |
| Sector: Services & Goods | |
| SubSector: Resorts & Casinos | |
| MarketCap: 7294.14 Millions | |
| Recent Price: 138.21 Smart Investing & Trading Score: 58 | |
| Day Percent Change: 0.50% Day Change: 0.69 | |
| Week Change: -1.69% Year-to-date Change: 6.7% | |
| RCL Links: Profile News Message Board | |
| Charts:- Daily , Weekly | |
| Add RCL to Watchlist: View: Get RCL Trend Analysis ➞ | |
 | WST West Pharmaceutical Services, Inc. |
| Sector: Health Care | |
| SubSector: Medical Instruments & Supplies | |
| MarketCap: 9989 Millions | |
| Recent Price: 364.68 Smart Investing & Trading Score: 58 | |
| Day Percent Change: 0.34% Day Change: 1.25 | |
| Week Change: 1.18% Year-to-date Change: 3.6% | |
| WST Links: Profile News Message Board | |
| Charts:- Daily , Weekly | |
| Add WST to Watchlist: View: Get WST Trend Analysis ➞ | |
 | OMC Omnicom Group Inc. |
| Sector: Services & Goods | |
| SubSector: Advertising Agencies | |
| MarketCap: 11813.5 Millions | |
| Recent Price: 93.94 Smart Investing & Trading Score: 58 | |
| Day Percent Change: 0.31% Day Change: 0.29 | |
| Week Change: -2.03% Year-to-date Change: 8.6% | |
| OMC Links: Profile News Message Board | |
| Charts:- Daily , Weekly | |
| Add OMC to Watchlist: View: Get OMC Trend Analysis ➞ | |
 | ROL Rollins, Inc. |
| Sector: Services & Goods | |
| SubSector: Business Services | |
| MarketCap: 12827.4 Millions | |
| Recent Price: 44.77 Smart Investing & Trading Score: 58 | |
| Day Percent Change: 0.20% Day Change: 0.09 | |
| Week Change: -0.29% Year-to-date Change: 2.5% | |
| ROL Links: Profile News Message Board | |
| Charts:- Daily , Weekly | |
| Add ROL to Watchlist: View: Get ROL Trend Analysis ➞ | |
 | BSX Boston Scientific Corporation |
| Sector: Health Care | |
| SubSector: Medical Appliances & Equipment | |
| MarketCap: 41541.2 Millions | |
| Recent Price: 71.58 Smart Investing & Trading Score: 58 | |
| Day Percent Change: -0.87% Day Change: -0.63 | |
| Week Change: -2.17% Year-to-date Change: 23.8% | |
| BSX Links: Profile News Message Board | |
| Charts:- Daily , Weekly | |
| Add BSX to Watchlist: View: Get BSX Trend Analysis ➞ | |
 | CARR Carrier Global Corporation |
| Sector: Industrials | |
| SubSector: Building Products & Equipment | |
| MarketCap: 32547 Millions | |
| Recent Price: 60.81 Smart Investing & Trading Score: 58 | |
| Day Percent Change: -0.51% Day Change: -0.31 | |
| Week Change: 0.51% Year-to-date Change: 5.9% | |
| CARR Links: Profile News Message Board | |
| Charts:- Daily , Weekly | |
| Add CARR to Watchlist: View: Get CARR Trend Analysis ➞ | |
| For tabular summary view of above stock list: Summary View ➞ 0 - 25 , 25 - 50 , 50 - 75 , 75 - 100 , 100 - 125 , 125 - 150 , 150 - 175 , 175 - 200 , 200 - 225 , 225 - 250 , 250 - 275 , 275 - 300 , 300 - 325 , 325 - 350 , 350 - 375 , 375 - 400 , 400 - 425 , 425 - 450 , 450 - 475 | ||
| Click To Change The Sort Order: By Market Cap or Company Size Performance: Year-to-date, Week and Day | |
| Select Chart Type: | ||
|
Best Stocks Today 12Stocks.com |
© 2024 12Stocks.com Terms & Conditions Privacy Contact Us
All Information Provided Only For Education And Not To Be Used For Investing or Trading. See Terms & Conditions


One More Thing ... Get Best Stocks Delivered Daily!
Never Ever Miss A Move With Our Top Ten Stocks Lists
Find Best Stocks In Any Market - Bull or Bear Market
Take A Peek At Our Top Ten Stocks Lists: Daily, Weekly, Year-to-Date & Top Trends
Find Best Stocks In Any Market - Bull or Bear Market
Take A Peek At Our Top Ten Stocks Lists: Daily, Weekly, Year-to-Date & Top Trends
S&P 500 Stocks With Best Up Trends [0-bearish to 100-bullish]: C.H. Robinson[100], QUALCOMM [100], BorgWarner [100], Kellogg [100], WestRock [100], Xylem [100], Ventas [100], AES [100], Becton Dickinson[100], Air Products[100], Bio-Techne [100]
Best S&P 500 Stocks Year-to-Date:
NVIDIA [71.87%], Constellation [58.62%], NRG [44.9%], Chipotle Mexican[37.48%], DaVita [35.56%], Western Digital[32.63%], Progressive [32.3%], Eli Lilly[31.37%], Leidos Holdings[31.07%], Micron [30.74%], Targa Resources[29.82%] Best S&P 500 Stocks This Week:
C.H. Robinson[18.73%], Bio-Techne [16.16%], Garmin [14.63%], QUALCOMM [8.98%], Leidos Holdings[8.83%], Pfizer [8.23%], AES [7.82%], BorgWarner [7.56%], WestRock [7.51%], Corning [7.02%], Tesla [6.38%] Best S&P 500 Stocks Daily:
C.H. Robinson[15.65%], QUALCOMM [10.01%], BorgWarner [8.61%], Kellogg [7.65%], Monolithic Power[7.51%], WestRock [6.05%], Zoetis [5.78%], Xylem [4.44%], Estee Lauder[4.36%], Albemarle [3.97%], MGM Resorts[3.53%]