
 Login Sign Up


| |||||
 |  | ||||

| 12Stocks.com Market Intelligence |
Best S&P 500 Stocks
|
On this page, you will find the most comprehensive analysis of S&P 500 stocks and ETFs - from latest trends to performances to charts ➞. First, here are the year-to-date (YTD) performances of the most requested S&P 500 stocks at 12Stocks.com (click stock for review):
| NVIDIA 68% | ||
| Merck 18% | ||
| Amazon.com 18% | ||
| Google 17% | ||
| JPMorgan Chase 13% | ||
| Walmart 12% | ||
| Caterpillar 12% | ||
| Goldman Sachs 11% | ||
| Chevron 7% | ||
| Microsoft 5% | ||
| Johnson & Johnson -4% | ||
| McDonald s -7% | ||
| Apple -12% | ||
| Gilead -19% | ||
| Starbucks -22% | ||
| Boeing -34% | ||
| Intel -40% | ||
| Quick: S&P 500 Stocks Lists: Performances & Trends, S&P 500 Stock Charts
Sort S&P 500 stocks: Daily, Weekly, Year-to-Date, Market Cap & Trends. Filter S&P 500 stocks list by sector: Show all, Tech, Finance, Energy, Staples, Retail, Industrial, Materials, Utilities and HealthCare |
| 12Stocks.com S&P 500 Stocks Performances & Trends Daily Report | |||||||||
|
| 
The overall Smart Investing & Trading Score is 7 (0-bearish to 100-bullish) which puts S&P 500 index in short term bearish trend. The Smart Investing & Trading Score from previous trading session is 41 and hence a deterioration of trend. | ||||||||
Here are the Smart Investing & Trading Scores of the most requested S&P 500 stocks at 12Stocks.com (click stock name for detailed review):
|


| 12Stocks.com: Top Performing S&P 500 Index Stocks | ||||||||||||||||||||||||||||||||||||||||||||||||
 The top performing S&P 500 Index stocks year to date are
Now, more recently, over last week, the top performing S&P 500 Index stocks on the move are


|
||||||||||||||||||||||||||||||||||||||||||||||||
| 12Stocks.com: Investing in S&P 500 Index with Stocks | |
|
The following table helps investors and traders sort through current performance and trends (as measured by Smart Investing & Trading Score) of various
stocks in the S&P 500 Index. Quick View: Move mouse or cursor over stock symbol (ticker) to view short-term technical chart and over stock name to view long term chart. Click on  to add stock symbol to your watchlist and to add stock symbol to your watchlist and  to view watchlist. Click on any ticker or stock name for detailed market intelligence report for that stock. to view watchlist. Click on any ticker or stock name for detailed market intelligence report for that stock. |
12Stocks.com Performance of Stocks in S&P 500 Index
| Ticker | Stock Name | Watchlist | Category | Recent Price | Smart Investing & Trading Score | Change % | YTD Change% |
| UDR | UDR |   | Financials | 37.49 | 68 | -1.55% | -2.09% |
| TSCO | Tractor Supply | | Services & Goods | 271.17 | 68 | -0.70% | 26.11% |
| TXN | Texas Instruments | | Technology | 175.20 | 68 | -0.69% | 2.78% |
| WAB | Wabtec | | Transports | 160.54 | 68 | -0.34% | 26.51% |
| IR | Ingersoll Rand | | Industrials | 93.00 | 68 | -0.34% | 20.25% |
| ADP | Automatic Data | | Technology | 247.33 | 67 | 2.25% | 6.16% |
| TFC | Truist Financial | | Financials | 38.05 | 66 | 1.33% | 3.06% |
| AMP | Ameriprise Financial | | Financials | 413.44 | 66 | 0.40% | 8.85% |
| HIG | Hartford Financial | | Financials | 97.22 | 66 | 0.34% | 20.95% |
| CHD | Church & Dwight Co | | Consumer Staples | 106.26 | 66 | -1.51% | 12.37% |
| VTR | Ventas | | Financials | 43.81 | 66 | -1.06% | -12.10% |
| WELL | Welltower | | Financials | 94.36 | 66 | -0.97% | 4.65% |
| CFG | Citizens Financial | | Financials | 34.70 | 65 | 1.73% | 4.71% |
| NXPI | NXP Semiconductors | | Technology | 249.43 | 65 | -2.64% | 8.60% |
| VRSK | Verisk Analytics | | Services & Goods | 232.81 | 64 | 6.81% | -2.53% |
| AJG | Arthur J. | | Financials | 238.80 | 64 | 1.75% | 6.19% |
| MDT | Medtronic | | Health Care | 80.89 | 64 | 0.81% | -1.81% |
| FOXA | Fox | | Services & Goods | 31.33 | 64 | 1.03% | 5.59% |
| CINF | Cincinnati Financial | | Financials | 117.30 | 63 | 1.39% | 13.38% |
| GOOGL | | Technology | 163.86 | 63 | 0.66% | 17.30% | |
| GOOG | | Technology | 165.57 | 63 | 0.56% | 17.48% | |
| HAS | Hasbro | | Consumer Staples | 60.34 | 63 | -1.57% | 18.17% |
| AVB | AvalonBay Communities | | Financials | 187.93 | 63 | -0.87% | 0.38% |
| EQR | Equity Residential | | Financials | 64.04 | 63 | -0.56% | 4.71% |
| NEM | Newmont | | Materials | 40.58 | 63 | -0.15% | -1.96% |
| For chart view version of above stock list: Chart View ➞ 0 - 25 , 25 - 50 , 50 - 75 , 75 - 100 , 100 - 125 , 125 - 150 , 150 - 175 , 175 - 200 , 200 - 225 , 225 - 250 , 250 - 275 , 275 - 300 , 300 - 325 , 325 - 350 , 350 - 375 , 375 - 400 , 400 - 425 , 425 - 450 , 450 - 475 , 475 - 500 | ||
 | Click To Change The Sort Order: By Market Cap or Company Size Performance: Year-to-date, Week and Day |  |
|
Get the most comprehensive stock market coverage daily at 12Stocks.com ➞ Best Stocks Today ➞ Best Stocks Weekly ➞ Best Stocks Year-to-Date ➞ Best Stocks Trends ➞  Best Stocks Today 12Stocks.com Best Nasdaq Stocks ➞ Best S&P 500 Stocks ➞ Best Tech Stocks ➞ Best Biotech Stocks ➞ |
| Detailed Overview of S&P 500 Stocks |
| S&P 500 Technical Overview, Leaders & Laggards, Top S&P 500 ETF Funds & Detailed S&P 500 Stocks List, Charts, Trends & More |
| S&P 500: Technical Analysis, Trends & YTD Performance | |
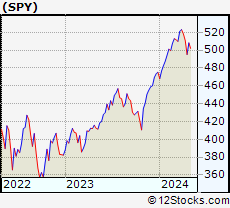
| S&P 500 index as represented by
SPY, an exchange-traded fund [ETF], holds basket of five hundred (mostly largecap) stocks from across all major sectors of the US stock market. The S&P 500 index (contains stocks like Apple and Exxon) is up by 5.27% and is currently outperforming the overall market by 0.73% year-to-date. Below is a quick view of technical charts and trends: | |
 SPY Weekly Chart |
|
| Long Term Trend: Not Good | |
| Medium Term Trend: Not Good | |
 SPY Daily Chart |
|
| Short Term Trend: Not Good | |
| Overall Trend Score: 7 | |
| YTD Performance: 5.27% | |
| **Trend Scores & Views Are Only For Educational Purposes And Not For Investing | |
| 12Stocks.com: Investing in S&P 500 Index using Exchange Traded Funds | |
|
The following table shows list of key exchange traded funds (ETF) that
help investors track S&P 500 index. The following list also includes leveraged ETF funds that track twice or thrice the daily returns of S&P 500 indices. Short or inverse ETF funds move in the opposite direction to the index they track and are useful during market pullbacks or during bear markets. Quick View: Move mouse or cursor over ETF symbol (ticker) to view short-term technical chart and over ETF name to view long term chart. Click on ticker or stock name for detailed view. Click on to add stock symbol to your watchlist and to view watchlist. |
12Stocks.com List of ETFs that track S&P 500 Index
| Ticker | ETF Name | Watchlist | Recent Price | Smart Investing & Trading Score | Change % | Week % | Year-to-date % |
| SPY | SPDR S&P 500 ETF | | 500.35 | 7 | -0.32 | -1.56 | 5.27% |
| IVV | iShares Core S&P 500 ETF | | 502.86 | 7 | -0.31 | -1.55 | 5.28% |
| VOO | Vanguard 500 ETF | | 459.93 | 7 | -0.33 | -1.56 | 5.3% |
| OEF | iShares S&P 100 | | 237.48 | 7 | -0.40 | -1.69 | 6.31% |
| SSO | ProShares Ultra S&P500 | | 70.39 | 7 | -0.68 | -3.19 | 8.18% |
| UPRO | ProShares UltraPro S&P500 | | 60.70 | 7 | -1.14 | -4.89 | 10.89% |
| SPXL | Direxion Daily S&P500 Bull 3X ETF | | 115.35 | 7 | -1.09 | -4.78 | 10.92% |
| SH | ProShares Short S&P500 | | 12.49 | 93 | 0.48 | 1.71 | -3.85% |
| SDS | ProShares UltraShort S&P500 | | 27.40 | 93 | 0.74 | 3.28 | -8.42% |
| SPXU | ProShares UltraPro Short S&P500 | | 37.21 | 88 | 0.98 | 4.82 | -13.47% |
| SPXS | Direxion Daily S&P 500 Bear 3X ETF | | 10.07 | 88 | 1.10 | 4.79 | -12.81% |
| 12Stocks.com: Charts, Trends, Fundamental Data and Performances of S&P 500 Stocks | |
|
We now take in-depth look at all S&P 500 stocks including charts, multi-period performances and overall trends (as measured by Smart Investing & Trading Score). One can sort S&P 500 stocks (click link to choose) by Daily, Weekly and by Year-to-Date performances. Also, one can sort by size of the company or by market capitalization. |
| Select Your Default Chart Type: | |||||
| |||||
| Click on stock symbol or name for detailed view. Click on to add stock symbol to your watchlist and to view watchlist. Quick View: Move mouse or cursor over "Daily" to quickly view daily technical stock chart and over "Weekly" to view weekly technical stock chart. | |||||

 | UDR UDR, Inc. |
| Sector: Financials | |
| SubSector: REIT - Residential | |
| MarketCap: 10180.1 Millions | |
| Recent Price: 37.49 Smart Investing & Trading Score: 68 | |
| Day Percent Change: -1.55% Day Change: -0.59 | |
| Week Change: -1.11% Year-to-date Change: -2.1% | |
| UDR Links: Profile News Message Board | |
| Charts:- Daily , Weekly | |
| Add UDR to Watchlist: View: Get UDR Trend Analysis ➞ | |
 | TSCO Tractor Supply Company |
| Sector: Services & Goods | |
| SubSector: Specialty Retail, Other | |
| MarketCap: 9692.94 Millions | |
| Recent Price: 271.17 Smart Investing & Trading Score: 68 | |
| Day Percent Change: -0.70% Day Change: -1.91 | |
| Week Change: -1% Year-to-date Change: 26.1% | |
| TSCO Links: Profile News Message Board | |
| Charts:- Daily , Weekly | |
| Add TSCO to Watchlist: View: Get TSCO Trend Analysis ➞ | |
 | TXN Texas Instruments Incorporated |
| Sector: Technology | |
| SubSector: Semiconductor - Broad Line | |
| MarketCap: 99509.1 Millions | |
| Recent Price: 175.20 Smart Investing & Trading Score: 68 | |
| Day Percent Change: -0.69% Day Change: -1.22 | |
| Week Change: -1.28% Year-to-date Change: 2.8% | |
| TXN Links: Profile News Message Board | |
| Charts:- Daily , Weekly | |
| Add TXN to Watchlist: View: Get TXN Trend Analysis ➞ | |
 | WAB Wabtec Corporation |
| Sector: Transports | |
| SubSector: Railroads | |
| MarketCap: 8230.22 Millions | |
| Recent Price: 160.54 Smart Investing & Trading Score: 68 | |
| Day Percent Change: -0.34% Day Change: -0.54 | |
| Week Change: -2.32% Year-to-date Change: 26.5% | |
| WAB Links: Profile News Message Board | |
| Charts:- Daily , Weekly | |
| Add WAB to Watchlist: View: Get WAB Trend Analysis ➞ | |
 | IR Ingersoll Rand Inc. |
| Sector: Industrials | |
| SubSector: Diversified Machinery | |
| MarketCap: 8970.56 Millions | |
| Recent Price: 93.00 Smart Investing & Trading Score: 68 | |
| Day Percent Change: -0.34% Day Change: -0.32 | |
| Week Change: -0.53% Year-to-date Change: 20.3% | |
| IR Links: Profile News Message Board | |
| Charts:- Daily , Weekly | |
| Add IR to Watchlist: View: Get IR Trend Analysis ➞ | |
 | ADP Automatic Data Processing, Inc. |
| Sector: Technology | |
| SubSector: Business Software & Services | |
| MarketCap: 54966.5 Millions | |
| Recent Price: 247.33 Smart Investing & Trading Score: 67 | |
| Day Percent Change: 2.25% Day Change: 5.44 | |
| Week Change: 1.75% Year-to-date Change: 6.2% | |
| ADP Links: Profile News Message Board | |
| Charts:- Daily , Weekly | |
| Add ADP to Watchlist: View: Get ADP Trend Analysis ➞ | |
 | TFC Truist Financial Corporation |
| Sector: Financials | |
| SubSector: Regional - Southeast Banks | |
| MarketCap: 44928.5 Millions | |
| Recent Price: 38.05 Smart Investing & Trading Score: 66 | |
| Day Percent Change: 1.33% Day Change: 0.50 | |
| Week Change: -0.31% Year-to-date Change: 3.1% | |
| TFC Links: Profile News Message Board | |
| Charts:- Daily , Weekly | |
| Add TFC to Watchlist: View: Get TFC Trend Analysis ➞ | |
 | AMP Ameriprise Financial, Inc. |
| Sector: Financials | |
| SubSector: Asset Management | |
| MarketCap: 13270.5 Millions | |
| Recent Price: 413.44 Smart Investing & Trading Score: 66 | |
| Day Percent Change: 0.40% Day Change: 1.65 | |
| Week Change: 0.84% Year-to-date Change: 8.9% | |
| AMP Links: Profile News Message Board | |
| Charts:- Daily , Weekly | |
| Add AMP to Watchlist: View: Get AMP Trend Analysis ➞ | |
 | HIG The Hartford Financial Services Group, Inc. |
| Sector: Financials | |
| SubSector: Property & Casualty Insurance | |
| MarketCap: 12582.8 Millions | |
| Recent Price: 97.22 Smart Investing & Trading Score: 66 | |
| Day Percent Change: 0.34% Day Change: 0.33 | |
| Week Change: 2.01% Year-to-date Change: 21.0% | |
| HIG Links: Profile News Message Board | |
| Charts:- Daily , Weekly | |
| Add HIG to Watchlist: View: Get HIG Trend Analysis ➞ | |
 | CHD Church & Dwight Co., Inc. |
| Sector: Consumer Staples | |
| SubSector: Cleaning Products | |
| MarketCap: 17425.7 Millions | |
| Recent Price: 106.26 Smart Investing & Trading Score: 66 | |
| Day Percent Change: -1.51% Day Change: -1.63 | |
| Week Change: -0.06% Year-to-date Change: 12.4% | |
| CHD Links: Profile News Message Board | |
| Charts:- Daily , Weekly | |
| Add CHD to Watchlist: View: Get CHD Trend Analysis ➞ | |
 | VTR Ventas, Inc. |
| Sector: Financials | |
| SubSector: REIT - Healthcare Facilities | |
| MarketCap: 11180.4 Millions | |
| Recent Price: 43.81 Smart Investing & Trading Score: 66 | |
| Day Percent Change: -1.06% Day Change: -0.47 | |
| Week Change: -0.43% Year-to-date Change: -12.1% | |
| VTR Links: Profile News Message Board | |
| Charts:- Daily , Weekly | |
| Add VTR to Watchlist: View: Get VTR Trend Analysis ➞ | |
 | WELL Welltower Inc. |
| Sector: Financials | |
| SubSector: REIT - Healthcare Facilities | |
| MarketCap: 21398.8 Millions | |
| Recent Price: 94.36 Smart Investing & Trading Score: 66 | |
| Day Percent Change: -0.97% Day Change: -0.92 | |
| Week Change: 0.02% Year-to-date Change: 4.7% | |
| WELL Links: Profile News Message Board | |
| Charts:- Daily , Weekly | |
| Add WELL to Watchlist: View: Get WELL Trend Analysis ➞ | |
 | CFG Citizens Financial Group, Inc. |
| Sector: Financials | |
| SubSector: Regional - Mid-Atlantic Banks | |
| MarketCap: 8225.19 Millions | |
| Recent Price: 34.70 Smart Investing & Trading Score: 65 | |
| Day Percent Change: 1.73% Day Change: 0.59 | |
| Week Change: -1.28% Year-to-date Change: 4.7% | |
| CFG Links: Profile News Message Board | |
| Charts:- Daily , Weekly | |
| Add CFG to Watchlist: View: Get CFG Trend Analysis ➞ | |
 | NXPI NXP Semiconductors N.V. |
| Sector: Technology | |
| SubSector: Semiconductor - Broad Line | |
| MarketCap: 22497.9 Millions | |
| Recent Price: 249.43 Smart Investing & Trading Score: 65 | |
| Day Percent Change: -2.64% Day Change: -6.76 | |
| Week Change: 2.77% Year-to-date Change: 8.6% | |
| NXPI Links: Profile News Message Board | |
| Charts:- Daily , Weekly | |
| Add NXPI to Watchlist: View: Get NXPI Trend Analysis ➞ | |
 | VRSK Verisk Analytics, Inc. |
| Sector: Services & Goods | |
| SubSector: Business Services | |
| MarketCap: 22033.2 Millions | |
| Recent Price: 232.81 Smart Investing & Trading Score: 64 | |
| Day Percent Change: 6.81% Day Change: 14.85 | |
| Week Change: 5.28% Year-to-date Change: -2.5% | |
| VRSK Links: Profile News Message Board | |
| Charts:- Daily , Weekly | |
| Add VRSK to Watchlist: View: Get VRSK Trend Analysis ➞ | |
 | AJG Arthur J. Gallagher & Co. |
| Sector: Financials | |
| SubSector: Insurance Brokers | |
| MarketCap: 14852.2 Millions | |
| Recent Price: 238.80 Smart Investing & Trading Score: 64 | |
| Day Percent Change: 1.75% Day Change: 4.11 | |
| Week Change: 2% Year-to-date Change: 6.2% | |
| AJG Links: Profile News Message Board | |
| Charts:- Daily , Weekly | |
| Add AJG to Watchlist: View: Get AJG Trend Analysis ➞ | |
 | MDT Medtronic plc |
| Sector: Health Care | |
| SubSector: Medical Appliances & Equipment | |
| MarketCap: 113698 Millions | |
| Recent Price: 80.89 Smart Investing & Trading Score: 64 | |
| Day Percent Change: 0.81% Day Change: 0.65 | |
| Week Change: 1.44% Year-to-date Change: -1.8% | |
| MDT Links: Profile News Message Board | |
| Charts:- Daily , Weekly | |
| Add MDT to Watchlist: View: Get MDT Trend Analysis ➞ | |
 | FOXA Fox Corporation |
| Sector: Services & Goods | |
| SubSector: Entertainment - Diversified | |
| MarketCap: 13440.7 Millions | |
| Recent Price: 31.33 Smart Investing & Trading Score: 64 | |
| Day Percent Change: 1.03% Day Change: 0.32 | |
| Week Change: 0.38% Year-to-date Change: 5.6% | |
| FOXA Links: Profile News Message Board | |
| Charts:- Daily , Weekly | |
| Add FOXA to Watchlist: View: Get FOXA Trend Analysis ➞ | |
 | CINF Cincinnati Financial Corporation |
| Sector: Financials | |
| SubSector: Property & Casualty Insurance | |
| MarketCap: 13637 Millions | |
| Recent Price: 117.30 Smart Investing & Trading Score: 63 | |
| Day Percent Change: 1.39% Day Change: 1.61 | |
| Week Change: 5.79% Year-to-date Change: 13.4% | |
| CINF Links: Profile News Message Board | |
| Charts:- Daily , Weekly | |
| Add CINF to Watchlist: View: Get CINF Trend Analysis ➞ | |
 | GOOGL Alphabet Inc. |
| Sector: Technology | |
| SubSector: Internet Information Providers | |
| MarketCap: 801264 Millions | |
| Recent Price: 163.86 Smart Investing & Trading Score: 63 | |
| Day Percent Change: 0.66% Day Change: 1.08 | |
| Week Change: -4.7% Year-to-date Change: 17.3% | |
| GOOGL Links: Profile News Message Board | |
| Charts:- Daily , Weekly | |
| Add GOOGL to Watchlist: View: Get GOOGL Trend Analysis ➞ | |
 | GOOG Alphabet Inc. |
| Sector: Technology | |
| SubSector: Internet Information Providers | |
| MarketCap: 730159 Millions | |
| Recent Price: 165.57 Smart Investing & Trading Score: 63 | |
| Day Percent Change: 0.56% Day Change: 0.93 | |
| Week Change: -4.67% Year-to-date Change: 17.5% | |
| GOOG Links: Profile News Message Board | |
| Charts:- Daily , Weekly | |
| Add GOOG to Watchlist: View: Get GOOG Trend Analysis ➞ | |
 | HAS Hasbro, Inc. |
| Sector: Consumer Staples | |
| SubSector: Toys & Games | |
| MarketCap: 7389.5 Millions | |
| Recent Price: 60.34 Smart Investing & Trading Score: 63 | |
| Day Percent Change: -1.57% Day Change: -0.96 | |
| Week Change: -6.41% Year-to-date Change: 18.2% | |
| HAS Links: Profile News Message Board | |
| Charts:- Daily , Weekly | |
| Add HAS to Watchlist: View: Get HAS Trend Analysis ➞ | |
 | AVB AvalonBay Communities, Inc. |
| Sector: Financials | |
| SubSector: REIT - Residential | |
| MarketCap: 19921.9 Millions | |
| Recent Price: 187.93 Smart Investing & Trading Score: 63 | |
| Day Percent Change: -0.87% Day Change: -1.64 | |
| Week Change: -1.84% Year-to-date Change: 0.4% | |
| AVB Links: Profile News Message Board | |
| Charts:- Daily , Weekly | |
| Add AVB to Watchlist: View: Get AVB Trend Analysis ➞ | |
 | EQR Equity Residential |
| Sector: Financials | |
| SubSector: REIT - Residential | |
| MarketCap: 22061.9 Millions | |
| Recent Price: 64.04 Smart Investing & Trading Score: 63 | |
| Day Percent Change: -0.56% Day Change: -0.36 | |
| Week Change: -1.69% Year-to-date Change: 4.7% | |
| EQR Links: Profile News Message Board | |
| Charts:- Daily , Weekly | |
| Add EQR to Watchlist: View: Get EQR Trend Analysis ➞ | |
 | NEM Newmont Corporation |
| Sector: Materials | |
| SubSector: Gold | |
| MarketCap: 33928.8 Millions | |
| Recent Price: 40.58 Smart Investing & Trading Score: 63 | |
| Day Percent Change: -0.15% Day Change: -0.06 | |
| Week Change: -5.03% Year-to-date Change: -2.0% | |
| NEM Links: Profile News Message Board | |
| Charts:- Daily , Weekly | |
| Add NEM to Watchlist: View: Get NEM Trend Analysis ➞ | |
| For tabular summary view of above stock list: Summary View ➞ 0 - 25 , 25 - 50 , 50 - 75 , 75 - 100 , 100 - 125 , 125 - 150 , 150 - 175 , 175 - 200 , 200 - 225 , 225 - 250 , 250 - 275 , 275 - 300 , 300 - 325 , 325 - 350 , 350 - 375 , 375 - 400 , 400 - 425 , 425 - 450 , 450 - 475 , 475 - 500 | ||
| Click To Change The Sort Order: By Market Cap or Company Size Performance: Year-to-date, Week and Day | |
| Select Chart Type: | ||
|
Best Stocks Today 12Stocks.com |
© 2024 12Stocks.com Terms & Conditions Privacy Contact Us
All Information Provided Only For Education And Not To Be Used For Investing or Trading. See Terms & Conditions


One More Thing ... Get Best Stocks Delivered Daily!
Never Ever Miss A Move With Our Top Ten Stocks Lists
Find Best Stocks In Any Market - Bull or Bear Market
Take A Peek At Our Top Ten Stocks Lists: Daily, Weekly, Year-to-Date & Top Trends
Find Best Stocks In Any Market - Bull or Bear Market
Take A Peek At Our Top Ten Stocks Lists: Daily, Weekly, Year-to-Date & Top Trends
S&P 500 Stocks With Best Up Trends [0-bearish to 100-bullish]: Garmin [100], Amcor [100], DuPont de[100], Pfizer [100], American Electric[100], NextEra [100], Arch Capital[100], American Water[100], 3M [100], PPL [100], Pinnacle West[100]
Best S&P 500 Stocks Year-to-Date:
NVIDIA [67.69%], Constellation [57.66%], NRG [42.48%], Chipotle Mexican[37.24%], Western Digital[34.64%], DaVita [33.4%], Eli Lilly[33.25%], Progressive [32.97%], Leidos Holdings[31.37%], Eaton [29.57%], Targa Resources[29.4%] Best S&P 500 Stocks This Week:
Bio-Techne [14.67%], Garmin [13.92%], Amcor [9.25%], Leidos Holdings[9.07%], 3M [7.2%], Pfizer [7.01%], Tesla [6.95%], Corning [6.86%], DuPont de[6.24%], Eli Lilly[5.89%], Cincinnati Financial[5.79%] Best S&P 500 Stocks Daily:
Bio-Techne [16.22%], Garmin [13.12%], Amcor [9.62%], DuPont de[8.01%], Verisk Analytics[6.81%], Pfizer [6.09%], Johnson & Johnson[4.56%], Globe Life[4.35%], Humana [4.01%], Extra Space[3.29%], American Tower[3.08%]