
 Login Sign Up


| |||||
 |  | ||||

| 12Stocks.com Market Intelligence |
Best MidCap Stocks
|
| In a hurry? Mid Cap Stocks Lists: Performance Trends Table, Stock Charts
Sort midcap stocks: Daily, Weekly, Year-to-Date, Market Cap & Trends. Filter midcap stocks list by sector: Show all, Tech, Finance, Energy, Staples, Retail, Industrial, Materials, Utilities and HealthCare Filter midcap stocks list by size:All MidCap Large Mid-Range Small |
| 12Stocks.com Mid Cap Stocks Performances & Trends Daily | |||||||||
|
|  The overall Smart Investing & Trading Score is 30 (0-bearish to 100-bullish) which puts Mid Cap index in short term bearish to neutral trend. The Smart Investing & Trading Score from previous trading session is 7 and hence an improvement of trend.
| ||||||||
Here are the Smart Investing & Trading Scores of the most requested mid cap stocks at 12Stocks.com (click stock name for detailed review):
|


| 12Stocks.com: Top Performing Mid Cap Index Stocks | ||||||||||||||||||||||||||||||||||||||||||||||||
 The top performing Mid Cap Index stocks year to date are
Now, more recently, over last week, the top performing Mid Cap Index stocks on the move are


|
||||||||||||||||||||||||||||||||||||||||||||||||
| 12Stocks.com: Investing in Midcap Index with Stocks | |
|
The following table helps investors and traders sort through current performance and trends (as measured by Smart Investing & Trading Score) of various
stocks in the Midcap Index. Quick View: Move mouse or cursor over stock symbol (ticker) to view short-term technical chart and over stock name to view long term chart. Click on  to add stock symbol to your watchlist and to add stock symbol to your watchlist and  to view watchlist. Click on any ticker or stock name for detailed market intelligence report for that stock. to view watchlist. Click on any ticker or stock name for detailed market intelligence report for that stock. |
12Stocks.com Performance of Stocks in Midcap Index
| Ticker | Stock Name | Watchlist | Category | Recent Price | Smart Investing & Trading Score | Change % | YTD Change% |
| PYCR | Paycor HCM |   | Technology | 16.81 | 0 | -2.66 | -22.39% |
| FSLR | First Solar | | Technology | 172.75 | 36 | -2.72 | 0.27% |
| LNC | Loln National | | Financials | 26.93 | 5 | -2.74 | -0.15% |
| AKAM | Akamai Technologies | | Technology | 98.09 | 10 | -2.77 | -17.11% |
| JAZZ | Jazz | | Health Care | 107.19 | 7 | -2.83 | -12.85% |
| CZR | Caesars Entertainment | | Services & Goods | 35.31 | 18 | -2.94 | -24.68% |
| EBAY | eBay | | Services & Goods | 49.54 | 31 | -2.98 | 13.57% |
| MUSA | Murphy USA | | Services & Goods | 399.38 | 0 | -3.02 | 12.01% |
| HUBS | HubSpot | | Technology | 587.76 | 0 | -3.02 | 1.24% |
| OWL | Blue Owl | | Financials | 18.11 | 26 | -3.26 | 21.63% |
| APA | Apache | | Energy | 29.47 | 10 | -3.38 | -17.87% |
| TFX | Teleflex | | Health Care | 204.38 | 10 | -3.38 | -18.03% |
| ARES | Ares Management | | Financials | 127.22 | 21 | -3.40 | 6.98% |
| AFL | Aflac | | Financials | 81.61 | 41 | -3.51 | -1.08% |
| PCTY | Paylocity Holding | | Technology | 143.93 | 10 | -3.56 | -12.69% |
| HST | Host Hotels | | Financials | 18.15 | 0 | -3.66 | -6.78% |
| ITT | ITT | | Industrials | 124.22 | 0 | -3.91 | 4.11% |
| ARW | Arrow Electronics | | Services & Goods | 119.86 | 26 | -4.00 | -1.96% |
| SHC | Sotera Health | | Health Care | 10.80 | 10 | -4.17 | -35.94% |
| CF | CF Industries | | Materials | 74.67 | 0 | -4.24 | -6.08% |
| NVCR | NovoCure | | Health Care | 12.20 | 35 | -4.24 | -18.29% |
| PH | Parker-Hannifin | | Industrials | 517.80 | 0 | -4.63 | 12.39% |
| AME | AMETEK | | Industrials | 165.85 | 0 | -4.67 | 0.58% |
| XRAY | DENTSPLY SIRONA | | Health Care | 28.75 | 0 | -4.74 | -19.22% |
| VNT | Vontier | | Technology | 38.52 | 0 | -5.17 | 11.49% |
| For chart view version of above stock list: Chart View ➞ 0 - 25 , 25 - 50 , 50 - 75 , 75 - 100 , 100 - 125 , 125 - 150 , 150 - 175 , 175 - 200 , 200 - 225 , 225 - 250 , 250 - 275 , 275 - 300 , 300 - 325 , 325 - 350 , 350 - 375 , 375 - 400 , 400 - 425 , 425 - 450 , 450 - 475 , 475 - 500 , 500 - 525 , 525 - 550 , 550 - 575 , 575 - 600 , 600 - 625 , 625 - 650 , 650 - 675 , 675 - 700 | ||
 | Click To Change The Sort Order: By Market Cap or Company Size Performance: Year-to-date, Week and Day |  |
|
Get the most comprehensive stock market coverage daily at 12Stocks.com ➞ Best Stocks Today ➞ Best Stocks Weekly ➞ Best Stocks Year-to-Date ➞ Best Stocks Trends ➞  Best Stocks Today 12Stocks.com Best Nasdaq Stocks ➞ Best S&P 500 Stocks ➞ Best Tech Stocks ➞ Best Biotech Stocks ➞ |
| Detailed Overview of Midcap Stocks |
| Midcap Technical Overview, Leaders & Laggards, Top Midcap ETF Funds & Detailed Midcap Stocks List, Charts, Trends & More |
| Midcap: Technical Analysis, Trends & YTD Performance | |
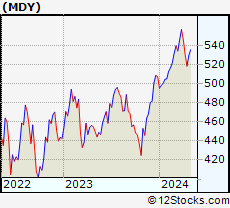
| MidCap segment as represented by
MDY, an exchange-traded fund [ETF], holds basket of about four hundred midcap stocks from across all major sectors of the US stock market. The midcap index (contains stocks like Green Mountain Coffee Roasters and Tractor Supply Company) is up by 3.33% and is currently underperforming the overall market by -1.48% year-to-date. Below is a quick view of technical charts and trends: | |
 MDY Weekly Chart |
|
| Long Term Trend: Not Good | |
| Medium Term Trend: Not Good | |
 MDY Daily Chart |
|
| Short Term Trend: Deteriorating | |
| Overall Trend Score: 30 | |
| YTD Performance: 3.33% | |
| **Trend Scores & Views Are Only For Educational Purposes And Not For Investing | |
| 12Stocks.com: Investing in Midcap Index using Exchange Traded Funds | |
|
The following table shows list of key exchange traded funds (ETF) that
help investors track Midcap index. The following list also includes leveraged ETF funds that track twice or thrice the daily returns of Midcap indices. Short or inverse ETF funds move in the opposite direction to the index they track and are useful during market pullbacks or during bear markets. Quick View: Move mouse or cursor over ETF symbol (ticker) to view short-term technical chart and over ETF name to view long term chart. Click on ticker or stock name for detailed view. Click on to add stock symbol to your watchlist and to view watchlist. |
12Stocks.com List of ETFs that track Midcap Index
| Ticker | ETF Name | Watchlist | Recent Price | Smart Investing & Trading Score | Change % | Week % | Year-to-date % |
| MDY | SPDR S&P MidCap 400 ETF | | 524.29 | 30 | 0.21 | -0.96 | 3.33% |
| SMDD | ProShares UltraPro Short MidCap400 | | 11.93 | 65 | -2.08 | 0.85 | -11.39% |
| UMDD | ProShares UltraPro MidCap400 | | 23.87 | 10 | 3.14 | -0.38 | 6.94% |
| MYY | ProShares Short MidCap400 | | 20.89 | 70 | -0.55 | 0.48 | -2.63% |
| MZZ | ProShares UltraShort MidCap400 | | 11.96 | 53 | 0.00 | 2.4 | -4.86% |
| 12Stocks.com: Charts, Trends, Fundamental Data and Performances of MidCap Stocks | |
|
We now take in-depth look at all MidCap stocks including charts, multi-period performances and overall trends (as measured by Smart Investing & Trading Score). One can sort MidCap stocks (click link to choose) by Daily, Weekly and by Year-to-Date performances. Also, one can sort by size of the company or by market capitalization. |
| Select Your Default Chart Type: | |||||
| |||||
| Click on stock symbol or name for detailed view. Click on to add stock symbol to your watchlist and to view watchlist. Quick View: Move mouse or cursor over "Daily" to quickly view daily technical stock chart and over "Weekly" to view weekly technical stock chart. | |||||

 | PYCR Paycor HCM, Inc. |
| Sector: Technology | |
| SubSector: Software - Application | |
| MarketCap: 4220 Millions | |
| Recent Price: 16.81 Smart Investing & Trading Score: 0 | |
| Day Percent Change: -2.66% Day Change: -0.46 | |
| Week Change: -5.98% Year-to-date Change: -22.4% | |
| PYCR Links: Profile News Message Board | |
| Charts:- Daily , Weekly | |
| Add PYCR to Watchlist: View: Get Complete PYCR Trend Analysis ➞ | |
 | FSLR First Solar, Inc. |
| Sector: Technology | |
| SubSector: Semiconductor - Specialized | |
| MarketCap: 3617.9 Millions | |
| Recent Price: 172.75 Smart Investing & Trading Score: 36 | |
| Day Percent Change: -2.72% Day Change: -4.83 | |
| Week Change: -3.35% Year-to-date Change: 0.3% | |
| FSLR Links: Profile News Message Board | |
| Charts:- Daily , Weekly | |
| Add FSLR to Watchlist: View: Get Complete FSLR Trend Analysis ➞ | |
 | LNC Lincoln National Corporation |
| Sector: Financials | |
| SubSector: Life Insurance | |
| MarketCap: 4545.26 Millions | |
| Recent Price: 26.93 Smart Investing & Trading Score: 5 | |
| Day Percent Change: -2.74% Day Change: -0.76 | |
| Week Change: -3.16% Year-to-date Change: -0.2% | |
| LNC Links: Profile News Message Board | |
| Charts:- Daily , Weekly | |
| Add LNC to Watchlist: View: Get Complete LNC Trend Analysis ➞ | |
 | AKAM Akamai Technologies, Inc. |
| Sector: Technology | |
| SubSector: Internet Information Providers | |
| MarketCap: 14495.5 Millions | |
| Recent Price: 98.09 Smart Investing & Trading Score: 10 | |
| Day Percent Change: -2.77% Day Change: -2.80 | |
| Week Change: -3.53% Year-to-date Change: -17.1% | |
| AKAM Links: Profile News Message Board | |
| Charts:- Daily , Weekly | |
| Add AKAM to Watchlist: View: Get Complete AKAM Trend Analysis ➞ | |
 | JAZZ Jazz Pharmaceuticals plc |
| Sector: Health Care | |
| SubSector: Biotechnology | |
| MarketCap: 5576.05 Millions | |
| Recent Price: 107.19 Smart Investing & Trading Score: 7 | |
| Day Percent Change: -2.83% Day Change: -3.12 | |
| Week Change: -2.07% Year-to-date Change: -12.9% | |
| JAZZ Links: Profile News Message Board | |
| Charts:- Daily , Weekly | |
| Add JAZZ to Watchlist: View: Get Complete JAZZ Trend Analysis ➞ | |
 | CZR Caesars Entertainment Corporation |
| Sector: Services & Goods | |
| SubSector: Resorts & Casinos | |
| MarketCap: 4618.44 Millions | |
| Recent Price: 35.31 Smart Investing & Trading Score: 18 | |
| Day Percent Change: -2.94% Day Change: -1.07 | |
| Week Change: -3.55% Year-to-date Change: -24.7% | |
| CZR Links: Profile News Message Board | |
| Charts:- Daily , Weekly | |
| Add CZR to Watchlist: View: Get Complete CZR Trend Analysis ➞ | |
 | EBAY eBay Inc. |
| Sector: Services & Goods | |
| SubSector: Specialty Retail, Other | |
| MarketCap: 23152.3 Millions | |
| Recent Price: 49.54 Smart Investing & Trading Score: 31 | |
| Day Percent Change: -2.98% Day Change: -1.52 | |
| Week Change: -4.77% Year-to-date Change: 13.6% | |
| EBAY Links: Profile News Message Board | |
| Charts:- Daily , Weekly | |
| Add EBAY to Watchlist: View: Get Complete EBAY Trend Analysis ➞ | |
 | MUSA Murphy USA Inc. |
| Sector: Services & Goods | |
| SubSector: Specialty Retail, Other | |
| MarketCap: 3133.14 Millions | |
| Recent Price: 399.38 Smart Investing & Trading Score: 0 | |
| Day Percent Change: -3.02% Day Change: -12.42 | |
| Week Change: -5.21% Year-to-date Change: 12.0% | |
| MUSA Links: Profile News Message Board | |
| Charts:- Daily , Weekly | |
| Add MUSA to Watchlist: View: Get Complete MUSA Trend Analysis ➞ | |
 | HUBS HubSpot, Inc. |
| Sector: Technology | |
| SubSector: Application Software | |
| MarketCap: 5715.12 Millions | |
| Recent Price: 587.76 Smart Investing & Trading Score: 0 | |
| Day Percent Change: -3.02% Day Change: -18.33 | |
| Week Change: -6.87% Year-to-date Change: 1.2% | |
| HUBS Links: Profile News Message Board | |
| Charts:- Daily , Weekly | |
| Add HUBS to Watchlist: View: Get Complete HUBS Trend Analysis ➞ | |
 | OWL Blue Owl Capital Inc. |
| Sector: Financials | |
| SubSector: Asset Management | |
| MarketCap: 16240 Millions | |
| Recent Price: 18.11 Smart Investing & Trading Score: 26 | |
| Day Percent Change: -3.26% Day Change: -0.61 | |
| Week Change: -3.62% Year-to-date Change: 21.6% | |
| OWL Links: Profile News Message Board | |
| Charts:- Daily , Weekly | |
| Add OWL to Watchlist: View: Get Complete OWL Trend Analysis ➞ | |
 | APA Apache Corporation |
| Sector: Energy | |
| SubSector: Independent Oil & Gas | |
| MarketCap: 1937.53 Millions | |
| Recent Price: 29.47 Smart Investing & Trading Score: 10 | |
| Day Percent Change: -3.38% Day Change: -1.03 | |
| Week Change: -9.3% Year-to-date Change: -17.9% | |
| APA Links: Profile News Message Board | |
| Charts:- Daily , Weekly | |
| Add APA to Watchlist: View: Get Complete APA Trend Analysis ➞ | |
 | TFX Teleflex Incorporated |
| Sector: Health Care | |
| SubSector: Medical Instruments & Supplies | |
| MarketCap: 12989.3 Millions | |
| Recent Price: 204.38 Smart Investing & Trading Score: 10 | |
| Day Percent Change: -3.38% Day Change: -7.16 | |
| Week Change: -1.13% Year-to-date Change: -18.0% | |
| TFX Links: Profile News Message Board | |
| Charts:- Daily , Weekly | |
| Add TFX to Watchlist: View: Get Complete TFX Trend Analysis ➞ | |
 | ARES Ares Management Corporation |
| Sector: Financials | |
| SubSector: Asset Management | |
| MarketCap: 5826.23 Millions | |
| Recent Price: 127.22 Smart Investing & Trading Score: 21 | |
| Day Percent Change: -3.40% Day Change: -4.48 | |
| Week Change: -4.79% Year-to-date Change: 7.0% | |
| ARES Links: Profile News Message Board | |
| Charts:- Daily , Weekly | |
| Add ARES to Watchlist: View: Get Complete ARES Trend Analysis ➞ | |
 | AFL Aflac Incorporated |
| Sector: Financials | |
| SubSector: Accident & Health Insurance | |
| MarketCap: 22706 Millions | |
| Recent Price: 81.61 Smart Investing & Trading Score: 41 | |
| Day Percent Change: -3.51% Day Change: -2.96 | |
| Week Change: -2.4% Year-to-date Change: -1.1% | |
| AFL Links: Profile News Message Board | |
| Charts:- Daily , Weekly | |
| Add AFL to Watchlist: View: Get Complete AFL Trend Analysis ➞ | |
 | PCTY Paylocity Holding Corporation |
| Sector: Technology | |
| SubSector: Application Software | |
| MarketCap: 4972.82 Millions | |
| Recent Price: 143.93 Smart Investing & Trading Score: 10 | |
| Day Percent Change: -3.56% Day Change: -5.31 | |
| Week Change: -8.36% Year-to-date Change: -12.7% | |
| PCTY Links: Profile News Message Board | |
| Charts:- Daily , Weekly | |
| Add PCTY to Watchlist: View: Get Complete PCTY Trend Analysis ➞ | |
 | HST Host Hotels & Resorts, Inc. |
| Sector: Financials | |
| SubSector: REIT - Hotel/Motel | |
| MarketCap: 8253.74 Millions | |
| Recent Price: 18.15 Smart Investing & Trading Score: 0 | |
| Day Percent Change: -3.66% Day Change: -0.69 | |
| Week Change: -3.76% Year-to-date Change: -6.8% | |
| HST Links: Profile News Message Board | |
| Charts:- Daily , Weekly | |
| Add HST to Watchlist: View: Get Complete HST Trend Analysis ➞ | |
 | ITT ITT Inc. |
| Sector: Industrials | |
| SubSector: Diversified Machinery | |
| MarketCap: 3783.06 Millions | |
| Recent Price: 124.22 Smart Investing & Trading Score: 0 | |
| Day Percent Change: -3.91% Day Change: -5.06 | |
| Week Change: -5.32% Year-to-date Change: 4.1% | |
| ITT Links: Profile News Message Board | |
| Charts:- Daily , Weekly | |
| Add ITT to Watchlist: View: Get Complete ITT Trend Analysis ➞ | |
 | ARW Arrow Electronics, Inc. |
| Sector: Services & Goods | |
| SubSector: Electronics Wholesale | |
| MarketCap: 4155.03 Millions | |
| Recent Price: 119.86 Smart Investing & Trading Score: 26 | |
| Day Percent Change: -4.00% Day Change: -4.99 | |
| Week Change: -6.78% Year-to-date Change: -2.0% | |
| ARW Links: Profile News Message Board | |
| Charts:- Daily , Weekly | |
| Add ARW to Watchlist: View: Get Complete ARW Trend Analysis ➞ | |
 | SHC Sotera Health Company |
| Sector: Health Care | |
| SubSector: Diagnostics & Research | |
| MarketCap: 71087 Millions | |
| Recent Price: 10.80 Smart Investing & Trading Score: 10 | |
| Day Percent Change: -4.17% Day Change: -0.47 | |
| Week Change: -5.26% Year-to-date Change: -35.9% | |
| SHC Links: Profile News Message Board | |
| Charts:- Daily , Weekly | |
| Add SHC to Watchlist: View: Get Complete SHC Trend Analysis ➞ | |
 | CF CF Industries Holdings, Inc. |
| Sector: Materials | |
| SubSector: Agricultural Chemicals | |
| MarketCap: 5581.89 Millions | |
| Recent Price: 74.67 Smart Investing & Trading Score: 0 | |
| Day Percent Change: -4.24% Day Change: -3.30 | |
| Week Change: -6.67% Year-to-date Change: -6.1% | |
| CF Links: Profile News Message Board | |
| Charts:- Daily , Weekly | |
| Add CF to Watchlist: View: Get Complete CF Trend Analysis ➞ | |
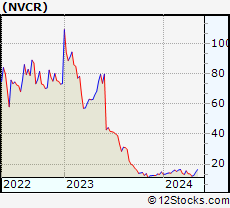 | NVCR NovoCure Limited |
| Sector: Health Care | |
| SubSector: Medical Appliances & Equipment | |
| MarketCap: 5939.5 Millions | |
| Recent Price: 12.20 Smart Investing & Trading Score: 35 | |
| Day Percent Change: -4.24% Day Change: -0.54 | |
| Week Change: -3.44% Year-to-date Change: -18.3% | |
| NVCR Links: Profile News Message Board | |
| Charts:- Daily , Weekly | |
| Add NVCR to Watchlist: View: Get Complete NVCR Trend Analysis ➞ | |
 | PH Parker-Hannifin Corporation |
| Sector: Industrials | |
| SubSector: Industrial Equipment & Components | |
| MarketCap: 14888.9 Millions | |
| Recent Price: 517.80 Smart Investing & Trading Score: 0 | |
| Day Percent Change: -4.63% Day Change: -25.16 | |
| Week Change: -6.47% Year-to-date Change: 12.4% | |
| PH Links: Profile News Message Board | |
| Charts:- Daily , Weekly | |
| Add PH to Watchlist: View: Get Complete PH Trend Analysis ➞ | |
 | AME AMETEK, Inc. |
| Sector: Industrials | |
| SubSector: Diversified Machinery | |
| MarketCap: 16611.8 Millions | |
| Recent Price: 165.85 Smart Investing & Trading Score: 0 | |
| Day Percent Change: -4.67% Day Change: -8.13 | |
| Week Change: -6.57% Year-to-date Change: 0.6% | |
| AME Links: Profile News Message Board | |
| Charts:- Daily , Weekly | |
| Add AME to Watchlist: View: Get Complete AME Trend Analysis ➞ | |
 | XRAY DENTSPLY SIRONA Inc. |
| Sector: Health Care | |
| SubSector: Medical Instruments & Supplies | |
| MarketCap: 7746.1 Millions | |
| Recent Price: 28.75 Smart Investing & Trading Score: 0 | |
| Day Percent Change: -4.74% Day Change: -1.43 | |
| Week Change: -5.95% Year-to-date Change: -19.2% | |
| XRAY Links: Profile News Message Board | |
| Charts:- Daily , Weekly | |
| Add XRAY to Watchlist: View: Get Complete XRAY Trend Analysis ➞ | |
 | VNT Vontier Corporation |
| Sector: Technology | |
| SubSector: Scientific & Technical Instruments | |
| MarketCap: 53787 Millions | |
| Recent Price: 38.52 Smart Investing & Trading Score: 0 | |
| Day Percent Change: -5.17% Day Change: -2.10 | |
| Week Change: -6.55% Year-to-date Change: 11.5% | |
| VNT Links: Profile News Message Board | |
| Charts:- Daily , Weekly | |
| Add VNT to Watchlist: View: Get Complete VNT Trend Analysis ➞ | |
| For tabular summary view of above stock list: Summary View ➞ 0 - 25 , 25 - 50 , 50 - 75 , 75 - 100 , 100 - 125 , 125 - 150 , 150 - 175 , 175 - 200 , 200 - 225 , 225 - 250 , 250 - 275 , 275 - 300 , 300 - 325 , 325 - 350 , 350 - 375 , 375 - 400 , 400 - 425 , 425 - 450 , 450 - 475 , 475 - 500 , 500 - 525 , 525 - 550 , 550 - 575 , 575 - 600 , 600 - 625 , 625 - 650 , 650 - 675 , 675 - 700 | ||
| Click To Change The Sort Order: By Market Cap or Company Size Performance: Year-to-date, Week and Day | |
| Select Chart Type: | ||
|
Best Stocks Today 12Stocks.com |
© 2024 12Stocks.com Terms & Conditions Privacy Contact Us
All Information Provided Only For Education And Not To Be Used For Investing or Trading. See Terms & Conditions


One More Thing ... Get Best Stocks Delivered Daily!
Never Ever Miss A Move With Our Top Ten Stocks Lists
Find Best Stocks In Any Market - Bull or Bear Market
Take A Peek At Our Top Ten Stocks Lists: Daily, Weekly, Year-to-Date & Top Trends
Find Best Stocks In Any Market - Bull or Bear Market
Take A Peek At Our Top Ten Stocks Lists: Daily, Weekly, Year-to-Date & Top Trends
Midcap Stocks With Best Up Trends [0-bearish to 100-bullish]: C.H. Robinson[100], Valmont Industries[100], Kellogg [100], BorgWarner [100], Markel [100], Ventas [100], AXIS Capital[100], Brookfield Renewable[100], Wendy s[100], TFS Financial[100], Xylem [100]
Best Midcap Stocks Year-to-Date:
AppLovin [79.65%], ShockWave Medical[72.96%], EMCOR [63.68%], Constellation Energy[57.57%], CAVA [54.88%], Tenet [53.24%], Natera [48.64%], Wingstop [48.42%], NRG Energy[43.27%], Interactive Brokers[42.41%], Antero Resources[42.2%] Best Midcap Stocks This Week:
Tenet [20.47%], C.H. Robinson[18.91%], Bio-Techne [14.78%], Brookfield Renewable[13.81%], Garmin [13.75%], Valmont Industries[12.67%], Axalta Coating[11.88%], Olaplex [11.57%], New York[11.45%], Maravai LifeSciences[11.17%], Wayfair [10.31%] Best Midcap Stocks Daily:
Avis Budget[16.26%], C.H. Robinson[15.83%], Valmont Industries[13.91%], Wayfair [13.54%], Kellogg [8.65%], Hertz Global[8.50%], Cognex [7.52%], IAC/InterActiveCorp [7.38%], BorgWarner [7.10%], Olaplex [6.79%], WestRock [6.64%]