
 Login Sign Up


| |||||
 |  | ||||

| 12Stocks.com Market Intelligence |
Best MidCap Stocks
|
| In a hurry? Mid Cap Stocks Lists: Performance Trends Table, Stock Charts
Sort midcap stocks: Daily, Weekly, Year-to-Date, Market Cap & Trends. Filter midcap stocks list by sector: Show all, Tech, Finance, Energy, Staples, Retail, Industrial, Materials, Utilities and HealthCare Filter midcap stocks list by size:All MidCap Large Mid-Range Small |
| 12Stocks.com Mid Cap Stocks Performances & Trends Daily | |||||||||
|
|  The overall Smart Investing & Trading Score is 30 (0-bearish to 100-bullish) which puts Mid Cap index in short term bearish to neutral trend. The Smart Investing & Trading Score from previous trading session is 7 and hence an improvement of trend.
| ||||||||
Here are the Smart Investing & Trading Scores of the most requested mid cap stocks at 12Stocks.com (click stock name for detailed review):
|


| 12Stocks.com: Top Performing Mid Cap Index Stocks | ||||||||||||||||||||||||||||||||||||||||||||||||
 The top performing Mid Cap Index stocks year to date are
Now, more recently, over last week, the top performing Mid Cap Index stocks on the move are


|
||||||||||||||||||||||||||||||||||||||||||||||||
| 12Stocks.com: Investing in Midcap Index with Stocks | |
|
The following table helps investors and traders sort through current performance and trends (as measured by Smart Investing & Trading Score) of various
stocks in the Midcap Index. Quick View: Move mouse or cursor over stock symbol (ticker) to view short-term technical chart and over stock name to view long term chart. Click on  to add stock symbol to your watchlist and to add stock symbol to your watchlist and  to view watchlist. Click on any ticker or stock name for detailed market intelligence report for that stock. to view watchlist. Click on any ticker or stock name for detailed market intelligence report for that stock. |
12Stocks.com Performance of Stocks in Midcap Index
| Ticker | Stock Name | Watchlist | Category | Recent Price | Smart Investing & Trading Score | Change % | YTD Change% |
| DOV | Dover |   | Industrials | 176.47 | 53 | -0.77 | 14.74% |
| DRI | Darden Restaurants | | Services & Goods | 149.95 | 0 | -0.79 | -8.73% |
| ES | Eversource Energy | | Utilities | 61.13 | 100 | -0.80 | -0.96% |
| EWBC | East West | | Financials | 74.95 | 60 | -0.81 | 4.17% |
| CG | Carlyle | | Financials | 40.63 | 0 | -0.83 | -0.15% |
| OWL | Blue Owl | | Financials | 18.57 | 26 | -0.83 | 24.68% |
| LYV | Live Nation | | Services & Goods | 88.51 | 18 | -0.86 | -5.44% |
| KMX | CarMax | | Services & Goods | 66.62 | 10 | -0.88 | -13.19% |
| VRSN | VeriSign | | Technology | 169.57 | 0 | -0.88 | -17.67% |
| QGEN | QIAGEN N.V | | Services & Goods | 42.43 | 62 | -0.89 | -2.30% |
| PLTK | Playtika Holding | | Services & Goods | 7.46 | 93 | -0.93 | -13.51% |
| ZBRA | Zebra Technologies | | Technology | 306.13 | 88 | -0.94 | 12.00% |
| RLI | RLI | | Financials | 141.89 | 47 | -0.95 | 6.59% |
| WOOF | Petco Health | | Services & Goods | 1.54 | 20 | -0.96 | -51.11% |
| CINF | Cinnati Financial | | Financials | 116.15 | 63 | -0.98 | 12.27% |
| DNA | Ginkgo Bioworks | | Health Care | 0.83 | 22 | -1.00 | -50.38% |
| CSGP | CoStar | | Financials | 89.45 | 41 | -1.01 | 2.36% |
| NVST | Envista | | Health Care | 19.55 | 37 | -1.01 | -18.74% |
| MTG | MGIC | | Financials | 20.34 | 83 | -1.02 | 5.44% |
| CTAS | Cintas | | Services & Goods | 656.79 | 26 | -1.02 | 8.98% |
| WAT | Waters | | Health Care | 312.58 | 24 | -1.06 | -5.06% |
| LAD | Lithia Motors | | Services & Goods | 251.46 | 0 | -1.06 | -23.63% |
| RYN | Rayonier | | Industrials | 29.46 | 0 | -1.11 | -11.82% |
| SSRM | SSR Mining | | Materials | 5.32 | 68 | -1.12 | -50.56% |
| ST | Sensata Technologies | | Technology | 38.55 | 100 | -1.13 | 2.61% |
| For chart view version of above stock list: Chart View ➞ 0 - 25 , 25 - 50 , 50 - 75 , 75 - 100 , 100 - 125 , 125 - 150 , 150 - 175 , 175 - 200 , 200 - 225 , 225 - 250 , 250 - 275 , 275 - 300 , 300 - 325 , 325 - 350 , 350 - 375 , 375 - 400 , 400 - 425 , 425 - 450 , 450 - 475 , 475 - 500 , 500 - 525 , 525 - 550 , 550 - 575 , 575 - 600 , 600 - 625 , 625 - 650 , 650 - 675 , 675 - 700 | ||
 | Click To Change The Sort Order: By Market Cap or Company Size Performance: Year-to-date, Week and Day |  |
|
Get the most comprehensive stock market coverage daily at 12Stocks.com ➞ Best Stocks Today ➞ Best Stocks Weekly ➞ Best Stocks Year-to-Date ➞ Best Stocks Trends ➞  Best Stocks Today 12Stocks.com Best Nasdaq Stocks ➞ Best S&P 500 Stocks ➞ Best Tech Stocks ➞ Best Biotech Stocks ➞ |
| Detailed Overview of Midcap Stocks |
| Midcap Technical Overview, Leaders & Laggards, Top Midcap ETF Funds & Detailed Midcap Stocks List, Charts, Trends & More |
| Midcap: Technical Analysis, Trends & YTD Performance | |
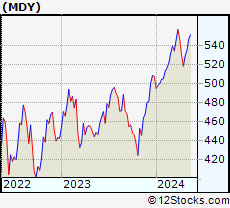
| MidCap segment as represented by
MDY, an exchange-traded fund [ETF], holds basket of about four hundred midcap stocks from across all major sectors of the US stock market. The midcap index (contains stocks like Green Mountain Coffee Roasters and Tractor Supply Company) is up by 3.92% and is currently underperforming the overall market by -1.23% year-to-date. Below is a quick view of technical charts and trends: | |
 MDY Weekly Chart |
|
| Long Term Trend: Not Good | |
| Medium Term Trend: Not Good | |
 MDY Daily Chart |
|
| Short Term Trend: Deteriorating | |
| Overall Trend Score: 30 | |
| YTD Performance: 3.92% | |
| **Trend Scores & Views Are Only For Educational Purposes And Not For Investing | |
| 12Stocks.com: Investing in Midcap Index using Exchange Traded Funds | |
|
The following table shows list of key exchange traded funds (ETF) that
help investors track Midcap index. The following list also includes leveraged ETF funds that track twice or thrice the daily returns of Midcap indices. Short or inverse ETF funds move in the opposite direction to the index they track and are useful during market pullbacks or during bear markets. Quick View: Move mouse or cursor over ETF symbol (ticker) to view short-term technical chart and over ETF name to view long term chart. Click on ticker or stock name for detailed view. Click on to add stock symbol to your watchlist and to view watchlist. |
12Stocks.com List of ETFs that track Midcap Index
| Ticker | ETF Name | Watchlist | Recent Price | Smart Investing & Trading Score | Change % | Week % | Year-to-date % |
| IJH | iShares Core S&P Mid-Cap | | 57.62 | 7 | 0.80 | -0.35 | 3.94% |
| IWR | iShares Russell Mid-Cap | | 79.80 | 7 | 0.40 | -0.9 | 2.66% |
| IWP | iShares Russell Mid-Cap Growth | | 107.74 | 7 | 0.26 | -1.14 | 3.14% |
| MDY | SPDR S&P MidCap 400 ETF | | 527.26 | 30 | 0.77 | -0.4 | 3.92% |
| IWS | iShares Russell Mid-Cap Value | | 119.22 | 20 | 0.38 | -0.64 | 2.52% |
| MZZ | ProShares UltraShort MidCap400 | | 11.89 | 53 | -0.59 | 1.8 | -5.41% |
| SMDD | ProShares UltraPro Short MidCap400 | | 12.09 | 65 | -0.77 | 2.2 | -10.2% |
| MYY | ProShares Short MidCap400 | | 20.93 | 70 | -0.36 | 0.67 | -2.45% |
| UMDD | ProShares UltraPro MidCap400 | | 23.87 | 10 | 3.14 | -0.38 | 6.94% |
| 12Stocks.com: Charts, Trends, Fundamental Data and Performances of MidCap Stocks | |
|
We now take in-depth look at all MidCap stocks including charts, multi-period performances and overall trends (as measured by Smart Investing & Trading Score). One can sort MidCap stocks (click link to choose) by Daily, Weekly and by Year-to-Date performances. Also, one can sort by size of the company or by market capitalization. |
| Select Your Default Chart Type: | |||||
| |||||
| Click on stock symbol or name for detailed view. Click on to add stock symbol to your watchlist and to view watchlist. Quick View: Move mouse or cursor over "Daily" to quickly view daily technical stock chart and over "Weekly" to view weekly technical stock chart. | |||||

 | DOV Dover Corporation |
| Sector: Industrials | |
| SubSector: Diversified Machinery | |
| MarketCap: 10725.6 Millions | |
| Recent Price: 176.47 Smart Investing & Trading Score: 53 | |
| Day Percent Change: -0.77% Day Change: -1.38 | |
| Week Change: -2.05% Year-to-date Change: 14.7% | |
| DOV Links: Profile News Message Board | |
| Charts:- Daily , Weekly | |
| Add DOV to Watchlist: View: Get Complete DOV Trend Analysis ➞ | |
 | DRI Darden Restaurants, Inc. |
| Sector: Services & Goods | |
| SubSector: Restaurants | |
| MarketCap: 5623.1 Millions | |
| Recent Price: 149.95 Smart Investing & Trading Score: 0 | |
| Day Percent Change: -0.79% Day Change: -1.20 | |
| Week Change: -3.94% Year-to-date Change: -8.7% | |
| DRI Links: Profile News Message Board | |
| Charts:- Daily , Weekly | |
| Add DRI to Watchlist: View: Get Complete DRI Trend Analysis ➞ | |
 | ES Eversource Energy |
| Sector: Utilities | |
| SubSector: Diversified Utilities | |
| MarketCap: 23963.4 Millions | |
| Recent Price: 61.13 Smart Investing & Trading Score: 100 | |
| Day Percent Change: -0.80% Day Change: -0.49 | |
| Week Change: 2.81% Year-to-date Change: -1.0% | |
| ES Links: Profile News Message Board | |
| Charts:- Daily , Weekly | |
| Add ES to Watchlist: View: Get Complete ES Trend Analysis ➞ | |
 | EWBC East West Bancorp, Inc. |
| Sector: Financials | |
| SubSector: Foreign Money Center Banks | |
| MarketCap: 4618.31 Millions | |
| Recent Price: 74.95 Smart Investing & Trading Score: 60 | |
| Day Percent Change: -0.81% Day Change: -0.61 | |
| Week Change: -1.36% Year-to-date Change: 4.2% | |
| EWBC Links: Profile News Message Board | |
| Charts:- Daily , Weekly | |
| Add EWBC to Watchlist: View: Get Complete EWBC Trend Analysis ➞ | |
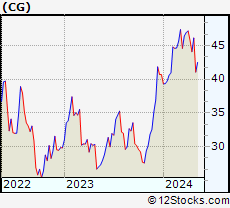 | CG The Carlyle Group Inc. |
| Sector: Financials | |
| SubSector: Asset Management | |
| MarketCap: 7269.33 Millions | |
| Recent Price: 40.63 Smart Investing & Trading Score: 0 | |
| Day Percent Change: -0.83% Day Change: -0.34 | |
| Week Change: -11.88% Year-to-date Change: -0.2% | |
| CG Links: Profile News Message Board | |
| Charts:- Daily , Weekly | |
| Add CG to Watchlist: View: Get Complete CG Trend Analysis ➞ | |
 | OWL Blue Owl Capital Inc. |
| Sector: Financials | |
| SubSector: Asset Management | |
| MarketCap: 16240 Millions | |
| Recent Price: 18.57 Smart Investing & Trading Score: 26 | |
| Day Percent Change: -0.83% Day Change: -0.15 | |
| Week Change: -1.2% Year-to-date Change: 24.7% | |
| OWL Links: Profile News Message Board | |
| Charts:- Daily , Weekly | |
| Add OWL to Watchlist: View: Get Complete OWL Trend Analysis ➞ | |
 | LYV Live Nation Entertainment, Inc. |
| Sector: Services & Goods | |
| SubSector: Entertainment - Diversified | |
| MarketCap: 8457.17 Millions | |
| Recent Price: 88.51 Smart Investing & Trading Score: 18 | |
| Day Percent Change: -0.86% Day Change: -0.77 | |
| Week Change: -1.47% Year-to-date Change: -5.4% | |
| LYV Links: Profile News Message Board | |
| Charts:- Daily , Weekly | |
| Add LYV to Watchlist: View: Get Complete LYV Trend Analysis ➞ | |
 | KMX CarMax, Inc. |
| Sector: Services & Goods | |
| SubSector: Auto Dealerships | |
| MarketCap: 8121.71 Millions | |
| Recent Price: 66.62 Smart Investing & Trading Score: 10 | |
| Day Percent Change: -0.88% Day Change: -0.59 | |
| Week Change: -4.27% Year-to-date Change: -13.2% | |
| KMX Links: Profile News Message Board | |
| Charts:- Daily , Weekly | |
| Add KMX to Watchlist: View: Get Complete KMX Trend Analysis ➞ | |
 | VRSN VeriSign, Inc. |
| Sector: Technology | |
| SubSector: Internet Information Providers | |
| MarketCap: 19657 Millions | |
| Recent Price: 169.57 Smart Investing & Trading Score: 0 | |
| Day Percent Change: -0.88% Day Change: -1.51 | |
| Week Change: -3.37% Year-to-date Change: -17.7% | |
| VRSN Links: Profile News Message Board | |
| Charts:- Daily , Weekly | |
| Add VRSN to Watchlist: View: Get Complete VRSN Trend Analysis ➞ | |
 | QGEN QIAGEN N.V. |
| Sector: Services & Goods | |
| SubSector: Research Services | |
| MarketCap: 8698.94 Millions | |
| Recent Price: 42.43 Smart Investing & Trading Score: 62 | |
| Day Percent Change: -0.89% Day Change: -0.38 | |
| Week Change: 1.87% Year-to-date Change: -2.3% | |
| QGEN Links: Profile News Message Board | |
| Charts:- Daily , Weekly | |
| Add QGEN to Watchlist: View: Get Complete QGEN Trend Analysis ➞ | |
 | PLTK Playtika Holding Corp. |
| Sector: Services & Goods | |
| SubSector: Electronic Gaming & Multimedia | |
| MarketCap: 4260 Millions | |
| Recent Price: 7.46 Smart Investing & Trading Score: 93 | |
| Day Percent Change: -0.93% Day Change: -0.07 | |
| Week Change: 4.34% Year-to-date Change: -13.5% | |
| PLTK Links: Profile News Message Board | |
| Charts:- Daily , Weekly | |
| Add PLTK to Watchlist: View: Get Complete PLTK Trend Analysis ➞ | |
 | ZBRA Zebra Technologies Corporation |
| Sector: Technology | |
| SubSector: Communication Equipment | |
| MarketCap: 11474.9 Millions | |
| Recent Price: 306.13 Smart Investing & Trading Score: 88 | |
| Day Percent Change: -0.94% Day Change: -2.92 | |
| Week Change: 3% Year-to-date Change: 12.0% | |
| ZBRA Links: Profile News Message Board | |
| Charts:- Daily , Weekly | |
| Add ZBRA to Watchlist: View: Get Complete ZBRA Trend Analysis ➞ | |
 | RLI RLI Corp. |
| Sector: Financials | |
| SubSector: Property & Casualty Insurance | |
| MarketCap: 3534.92 Millions | |
| Recent Price: 141.89 Smart Investing & Trading Score: 47 | |
| Day Percent Change: -0.95% Day Change: -1.36 | |
| Week Change: -1.57% Year-to-date Change: 6.6% | |
| RLI Links: Profile News Message Board | |
| Charts:- Daily , Weekly | |
| Add RLI to Watchlist: View: Get Complete RLI Trend Analysis ➞ | |
 | WOOF Petco Health and Wellness Company, Inc. |
| Sector: Services & Goods | |
| SubSector: Specialty Retail | |
| MarketCap: 2030 Millions | |
| Recent Price: 1.54 Smart Investing & Trading Score: 20 | |
| Day Percent Change: -0.96% Day Change: -0.02 | |
| Week Change: 2.32% Year-to-date Change: -51.1% | |
| WOOF Links: Profile News Message Board | |
| Charts:- Daily , Weekly | |
| Add WOOF to Watchlist: View: Get Complete WOOF Trend Analysis ➞ | |
 | CINF Cincinnati Financial Corporation |
| Sector: Financials | |
| SubSector: Property & Casualty Insurance | |
| MarketCap: 13637 Millions | |
| Recent Price: 116.15 Smart Investing & Trading Score: 63 | |
| Day Percent Change: -0.98% Day Change: -1.15 | |
| Week Change: 4.75% Year-to-date Change: 12.3% | |
| CINF Links: Profile News Message Board | |
| Charts:- Daily , Weekly | |
| Add CINF to Watchlist: View: Get Complete CINF Trend Analysis ➞ | |
 | DNA Ginkgo Bioworks Holdings, Inc. |
| Sector: Health Care | |
| SubSector: Biotechnology | |
| MarketCap: 3680 Millions | |
| Recent Price: 0.83 Smart Investing & Trading Score: 22 | |
| Day Percent Change: -1.00% Day Change: -0.01 | |
| Week Change: -3.07% Year-to-date Change: -50.4% | |
| DNA Links: Profile News Message Board | |
| Charts:- Daily , Weekly | |
| Add DNA to Watchlist: View: Get Complete DNA Trend Analysis ➞ | |
 | CSGP CoStar Group, Inc. |
| Sector: Financials | |
| SubSector: Property Management | |
| MarketCap: 21454.4 Millions | |
| Recent Price: 89.45 Smart Investing & Trading Score: 41 | |
| Day Percent Change: -1.01% Day Change: -0.91 | |
| Week Change: -3.45% Year-to-date Change: 2.4% | |
| CSGP Links: Profile News Message Board | |
| Charts:- Daily , Weekly | |
| Add CSGP to Watchlist: View: Get Complete CSGP Trend Analysis ➞ | |
 | NVST Envista Holdings Corporation |
| Sector: Health Care | |
| SubSector: Medical Instruments & Supplies | |
| MarketCap: 2075.8 Millions | |
| Recent Price: 19.55 Smart Investing & Trading Score: 37 | |
| Day Percent Change: -1.01% Day Change: -0.20 | |
| Week Change: -4.12% Year-to-date Change: -18.7% | |
| NVST Links: Profile News Message Board | |
| Charts:- Daily , Weekly | |
| Add NVST to Watchlist: View: Get Complete NVST Trend Analysis ➞ | |
 | MTG MGIC Investment Corporation |
| Sector: Financials | |
| SubSector: Property & Casualty Insurance | |
| MarketCap: 2521.62 Millions | |
| Recent Price: 20.34 Smart Investing & Trading Score: 83 | |
| Day Percent Change: -1.02% Day Change: -0.21 | |
| Week Change: -0.68% Year-to-date Change: 5.4% | |
| MTG Links: Profile News Message Board | |
| Charts:- Daily , Weekly | |
| Add MTG to Watchlist: View: Get Complete MTG Trend Analysis ➞ | |
 | CTAS Cintas Corporation |
| Sector: Services & Goods | |
| SubSector: Business Services | |
| MarketCap: 20154.6 Millions | |
| Recent Price: 656.79 Smart Investing & Trading Score: 26 | |
| Day Percent Change: -1.02% Day Change: -6.80 | |
| Week Change: -1.42% Year-to-date Change: 9.0% | |
| CTAS Links: Profile News Message Board | |
| Charts:- Daily , Weekly | |
| Add CTAS to Watchlist: View: Get Complete CTAS Trend Analysis ➞ | |
 | WAT Waters Corporation |
| Sector: Health Care | |
| SubSector: Medical Instruments & Supplies | |
| MarketCap: 11882 Millions | |
| Recent Price: 312.58 Smart Investing & Trading Score: 24 | |
| Day Percent Change: -1.06% Day Change: -3.34 | |
| Week Change: 0.41% Year-to-date Change: -5.1% | |
| WAT Links: Profile News Message Board | |
| Charts:- Daily , Weekly | |
| Add WAT to Watchlist: View: Get Complete WAT Trend Analysis ➞ | |
 | LAD Lithia Motors, Inc. |
| Sector: Services & Goods | |
| SubSector: Auto Dealerships | |
| MarketCap: 1727.21 Millions | |
| Recent Price: 251.46 Smart Investing & Trading Score: 0 | |
| Day Percent Change: -1.06% Day Change: -2.70 | |
| Week Change: -4.29% Year-to-date Change: -23.6% | |
| LAD Links: Profile News Message Board | |
| Charts:- Daily , Weekly | |
| Add LAD to Watchlist: View: Get Complete LAD Trend Analysis ➞ | |
 | RYN Rayonier Inc. |
| Sector: Industrials | |
| SubSector: Lumber, Wood Production | |
| MarketCap: 3143 Millions | |
| Recent Price: 29.46 Smart Investing & Trading Score: 0 | |
| Day Percent Change: -1.11% Day Change: -0.33 | |
| Week Change: -2.32% Year-to-date Change: -11.8% | |
| RYN Links: Profile News Message Board | |
| Charts:- Daily , Weekly | |
| Add RYN to Watchlist: View: Get Complete RYN Trend Analysis ➞ | |
 | SSRM SSR Mining Inc. |
| Sector: Materials | |
| SubSector: Gold | |
| MarketCap: 1546.09 Millions | |
| Recent Price: 5.32 Smart Investing & Trading Score: 68 | |
| Day Percent Change: -1.12% Day Change: -0.06 | |
| Week Change: -4.49% Year-to-date Change: -50.6% | |
| SSRM Links: Profile News Message Board | |
| Charts:- Daily , Weekly | |
| Add SSRM to Watchlist: View: Get Complete SSRM Trend Analysis ➞ | |
 | ST Sensata Technologies Holding plc |
| Sector: Technology | |
| SubSector: Scientific & Technical Instruments | |
| MarketCap: 4434.23 Millions | |
| Recent Price: 38.55 Smart Investing & Trading Score: 100 | |
| Day Percent Change: -1.13% Day Change: -0.44 | |
| Week Change: 10.21% Year-to-date Change: 2.6% | |
| ST Links: Profile News Message Board | |
| Charts:- Daily , Weekly | |
| Add ST to Watchlist: View: Get Complete ST Trend Analysis ➞ | |
| For tabular summary view of above stock list: Summary View ➞ 0 - 25 , 25 - 50 , 50 - 75 , 75 - 100 , 100 - 125 , 125 - 150 , 150 - 175 , 175 - 200 , 200 - 225 , 225 - 250 , 250 - 275 , 275 - 300 , 300 - 325 , 325 - 350 , 350 - 375 , 375 - 400 , 400 - 425 , 425 - 450 , 450 - 475 , 475 - 500 , 500 - 525 , 525 - 550 , 550 - 575 , 575 - 600 , 600 - 625 , 625 - 650 , 650 - 675 , 675 - 700 | ||
| Click To Change The Sort Order: By Market Cap or Company Size Performance: Year-to-date, Week and Day | |
| Select Chart Type: | ||
|
Best Stocks Today 12Stocks.com |
© 2024 12Stocks.com Terms & Conditions Privacy Contact Us
All Information Provided Only For Education And Not To Be Used For Investing or Trading. See Terms & Conditions


One More Thing ... Get Best Stocks Delivered Daily!
Never Ever Miss A Move With Our Top Ten Stocks Lists
Find Best Stocks In Any Market - Bull or Bear Market
Take A Peek At Our Top Ten Stocks Lists: Daily, Weekly, Year-to-Date & Top Trends
Find Best Stocks In Any Market - Bull or Bear Market
Take A Peek At Our Top Ten Stocks Lists: Daily, Weekly, Year-to-Date & Top Trends
Midcap Stocks With Best Up Trends [0-bearish to 100-bullish]: Valmont Industries[100], C.H. Robinson[100], BorgWarner [100], Kellogg [100], Markel [100], AXIS Capital[100], Xylem [100], Sarepta [100], Brookfield Renewable[100], Wendy s[100], Ventas [100]
Best Midcap Stocks Year-to-Date:
AppLovin [80.75%], ShockWave Medical[72.96%], EMCOR [64.84%], Constellation Energy[58.62%], CAVA [56.54%], Tenet [54.11%], Wingstop [52%], Natera [48.53%], NRG Energy[44.9%], Interactive Brokers[43.9%], Antero Resources[43.12%] Best Midcap Stocks This Week:
Olaplex [24.63%], Tenet [21.15%], C.H. Robinson[18.73%], Valmont Industries[16.61%], Bio-Techne [16.16%], Avis Budget[15.1%], Garmin [14.63%], Brookfield Renewable[14.24%], Hertz Global[13.12%], New York[12.63%], Maravai LifeSciences[12.53%] Best Midcap Stocks Daily:
Avis Budget[22.39%], Olaplex [19.29%], Valmont Industries[17.90%], C.H. Robinson[15.65%], Wayfair [12.43%], Hertz Global[11.86%], Coinbase Global[10.36%], BorgWarner [8.61%], Kellogg [7.65%], Monolithic Power[7.51%], IAC/InterActiveCorp [7.23%]