
 Login Sign Up


| |||||
 |  | ||||

| 12Stocks.com Market Intelligence |
Best MidCap Stocks
|
| In a hurry? Mid Cap Stocks Lists: Performance Trends Table, Stock Charts
Sort midcap stocks: Daily, Weekly, Year-to-Date, Market Cap & Trends. Filter midcap stocks list by sector: Show all, Tech, Finance, Energy, Staples, Retail, Industrial, Materials, Utilities and HealthCare Filter midcap stocks list by size:All MidCap Large Mid-Range Small |
| 12Stocks.com Mid Cap Stocks Performances & Trends Daily | |||||||||
|
|  The overall Smart Investing & Trading Score is 7 (0-bearish to 100-bullish) which puts Mid Cap index in short term bearish trend. The Smart Investing & Trading Score from previous trading session is 38 and hence a deterioration of trend.
| ||||||||
Here are the Smart Investing & Trading Scores of the most requested mid cap stocks at 12Stocks.com (click stock name for detailed review):
|


| 12Stocks.com: Top Performing Mid Cap Index Stocks | ||||||||||||||||||||||||||||||||||||||||||||||||
 The top performing Mid Cap Index stocks year to date are
Now, more recently, over last week, the top performing Mid Cap Index stocks on the move are


|
||||||||||||||||||||||||||||||||||||||||||||||||
| 12Stocks.com: Investing in Midcap Index with Stocks | |
|
The following table helps investors and traders sort through current performance and trends (as measured by Smart Investing & Trading Score) of various
stocks in the Midcap Index. Quick View: Move mouse or cursor over stock symbol (ticker) to view short-term technical chart and over stock name to view long term chart. Click on  to add stock symbol to your watchlist and to add stock symbol to your watchlist and  to view watchlist. Click on any ticker or stock name for detailed market intelligence report for that stock. to view watchlist. Click on any ticker or stock name for detailed market intelligence report for that stock. |
12Stocks.com Performance of Stocks in Midcap Index
| Ticker | Stock Name | Watchlist | Category | Recent Price | Smart Investing & Trading Score | Change % | YTD Change% |
| IART | Integra LifeSciences |   | Health Care | 29.18 | 49 | 0.03 | -33.00% |
| BFAM | Bright Horizons | | Services & Goods | 103.73 | 0 | 0.02 | 10.07% |
| BR | Broadridge Financial | | Technology | 193.43 | 25 | 0.01 | -5.99% |
| SPB | Spectrum | | Consumer Staples | 81.88 | 58 | 0.01 | 2.65% |
| CRI | Carter s | | Consumer Staples | 68.41 | 0 | 0.00 | -8.65% |
| LKQ | LKQ | | Consumer Staples | 43.13 | 10 | 0.00 | -9.75% |
| ADT | ADT | | Services & Goods | 6.50 | 45 | 0.00 | -4.69% |
| MCW | Mister Car | | Services & Goods | 6.69 | 10 | 0.00 | -22.34% |
| DHI | D.R. Horton | | Industrials | 142.48 | 10 | -0.01 | -6.25% |
| RL | Ralph Lauren | | Consumer Staples | 163.62 | 22 | -0.01 | 13.47% |
| LH | Laboratory | | Health Care | 201.32 | 35 | -0.02 | -11.43% |
| VNT | Vontier | | Technology | 40.62 | 17 | -0.02 | 17.57% |
| PNR | Pentair | | Industrials | 79.07 | 36 | -0.03 | 8.75% |
| HOG | Harley-Davidson | | Consumer Staples | 34.38 | 10 | -0.03 | -6.68% |
| AKAM | Akamai Technologies | | Technology | 100.89 | 29 | -0.04 | -14.75% |
| TRIP | TripAdvisor | | Technology | 26.32 | 12 | -0.04 | 22.25% |
| BWXT | BWX Technologies | | Industrials | 95.73 | 40 | -0.04 | 24.76% |
| BK | Bank of New York | | Financials | 56.46 | 28 | -0.05 | 8.47% |
| ITT | ITT | | Industrials | 129.28 | 41 | -0.05 | 8.35% |
| TTWO | Take-Two Interactive | | Technology | 142.74 | 34 | -0.05 | -11.31% |
| SYF | Synchrony Financial | | Financials | 43.96 | 63 | -0.05 | 15.11% |
| VVV | Valvoline | | Energy | 42.50 | 52 | -0.05 | 13.09% |
| WEC | WEC Energy | | Utilities | 82.59 | 90 | -0.06 | -1.88% |
| AOS | A. O. | | Industrials | 82.79 | 31 | -0.06 | 0.42% |
| BAX | Baxter | | Health Care | 40.34 | 35 | -0.07 | 4.35% |
| For chart view version of above stock list: Chart View ➞ 0 - 25 , 25 - 50 , 50 - 75 , 75 - 100 , 100 - 125 , 125 - 150 , 150 - 175 , 175 - 200 , 200 - 225 , 225 - 250 , 250 - 275 , 275 - 300 , 300 - 325 , 325 - 350 , 350 - 375 , 375 - 400 , 400 - 425 , 425 - 450 , 450 - 475 , 475 - 500 , 500 - 525 , 525 - 550 , 550 - 575 , 575 - 600 , 600 - 625 , 625 - 650 , 650 - 675 , 675 - 700 , 700 - 725 , 725 - 750 , 750 - 775 | ||
 | Click To Change The Sort Order: By Market Cap or Company Size Performance: Year-to-date, Week and Day |  |
|
Get the most comprehensive stock market coverage daily at 12Stocks.com ➞ Best Stocks Today ➞ Best Stocks Weekly ➞ Best Stocks Year-to-Date ➞ Best Stocks Trends ➞  Best Stocks Today 12Stocks.com Best Nasdaq Stocks ➞ Best S&P 500 Stocks ➞ Best Tech Stocks ➞ Best Biotech Stocks ➞ |
| Detailed Overview of Midcap Stocks |
| Midcap Technical Overview, Leaders & Laggards, Top Midcap ETF Funds & Detailed Midcap Stocks List, Charts, Trends & More |
| Midcap: Technical Analysis, Trends & YTD Performance | |
| MidCap segment as represented by
MDY, an exchange-traded fund [ETF], holds basket of about four hundred midcap stocks from across all major sectors of the US stock market. The midcap index (contains stocks like Green Mountain Coffee Roasters and Tractor Supply Company) is up by 3.12% and is currently underperforming the overall market by -1.42% year-to-date. Below is a quick view of technical charts and trends: | |
 MDY Weekly Chart |
|
| Long Term Trend: Not Good | |
| Medium Term Trend: Not Good | |
 MDY Daily Chart |
|
| Short Term Trend: Not Good | |
| Overall Trend Score: 7 | |
| YTD Performance: 3.12% | |
| **Trend Scores & Views Are Only For Educational Purposes And Not For Investing | |
| 12Stocks.com: Investing in Midcap Index using Exchange Traded Funds | |
|
The following table shows list of key exchange traded funds (ETF) that
help investors track Midcap index. The following list also includes leveraged ETF funds that track twice or thrice the daily returns of Midcap indices. Short or inverse ETF funds move in the opposite direction to the index they track and are useful during market pullbacks or during bear markets. Quick View: Move mouse or cursor over ETF symbol (ticker) to view short-term technical chart and over ETF name to view long term chart. Click on ticker or stock name for detailed view. Click on to add stock symbol to your watchlist and to view watchlist. |
12Stocks.com List of ETFs that track Midcap Index
| Ticker | ETF Name | Watchlist | Recent Price | Smart Investing & Trading Score | Change % | Week % | Year-to-date % |
| IJH | iShares Core S&P Mid-Cap | | 57.16 | 7 | 0.05 | -1.14 | 3.12% |
| MDY | SPDR S&P MidCap 400 ETF | | 523.21 | 7 | 0.09 | -1.17 | 3.12% |
| IWR | iShares Russell Mid-Cap | | 79.48 | 7 | -0.18 | -1.29 | 2.25% |
| IWP | iShares Russell Mid-Cap Growth | | 107.46 | 7 | 0.02 | -1.39 | 2.87% |
| IWS | iShares Russell Mid-Cap Value | | 118.77 | 20 | -0.08 | -1.02 | 2.13% |
| IJK | iShares S&P Mid-Cap 400 Growth | | 85.83 | 20 | -0.01 | -1.34 | 8.34% |
| IJJ | iShares S&P Mid-Cap 400 Value | | 111.28 | 22 | 0.20 | -0.85 | -2.42% |
| XMLV | PowerShares S&P MidCap Low Volatil ETF | | 54.70 | 65 | 0.48 | 0.09 | 2.86% |
| MVV | ProShares Ultra MidCap400 | | 59.96 | 7 | 0.12 | -2.39 | 3.58% |
| SMDD | ProShares UltraPro Short MidCap400 | | 12.18 | 88 | -0.21 | 2.99 | -9.5% |
| UMDD | ProShares UltraPro MidCap400 | | 23.14 | 0 | -0.50 | -3.41 | 3.69% |
| MZZ | ProShares UltraShort MidCap400 | | 11.96 | 53 | 1.18 | 2.4 | -4.86% |
| MYY | ProShares Short MidCap400 | | 21.00 | 75 | 0.45 | 1.03 | -2.1% |
| 12Stocks.com: Charts, Trends, Fundamental Data and Performances of MidCap Stocks | |
|
We now take in-depth look at all MidCap stocks including charts, multi-period performances and overall trends (as measured by Smart Investing & Trading Score). One can sort MidCap stocks (click link to choose) by Daily, Weekly and by Year-to-Date performances. Also, one can sort by size of the company or by market capitalization. |
| Select Your Default Chart Type: | |||||
| |||||
| Click on stock symbol or name for detailed view. Click on to add stock symbol to your watchlist and to view watchlist. Quick View: Move mouse or cursor over "Daily" to quickly view daily technical stock chart and over "Weekly" to view weekly technical stock chart. | |||||

 | IART Integra LifeSciences Holdings Corporation |
| Sector: Health Care | |
| SubSector: Medical Instruments & Supplies | |
| MarketCap: 3510.4 Millions | |
| Recent Price: 29.18 Smart Investing & Trading Score: 49 | |
| Day Percent Change: 0.03% Day Change: 0.01 | |
| Week Change: 2.96% Year-to-date Change: -33.0% | |
| IART Links: Profile News Message Board | |
| Charts:- Daily , Weekly | |
| Add IART to Watchlist: View: Get Complete IART Trend Analysis ➞ | |
 | BFAM Bright Horizons Family Solutions Inc. |
| Sector: Services & Goods | |
| SubSector: Personal Services | |
| MarketCap: 5487.65 Millions | |
| Recent Price: 103.73 Smart Investing & Trading Score: 0 | |
| Day Percent Change: 0.02% Day Change: 0.02 | |
| Week Change: -2.77% Year-to-date Change: 10.1% | |
| BFAM Links: Profile News Message Board | |
| Charts:- Daily , Weekly | |
| Add BFAM to Watchlist: View: Get Complete BFAM Trend Analysis ➞ | |
 | BR Broadridge Financial Solutions, Inc. |
| Sector: Technology | |
| SubSector: Information Technology Services | |
| MarketCap: 10633.8 Millions | |
| Recent Price: 193.43 Smart Investing & Trading Score: 25 | |
| Day Percent Change: 0.01% Day Change: 0.02 | |
| Week Change: -0.37% Year-to-date Change: -6.0% | |
| BR Links: Profile News Message Board | |
| Charts:- Daily , Weekly | |
| Add BR to Watchlist: View: Get Complete BR Trend Analysis ➞ | |
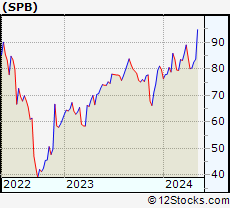 | SPB Spectrum Brands Holdings, Inc. |
| Sector: Consumer Staples | |
| SubSector: Personal Products | |
| MarketCap: 1460.85 Millions | |
| Recent Price: 81.88 Smart Investing & Trading Score: 58 | |
| Day Percent Change: 0.01% Day Change: 0.01 | |
| Week Change: -0.84% Year-to-date Change: 2.7% | |
| SPB Links: Profile News Message Board | |
| Charts:- Daily , Weekly | |
| Add SPB to Watchlist: View: Get Complete SPB Trend Analysis ➞ | |
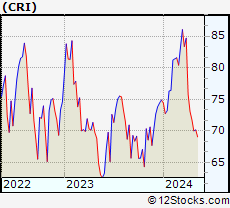 | CRI Carter s, Inc. |
| Sector: Consumer Staples | |
| SubSector: Textile - Apparel Clothing | |
| MarketCap: 3173.55 Millions | |
| Recent Price: 68.41 Smart Investing & Trading Score: 0 | |
| Day Percent Change: 0.00% Day Change: 0.00 | |
| Week Change: -2.29% Year-to-date Change: -8.7% | |
| CRI Links: Profile News Message Board | |
| Charts:- Daily , Weekly | |
| Add CRI to Watchlist: View: Get Complete CRI Trend Analysis ➞ | |
 | LKQ LKQ Corporation |
| Sector: Consumer Staples | |
| SubSector: Auto Parts | |
| MarketCap: 5633.79 Millions | |
| Recent Price: 43.13 Smart Investing & Trading Score: 10 | |
| Day Percent Change: 0.00% Day Change: 0.00 | |
| Week Change: -1.17% Year-to-date Change: -9.8% | |
| LKQ Links: Profile News Message Board | |
| Charts:- Daily , Weekly | |
| Add LKQ to Watchlist: View: Get Complete LKQ Trend Analysis ➞ | |
 | ADT ADT Inc. |
| Sector: Services & Goods | |
| SubSector: Security & Protection Services | |
| MarketCap: 2892.03 Millions | |
| Recent Price: 6.50 Smart Investing & Trading Score: 45 | |
| Day Percent Change: 0.00% Day Change: 0.00 | |
| Week Change: 1.09% Year-to-date Change: -4.7% | |
| ADT Links: Profile News Message Board | |
| Charts:- Daily , Weekly | |
| Add ADT to Watchlist: View: Get Complete ADT Trend Analysis ➞ | |
 | MCW Mister Car Wash, Inc. |
| Sector: Services & Goods | |
| SubSector: Personal Services | |
| MarketCap: 2790 Millions | |
| Recent Price: 6.69 Smart Investing & Trading Score: 10 | |
| Day Percent Change: 0.00% Day Change: 0.00 | |
| Week Change: -2.9% Year-to-date Change: -22.3% | |
| MCW Links: Profile News Message Board | |
| Charts:- Daily , Weekly | |
| Add MCW to Watchlist: View: Get Complete MCW Trend Analysis ➞ | |
 | DHI D.R. Horton, Inc. |
| Sector: Industrials | |
| SubSector: Residential Construction | |
| MarketCap: 13372.6 Millions | |
| Recent Price: 142.48 Smart Investing & Trading Score: 10 | |
| Day Percent Change: -0.01% Day Change: -0.01 | |
| Week Change: -1.96% Year-to-date Change: -6.3% | |
| DHI Links: Profile News Message Board | |
| Charts:- Daily , Weekly | |
| Add DHI to Watchlist: View: Get Complete DHI Trend Analysis ➞ | |
 | RL Ralph Lauren Corporation |
| Sector: Consumer Staples | |
| SubSector: Textile - Apparel Clothing | |
| MarketCap: 5589.95 Millions | |
| Recent Price: 163.62 Smart Investing & Trading Score: 22 | |
| Day Percent Change: -0.01% Day Change: -0.02 | |
| Week Change: -1.72% Year-to-date Change: 13.5% | |
| RL Links: Profile News Message Board | |
| Charts:- Daily , Weekly | |
| Add RL to Watchlist: View: Get Complete RL Trend Analysis ➞ | |
 | LH Laboratory Corporation of America Holdings |
| Sector: Health Care | |
| SubSector: Medical Laboratories & Research | |
| MarketCap: 12119.2 Millions | |
| Recent Price: 201.32 Smart Investing & Trading Score: 35 | |
| Day Percent Change: -0.02% Day Change: -0.05 | |
| Week Change: 1.47% Year-to-date Change: -11.4% | |
| LH Links: Profile News Message Board | |
| Charts:- Daily , Weekly | |
| Add LH to Watchlist: View: Get Complete LH Trend Analysis ➞ | |
 | VNT Vontier Corporation |
| Sector: Technology | |
| SubSector: Scientific & Technical Instruments | |
| MarketCap: 53787 Millions | |
| Recent Price: 40.62 Smart Investing & Trading Score: 17 | |
| Day Percent Change: -0.02% Day Change: -0.01 | |
| Week Change: -1.46% Year-to-date Change: 17.6% | |
| VNT Links: Profile News Message Board | |
| Charts:- Daily , Weekly | |
| Add VNT to Watchlist: View: Get Complete VNT Trend Analysis ➞ | |
 | PNR Pentair plc |
| Sector: Industrials | |
| SubSector: Industrial Equipment & Components | |
| MarketCap: 4326.59 Millions | |
| Recent Price: 79.07 Smart Investing & Trading Score: 36 | |
| Day Percent Change: -0.03% Day Change: -0.02 | |
| Week Change: -1.11% Year-to-date Change: 8.8% | |
| PNR Links: Profile News Message Board | |
| Charts:- Daily , Weekly | |
| Add PNR to Watchlist: View: Get Complete PNR Trend Analysis ➞ | |
 | HOG Harley-Davidson, Inc. |
| Sector: Consumer Staples | |
| SubSector: Recreational Vehicles | |
| MarketCap: 2808.49 Millions | |
| Recent Price: 34.38 Smart Investing & Trading Score: 10 | |
| Day Percent Change: -0.03% Day Change: -0.01 | |
| Week Change: -1.06% Year-to-date Change: -6.7% | |
| HOG Links: Profile News Message Board | |
| Charts:- Daily , Weekly | |
| Add HOG to Watchlist: View: Get Complete HOG Trend Analysis ➞ | |
 | AKAM Akamai Technologies, Inc. |
| Sector: Technology | |
| SubSector: Internet Information Providers | |
| MarketCap: 14495.5 Millions | |
| Recent Price: 100.89 Smart Investing & Trading Score: 29 | |
| Day Percent Change: -0.04% Day Change: -0.04 | |
| Week Change: -0.78% Year-to-date Change: -14.8% | |
| AKAM Links: Profile News Message Board | |
| Charts:- Daily , Weekly | |
| Add AKAM to Watchlist: View: Get Complete AKAM Trend Analysis ➞ | |
 | TRIP TripAdvisor, Inc. |
| Sector: Technology | |
| SubSector: Internet Information Providers | |
| MarketCap: 2633.9 Millions | |
| Recent Price: 26.32 Smart Investing & Trading Score: 12 | |
| Day Percent Change: -0.04% Day Change: -0.01 | |
| Week Change: -4.12% Year-to-date Change: 22.3% | |
| TRIP Links: Profile News Message Board | |
| Charts:- Daily , Weekly | |
| Add TRIP to Watchlist: View: Get Complete TRIP Trend Analysis ➞ | |
 | BWXT BWX Technologies, Inc. |
| Sector: Industrials | |
| SubSector: Aerospace/Defense Products & Services | |
| MarketCap: 4085.41 Millions | |
| Recent Price: 95.73 Smart Investing & Trading Score: 40 | |
| Day Percent Change: -0.04% Day Change: -0.04 | |
| Week Change: -0.27% Year-to-date Change: 24.8% | |
| BWXT Links: Profile News Message Board | |
| Charts:- Daily , Weekly | |
| Add BWXT to Watchlist: View: Get Complete BWXT Trend Analysis ➞ | |
 | BK The Bank of New York Mellon Corporation |
| Sector: Financials | |
| SubSector: Asset Management | |
| MarketCap: 29807.5 Millions | |
| Recent Price: 56.46 Smart Investing & Trading Score: 28 | |
| Day Percent Change: -0.05% Day Change: -0.03 | |
| Week Change: -1.5% Year-to-date Change: 8.5% | |
| BK Links: Profile News Message Board | |
| Charts:- Daily , Weekly | |
| Add BK to Watchlist: View: Get Complete BK Trend Analysis ➞ | |
 | ITT ITT Inc. |
| Sector: Industrials | |
| SubSector: Diversified Machinery | |
| MarketCap: 3783.06 Millions | |
| Recent Price: 129.28 Smart Investing & Trading Score: 41 | |
| Day Percent Change: -0.05% Day Change: -0.06 | |
| Week Change: -1.46% Year-to-date Change: 8.4% | |
| ITT Links: Profile News Message Board | |
| Charts:- Daily , Weekly | |
| Add ITT to Watchlist: View: Get Complete ITT Trend Analysis ➞ | |
 | TTWO Take-Two Interactive Software, Inc. |
| Sector: Technology | |
| SubSector: Multimedia & Graphics Software | |
| MarketCap: 12479.6 Millions | |
| Recent Price: 142.74 Smart Investing & Trading Score: 34 | |
| Day Percent Change: -0.05% Day Change: -0.07 | |
| Week Change: -1.2% Year-to-date Change: -11.3% | |
| TTWO Links: Profile News Message Board | |
| Charts:- Daily , Weekly | |
| Add TTWO to Watchlist: View: Get Complete TTWO Trend Analysis ➞ | |
 | SYF Synchrony Financial |
| Sector: Financials | |
| SubSector: Credit Services | |
| MarketCap: 9297.28 Millions | |
| Recent Price: 43.96 Smart Investing & Trading Score: 63 | |
| Day Percent Change: -0.05% Day Change: -0.02 | |
| Week Change: -1.59% Year-to-date Change: 15.1% | |
| SYF Links: Profile News Message Board | |
| Charts:- Daily , Weekly | |
| Add SYF to Watchlist: View: Get Complete SYF Trend Analysis ➞ | |
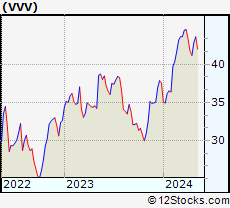 | VVV Valvoline Inc. |
| Sector: Energy | |
| SubSector: Oil & Gas Refining & Marketing | |
| MarketCap: 2225.94 Millions | |
| Recent Price: 42.50 Smart Investing & Trading Score: 52 | |
| Day Percent Change: -0.05% Day Change: -0.02 | |
| Week Change: -0.84% Year-to-date Change: 13.1% | |
| VVV Links: Profile News Message Board | |
| Charts:- Daily , Weekly | |
| Add VVV to Watchlist: View: Get Complete VVV Trend Analysis ➞ | |
 | WEC WEC Energy Group, Inc. |
| Sector: Utilities | |
| SubSector: Electric Utilities | |
| MarketCap: 24852 Millions | |
| Recent Price: 82.59 Smart Investing & Trading Score: 90 | |
| Day Percent Change: -0.06% Day Change: -0.05 | |
| Week Change: 1.35% Year-to-date Change: -1.9% | |
| WEC Links: Profile News Message Board | |
| Charts:- Daily , Weekly | |
| Add WEC to Watchlist: View: Get Complete WEC Trend Analysis ➞ | |
 | AOS A. O. Smith Corporation |
| Sector: Industrials | |
| SubSector: Industrial Electrical Equipment | |
| MarketCap: 5809.89 Millions | |
| Recent Price: 82.79 Smart Investing & Trading Score: 31 | |
| Day Percent Change: -0.06% Day Change: -0.05 | |
| Week Change: -0.5% Year-to-date Change: 0.4% | |
| AOS Links: Profile News Message Board | |
| Charts:- Daily , Weekly | |
| Add AOS to Watchlist: View: Get Complete AOS Trend Analysis ➞ | |
 | BAX Baxter International Inc. |
| Sector: Health Care | |
| SubSector: Medical Instruments & Supplies | |
| MarketCap: 39955.8 Millions | |
| Recent Price: 40.34 Smart Investing & Trading Score: 35 | |
| Day Percent Change: -0.07% Day Change: -0.03 | |
| Week Change: 0.52% Year-to-date Change: 4.4% | |
| BAX Links: Profile News Message Board | |
| Charts:- Daily , Weekly | |
| Add BAX to Watchlist: View: Get Complete BAX Trend Analysis ➞ | |
| For tabular summary view of above stock list: Summary View ➞ 0 - 25 , 25 - 50 , 50 - 75 , 75 - 100 , 100 - 125 , 125 - 150 , 150 - 175 , 175 - 200 , 200 - 225 , 225 - 250 , 250 - 275 , 275 - 300 , 300 - 325 , 325 - 350 , 350 - 375 , 375 - 400 , 400 - 425 , 425 - 450 , 450 - 475 , 475 - 500 , 500 - 525 , 525 - 550 , 550 - 575 , 575 - 600 , 600 - 625 , 625 - 650 , 650 - 675 , 675 - 700 , 700 - 725 , 725 - 750 , 750 - 775 | ||
| Click To Change The Sort Order: By Market Cap or Company Size Performance: Year-to-date, Week and Day | |
| Select Chart Type: | ||
|
Best Stocks Today 12Stocks.com |
© 2024 12Stocks.com Terms & Conditions Privacy Contact Us
All Information Provided Only For Education And Not To Be Used For Investing or Trading. See Terms & Conditions


One More Thing ... Get Best Stocks Delivered Daily!
Never Ever Miss A Move With Our Top Ten Stocks Lists
Find Best Stocks In Any Market - Bull or Bear Market
Take A Peek At Our Top Ten Stocks Lists: Daily, Weekly, Year-to-Date & Top Trends
Find Best Stocks In Any Market - Bull or Bear Market
Take A Peek At Our Top Ten Stocks Lists: Daily, Weekly, Year-to-Date & Top Trends
Midcap Stocks With Best Up Trends [0-bearish to 100-bullish]: Pinterest [100], Garmin [100], Brookfield Renewable[100], Amcor [100], United [100], Axalta Coating[100], DuPont de[100], Clean Harbors[100], Equitable [100], Columbia Banking[100], Playtika Holding[100]
Best Midcap Stocks Year-to-Date:
Vistra Energy[99.53%], AppLovin [76.53%], ShockWave Medical[73.09%], EMCOR [64.9%], Constellation Energy[57.66%], CAVA [56.42%], Tenet [53.43%], Spotify [51.42%], Natera [50.3%], Wingstop [49.65%], Antero Resources[44%] Best Midcap Stocks This Week:
Tenet [20.62%], Pinterest [19.2%], Bio-Techne [14.67%], New York[14.48%], Garmin [13.92%], Sensata Technologies[11.46%], Brookfield Renewable[10.3%], Woodward [10.15%], Axalta Coating[9.58%], Maravai LifeSciences[9.35%], Amcor [9.25%] Best Midcap Stocks Daily:
New York[28.30%], Pinterest [21.02%], Bio-Techne [16.22%], Garmin [13.12%], Brookfield Renewable[10.63%], Amcor [9.62%], United [8.88%], Axalta Coating[8.81%], DuPont de[8.01%], Clean Harbors[6.81%], Verisk Analytics[6.81%]