
 Login Sign Up


| |||||
 |  | ||||

| 12Stocks.com Market Intelligence |
Best MidCap Stocks
|
| In a hurry? Mid Cap Stocks Lists: Performance Trends Table, Stock Charts
Sort midcap stocks: Daily, Weekly, Year-to-Date, Market Cap & Trends. Filter midcap stocks list by sector: Show all, Tech, Finance, Energy, Staples, Retail, Industrial, Materials, Utilities and HealthCare Filter midcap stocks list by size:All MidCap Large Mid-Range Small |
| 12Stocks.com Mid Cap Stocks Performances & Trends Daily | |||||||||
|
|  The overall Smart Investing & Trading Score is 38 (0-bearish to 100-bullish) which puts Mid Cap index in short term bearish to neutral trend. The Smart Investing & Trading Score from previous trading session is 7 and hence an improvement of trend.
| ||||||||
Here are the Smart Investing & Trading Scores of the most requested mid cap stocks at 12Stocks.com (click stock name for detailed review):
|


| 12Stocks.com: Top Performing Mid Cap Index Stocks | ||||||||||||||||||||||||||||||||||||||||||||||||
 The top performing Mid Cap Index stocks year to date are
Now, more recently, over last week, the top performing Mid Cap Index stocks on the move are


|
||||||||||||||||||||||||||||||||||||||||||||||||
| 12Stocks.com: Investing in Midcap Index with Stocks | |
|
The following table helps investors and traders sort through current performance and trends (as measured by Smart Investing & Trading Score) of various
stocks in the Midcap Index. Quick View: Move mouse or cursor over stock symbol (ticker) to view short-term technical chart and over stock name to view long term chart. Click on  to add stock symbol to your watchlist and to add stock symbol to your watchlist and  to view watchlist. Click on any ticker or stock name for detailed market intelligence report for that stock. to view watchlist. Click on any ticker or stock name for detailed market intelligence report for that stock. |
12Stocks.com Performance of Stocks in Midcap Index
| Ticker | Stock Name | Watchlist | Category | Recent Price | Smart Investing & Trading Score | Change % | YTD Change% |
| WTM | White Mountains |   | Financials | 1827.61 | 100 | 0.21 | 21.44% |
| HR | Realty | | Financials | 14.54 | 100 | 0.21 | -15.61% |
| INCY | yte | | Health Care | 53.05 | 59 | 0.21 | -15.51% |
| LII | Lennox | | Industrials | 456.11 | 0 | 0.21 | 1.92% |
| PTC | PTC | | Technology | 175.33 | 0 | 0.21 | 0.21% |
| TYL | Tyler Technologies | | Technology | 459.49 | 63 | 0.21 | 9.89% |
| CAG | Conagra | | Consumer Staples | 30.80 | 71 | 0.20 | 7.47% |
| GPC | Genuine Parts | | Services & Goods | 157.08 | 51 | 0.20 | 13.42% |
| BK | Bank of New York | | Financials | 56.58 | 48 | 0.20 | 8.69% |
| ROL | Rollins | | Services & Goods | 44.77 | 58 | 0.20 | 2.52% |
| ICLR | ICON Public | | Health Care | 302.20 | 25 | 0.20 | 6.76% |
| BRO | Brown & Brown | | Financials | 82.86 | 54 | 0.19 | 16.52% |
| FANG | Diamondback Energy | | Energy | 196.38 | 31 | 0.19 | 26.63% |
| STAG | STAG Industrial | | Financials | 34.88 | 25 | 0.19 | -11.17% |
| IPG | Interpublic | | Services & Goods | 30.56 | 18 | 0.18 | -6.39% |
| RGA | Reinsurance | | Financials | 191.26 | 85 | 0.18 | 18.22% |
| LNT | Alliant Energy | | Utilities | 50.45 | 100 | 0.18 | -1.66% |
| HPQ | HP | | Technology | 27.80 | 10 | 0.18 | -7.61% |
| TDY | Teledyne Technologies | | Technology | 383.70 | 18 | 0.17 | -14.02% |
| RL | Ralph Lauren | | Consumer Staples | 163.90 | 22 | 0.17 | 13.66% |
| EGP | East Properties | | Financials | 157.12 | 25 | 0.17 | -14.39% |
| OMF | OneMain | | Financials | 50.84 | 63 | 0.16 | 3.33% |
| MTB | M&T Bank | | Financials | 146.35 | 83 | 0.15 | 6.76% |
| X | United States | | Materials | 37.03 | 35 | 0.15 | -23.87% |
| GLW | Corning | | Technology | 33.53 | 93 | 0.15 | 10.11% |
| For chart view version of above stock list: Chart View ➞ 0 - 25 , 25 - 50 , 50 - 75 , 75 - 100 , 100 - 125 , 125 - 150 , 150 - 175 , 175 - 200 , 200 - 225 , 225 - 250 , 250 - 275 , 275 - 300 , 300 - 325 , 325 - 350 , 350 - 375 , 375 - 400 , 400 - 425 , 425 - 450 , 450 - 475 , 475 - 500 , 500 - 525 , 525 - 550 , 550 - 575 , 575 - 600 , 600 - 625 , 625 - 650 , 650 - 675 , 675 - 700 | ||
 | Click To Change The Sort Order: By Market Cap or Company Size Performance: Year-to-date, Week and Day |  |
|
Get the most comprehensive stock market coverage daily at 12Stocks.com ➞ Best Stocks Today ➞ Best Stocks Weekly ➞ Best Stocks Year-to-Date ➞ Best Stocks Trends ➞  Best Stocks Today 12Stocks.com Best Nasdaq Stocks ➞ Best S&P 500 Stocks ➞ Best Tech Stocks ➞ Best Biotech Stocks ➞ |
| Detailed Overview of Midcap Stocks |
| Midcap Technical Overview, Leaders & Laggards, Top Midcap ETF Funds & Detailed Midcap Stocks List, Charts, Trends & More |
| Midcap: Technical Analysis, Trends & YTD Performance | |
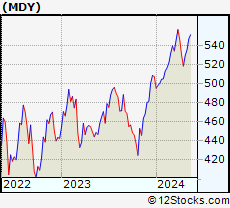
| MidCap segment as represented by
MDY, an exchange-traded fund [ETF], holds basket of about four hundred midcap stocks from across all major sectors of the US stock market. The midcap index (contains stocks like Green Mountain Coffee Roasters and Tractor Supply Company) is up by 3.92% and is currently underperforming the overall market by -1.23% year-to-date. Below is a quick view of technical charts and trends: | |
 MDY Weekly Chart |
|
| Long Term Trend: Not Good | |
| Medium Term Trend: Not Good | |
 MDY Daily Chart |
|
| Short Term Trend: Deteriorating | |
| Overall Trend Score: 38 | |
| YTD Performance: 3.92% | |
| **Trend Scores & Views Are Only For Educational Purposes And Not For Investing | |
| 12Stocks.com: Investing in Midcap Index using Exchange Traded Funds | |
|
The following table shows list of key exchange traded funds (ETF) that
help investors track Midcap index. The following list also includes leveraged ETF funds that track twice or thrice the daily returns of Midcap indices. Short or inverse ETF funds move in the opposite direction to the index they track and are useful during market pullbacks or during bear markets. Quick View: Move mouse or cursor over ETF symbol (ticker) to view short-term technical chart and over ETF name to view long term chart. Click on ticker or stock name for detailed view. Click on to add stock symbol to your watchlist and to view watchlist. |
12Stocks.com List of ETFs that track Midcap Index
| Ticker | ETF Name | Watchlist | Recent Price | Smart Investing & Trading Score | Change % | Week % | Year-to-date % |
| IJH | iShares Core S&P Mid-Cap | | 57.62 | 38 | 0.80 | -0.35 | 3.94% |
| IWR | iShares Russell Mid-Cap | | 79.80 | 17 | 0.40 | -0.9 | 2.66% |
| IWP | iShares Russell Mid-Cap Growth | | 107.74 | 17 | 0.26 | -1.14 | 3.14% |
| MDY | SPDR S&P MidCap 400 ETF | | 527.26 | 38 | 0.77 | -0.4 | 3.92% |
| IWS | iShares Russell Mid-Cap Value | | 119.22 | 38 | 0.38 | -0.64 | 2.52% |
| MZZ | ProShares UltraShort MidCap400 | | 11.89 | 53 | -0.59 | 1.8 | -5.41% |
| SMDD | ProShares UltraPro Short MidCap400 | | 12.09 | 78 | -0.77 | 2.2 | -10.2% |
| MYY | ProShares Short MidCap400 | | 20.93 | 70 | -0.36 | 0.67 | -2.45% |
| UMDD | ProShares UltraPro MidCap400 | | 23.87 | 10 | 3.14 | -0.38 | 6.94% |
| 12Stocks.com: Charts, Trends, Fundamental Data and Performances of MidCap Stocks | |
|
We now take in-depth look at all MidCap stocks including charts, multi-period performances and overall trends (as measured by Smart Investing & Trading Score). One can sort MidCap stocks (click link to choose) by Daily, Weekly and by Year-to-Date performances. Also, one can sort by size of the company or by market capitalization. |
| Select Your Default Chart Type: | |||||
| |||||
| Click on stock symbol or name for detailed view. Click on to add stock symbol to your watchlist and to view watchlist. Quick View: Move mouse or cursor over "Daily" to quickly view daily technical stock chart and over "Weekly" to view weekly technical stock chart. | |||||

 | WTM White Mountains Insurance Group, Ltd. |
| Sector: Financials | |
| SubSector: Property & Casualty Insurance | |
| MarketCap: 2502.62 Millions | |
| Recent Price: 1827.61 Smart Investing & Trading Score: 100 | |
| Day Percent Change: 0.21% Day Change: 3.87 | |
| Week Change: 3.35% Year-to-date Change: 21.4% | |
| WTM Links: Profile News Message Board | |
| Charts:- Daily , Weekly | |
| Add WTM to Watchlist: View: Get Complete WTM Trend Analysis ➞ | |
 | HR Healthcare Realty Trust Incorporated |
| Sector: Financials | |
| SubSector: REIT - Healthcare Facilities | |
| MarketCap: 3718.84 Millions | |
| Recent Price: 14.54 Smart Investing & Trading Score: 100 | |
| Day Percent Change: 0.21% Day Change: 0.03 | |
| Week Change: 2.83% Year-to-date Change: -15.6% | |
| HR Links: Profile News Message Board | |
| Charts:- Daily , Weekly | |
| Add HR to Watchlist: View: Get Complete HR Trend Analysis ➞ | |
 | INCY Incyte Corporation |
| Sector: Health Care | |
| SubSector: Biotechnology | |
| MarketCap: 15343.2 Millions | |
| Recent Price: 53.05 Smart Investing & Trading Score: 59 | |
| Day Percent Change: 0.21% Day Change: 0.11 | |
| Week Change: 2.65% Year-to-date Change: -15.5% | |
| INCY Links: Profile News Message Board | |
| Charts:- Daily , Weekly | |
| Add INCY to Watchlist: View: Get Complete INCY Trend Analysis ➞ | |
 | LII Lennox International Inc. |
| Sector: Industrials | |
| SubSector: Diversified Machinery | |
| MarketCap: 7720.66 Millions | |
| Recent Price: 456.11 Smart Investing & Trading Score: 0 | |
| Day Percent Change: 0.21% Day Change: 0.96 | |
| Week Change: -4.4% Year-to-date Change: 1.9% | |
| LII Links: Profile News Message Board | |
| Charts:- Daily , Weekly | |
| Add LII to Watchlist: View: Get Complete LII Trend Analysis ➞ | |
 | PTC PTC Inc. |
| Sector: Technology | |
| SubSector: Technical & System Software | |
| MarketCap: 6166.7 Millions | |
| Recent Price: 175.33 Smart Investing & Trading Score: 0 | |
| Day Percent Change: 0.21% Day Change: 0.37 | |
| Week Change: -3.13% Year-to-date Change: 0.2% | |
| PTC Links: Profile News Message Board | |
| Charts:- Daily , Weekly | |
| Add PTC to Watchlist: View: Get Complete PTC Trend Analysis ➞ | |
 | TYL Tyler Technologies, Inc. |
| Sector: Technology | |
| SubSector: Technical & System Software | |
| MarketCap: 10785 Millions | |
| Recent Price: 459.49 Smart Investing & Trading Score: 63 | |
| Day Percent Change: 0.21% Day Change: 0.96 | |
| Week Change: -0.27% Year-to-date Change: 9.9% | |
| TYL Links: Profile News Message Board | |
| Charts:- Daily , Weekly | |
| Add TYL to Watchlist: View: Get Complete TYL Trend Analysis ➞ | |
 | CAG Conagra Brands, Inc. |
| Sector: Consumer Staples | |
| SubSector: Processed & Packaged Goods | |
| MarketCap: 14084.1 Millions | |
| Recent Price: 30.80 Smart Investing & Trading Score: 71 | |
| Day Percent Change: 0.20% Day Change: 0.06 | |
| Week Change: -0.9% Year-to-date Change: 7.5% | |
| CAG Links: Profile News Message Board | |
| Charts:- Daily , Weekly | |
| Add CAG to Watchlist: View: Get Complete CAG Trend Analysis ➞ | |
 | GPC Genuine Parts Company |
| Sector: Services & Goods | |
| SubSector: Auto Parts Stores | |
| MarketCap: 8605.9 Millions | |
| Recent Price: 157.08 Smart Investing & Trading Score: 51 | |
| Day Percent Change: 0.20% Day Change: 0.31 | |
| Week Change: -1.78% Year-to-date Change: 13.4% | |
| GPC Links: Profile News Message Board | |
| Charts:- Daily , Weekly | |
| Add GPC to Watchlist: View: Get Complete GPC Trend Analysis ➞ | |
 | BK The Bank of New York Mellon Corporation |
| Sector: Financials | |
| SubSector: Asset Management | |
| MarketCap: 29807.5 Millions | |
| Recent Price: 56.58 Smart Investing & Trading Score: 48 | |
| Day Percent Change: 0.20% Day Change: 0.12 | |
| Week Change: -1.3% Year-to-date Change: 8.7% | |
| BK Links: Profile News Message Board | |
| Charts:- Daily , Weekly | |
| Add BK to Watchlist: View: Get Complete BK Trend Analysis ➞ | |
 | ROL Rollins, Inc. |
| Sector: Services & Goods | |
| SubSector: Business Services | |
| MarketCap: 12827.4 Millions | |
| Recent Price: 44.77 Smart Investing & Trading Score: 58 | |
| Day Percent Change: 0.20% Day Change: 0.09 | |
| Week Change: -0.29% Year-to-date Change: 2.5% | |
| ROL Links: Profile News Message Board | |
| Charts:- Daily , Weekly | |
| Add ROL to Watchlist: View: Get Complete ROL Trend Analysis ➞ | |
 | ICLR ICON Public Limited Company |
| Sector: Health Care | |
| SubSector: Medical Laboratories & Research | |
| MarketCap: 7011 Millions | |
| Recent Price: 302.20 Smart Investing & Trading Score: 25 | |
| Day Percent Change: 0.20% Day Change: 0.59 | |
| Week Change: -1.98% Year-to-date Change: 6.8% | |
| ICLR Links: Profile News Message Board | |
| Charts:- Daily , Weekly | |
| Add ICLR to Watchlist: View: Get Complete ICLR Trend Analysis ➞ | |
 | BRO Brown & Brown, Inc. |
| Sector: Financials | |
| SubSector: Insurance Brokers | |
| MarketCap: 10475.7 Millions | |
| Recent Price: 82.86 Smart Investing & Trading Score: 54 | |
| Day Percent Change: 0.19% Day Change: 0.16 | |
| Week Change: 1.72% Year-to-date Change: 16.5% | |
| BRO Links: Profile News Message Board | |
| Charts:- Daily , Weekly | |
| Add BRO to Watchlist: View: Get Complete BRO Trend Analysis ➞ | |
 | FANG Diamondback Energy, Inc. |
| Sector: Energy | |
| SubSector: Independent Oil & Gas | |
| MarketCap: 3009.13 Millions | |
| Recent Price: 196.38 Smart Investing & Trading Score: 31 | |
| Day Percent Change: 0.19% Day Change: 0.37 | |
| Week Change: -5.48% Year-to-date Change: 26.6% | |
| FANG Links: Profile News Message Board | |
| Charts:- Daily , Weekly | |
| Add FANG to Watchlist: View: Get Complete FANG Trend Analysis ➞ | |
 | STAG STAG Industrial, Inc. |
| Sector: Financials | |
| SubSector: REIT - Industrial | |
| MarketCap: 3767.49 Millions | |
| Recent Price: 34.88 Smart Investing & Trading Score: 25 | |
| Day Percent Change: 0.19% Day Change: 0.06 | |
| Week Change: 1.15% Year-to-date Change: -11.2% | |
| STAG Links: Profile News Message Board | |
| Charts:- Daily , Weekly | |
| Add STAG to Watchlist: View: Get Complete STAG Trend Analysis ➞ | |
 | IPG The Interpublic Group of Companies, Inc. |
| Sector: Services & Goods | |
| SubSector: Advertising Agencies | |
| MarketCap: 5730.55 Millions | |
| Recent Price: 30.56 Smart Investing & Trading Score: 18 | |
| Day Percent Change: 0.18% Day Change: 0.05 | |
| Week Change: -2.91% Year-to-date Change: -6.4% | |
| IPG Links: Profile News Message Board | |
| Charts:- Daily , Weekly | |
| Add IPG to Watchlist: View: Get Complete IPG Trend Analysis ➞ | |
 | RGA Reinsurance Group of America, Incorporated |
| Sector: Financials | |
| SubSector: Life Insurance | |
| MarketCap: 4423.36 Millions | |
| Recent Price: 191.26 Smart Investing & Trading Score: 85 | |
| Day Percent Change: 0.18% Day Change: 0.34 | |
| Week Change: 1.31% Year-to-date Change: 18.2% | |
| RGA Links: Profile News Message Board | |
| Charts:- Daily , Weekly | |
| Add RGA to Watchlist: View: Get Complete RGA Trend Analysis ➞ | |
 | LNT Alliant Energy Corporation |
| Sector: Utilities | |
| SubSector: Electric Utilities | |
| MarketCap: 10678.4 Millions | |
| Recent Price: 50.45 Smart Investing & Trading Score: 100 | |
| Day Percent Change: 0.18% Day Change: 0.09 | |
| Week Change: 1.73% Year-to-date Change: -1.7% | |
| LNT Links: Profile News Message Board | |
| Charts:- Daily , Weekly | |
| Add LNT to Watchlist: View: Get Complete LNT Trend Analysis ➞ | |
 | HPQ HP Inc. |
| Sector: Technology | |
| SubSector: Diversified Computer Systems | |
| MarketCap: 22107.8 Millions | |
| Recent Price: 27.80 Smart Investing & Trading Score: 10 | |
| Day Percent Change: 0.18% Day Change: 0.05 | |
| Week Change: -0.71% Year-to-date Change: -7.6% | |
| HPQ Links: Profile News Message Board | |
| Charts:- Daily , Weekly | |
| Add HPQ to Watchlist: View: Get Complete HPQ Trend Analysis ➞ | |
 | TDY Teledyne Technologies Incorporated |
| Sector: Technology | |
| SubSector: Scientific & Technical Instruments | |
| MarketCap: 9360.43 Millions | |
| Recent Price: 383.70 Smart Investing & Trading Score: 18 | |
| Day Percent Change: 0.17% Day Change: 0.67 | |
| Week Change: 2.42% Year-to-date Change: -14.0% | |
| TDY Links: Profile News Message Board | |
| Charts:- Daily , Weekly | |
| Add TDY to Watchlist: View: Get Complete TDY Trend Analysis ➞ | |
 | RL Ralph Lauren Corporation |
| Sector: Consumer Staples | |
| SubSector: Textile - Apparel Clothing | |
| MarketCap: 5589.95 Millions | |
| Recent Price: 163.90 Smart Investing & Trading Score: 22 | |
| Day Percent Change: 0.17% Day Change: 0.28 | |
| Week Change: -1.55% Year-to-date Change: 13.7% | |
| RL Links: Profile News Message Board | |
| Charts:- Daily , Weekly | |
| Add RL to Watchlist: View: Get Complete RL Trend Analysis ➞ | |
 | EGP EastGroup Properties, Inc. |
| Sector: Financials | |
| SubSector: REIT - Industrial | |
| MarketCap: 4034.29 Millions | |
| Recent Price: 157.12 Smart Investing & Trading Score: 25 | |
| Day Percent Change: 0.17% Day Change: 0.26 | |
| Week Change: 0.77% Year-to-date Change: -14.4% | |
| EGP Links: Profile News Message Board | |
| Charts:- Daily , Weekly | |
| Add EGP to Watchlist: View: Get Complete EGP Trend Analysis ➞ | |
 | OMF OneMain Holdings, Inc. |
| Sector: Financials | |
| SubSector: Credit Services | |
| MarketCap: 2753.38 Millions | |
| Recent Price: 50.84 Smart Investing & Trading Score: 63 | |
| Day Percent Change: 0.16% Day Change: 0.08 | |
| Week Change: -0.1% Year-to-date Change: 3.3% | |
| OMF Links: Profile News Message Board | |
| Charts:- Daily , Weekly | |
| Add OMF to Watchlist: View: Get Complete OMF Trend Analysis ➞ | |
 | MTB M&T Bank Corporation |
| Sector: Financials | |
| SubSector: Regional - Northeast Banks | |
| MarketCap: 13950.9 Millions | |
| Recent Price: 146.35 Smart Investing & Trading Score: 83 | |
| Day Percent Change: 0.15% Day Change: 0.22 | |
| Week Change: -0.02% Year-to-date Change: 6.8% | |
| MTB Links: Profile News Message Board | |
| Charts:- Daily , Weekly | |
| Add MTB to Watchlist: View: Get Complete MTB Trend Analysis ➞ | |
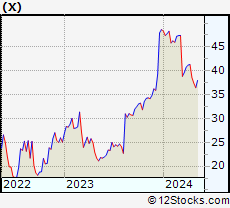 | X United States Steel Corporation |
| Sector: Materials | |
| SubSector: Steel & Iron | |
| MarketCap: 1062.88 Millions | |
| Recent Price: 37.03 Smart Investing & Trading Score: 35 | |
| Day Percent Change: 0.15% Day Change: 0.05 | |
| Week Change: -1.03% Year-to-date Change: -23.9% | |
| X Links: Profile News Message Board | |
| Charts:- Daily , Weekly | |
| Add X to Watchlist: View: Get Complete X Trend Analysis ➞ | |
 | GLW Corning Incorporated |
| Sector: Technology | |
| SubSector: Diversified Electronics | |
| MarketCap: 16287.6 Millions | |
| Recent Price: 33.53 Smart Investing & Trading Score: 93 | |
| Day Percent Change: 0.15% Day Change: 0.05 | |
| Week Change: 7.02% Year-to-date Change: 10.1% | |
| GLW Links: Profile News Message Board | |
| Charts:- Daily , Weekly | |
| Add GLW to Watchlist: View: Get Complete GLW Trend Analysis ➞ | |
| For tabular summary view of above stock list: Summary View ➞ 0 - 25 , 25 - 50 , 50 - 75 , 75 - 100 , 100 - 125 , 125 - 150 , 150 - 175 , 175 - 200 , 200 - 225 , 225 - 250 , 250 - 275 , 275 - 300 , 300 - 325 , 325 - 350 , 350 - 375 , 375 - 400 , 400 - 425 , 425 - 450 , 450 - 475 , 475 - 500 , 500 - 525 , 525 - 550 , 550 - 575 , 575 - 600 , 600 - 625 , 625 - 650 , 650 - 675 , 675 - 700 | ||
| Click To Change The Sort Order: By Market Cap or Company Size Performance: Year-to-date, Week and Day | |
| Select Chart Type: | ||
|
Best Stocks Today 12Stocks.com |
© 2024 12Stocks.com Terms & Conditions Privacy Contact Us
All Information Provided Only For Education And Not To Be Used For Investing or Trading. See Terms & Conditions


One More Thing ... Get Best Stocks Delivered Daily!
Never Ever Miss A Move With Our Top Ten Stocks Lists
Find Best Stocks In Any Market - Bull or Bear Market
Take A Peek At Our Top Ten Stocks Lists: Daily, Weekly, Year-to-Date & Top Trends
Find Best Stocks In Any Market - Bull or Bear Market
Take A Peek At Our Top Ten Stocks Lists: Daily, Weekly, Year-to-Date & Top Trends
Midcap Stocks With Best Up Trends [0-bearish to 100-bullish]: Avis Budget[100], Valmont Industries[100], C.H. Robinson[100], BorgWarner [100], Kellogg [100], WESCO [100], WestRock [100], Cognex [100], Markel [100], AXIS Capital[100], Xylem [100]
Best Midcap Stocks Year-to-Date:
AppLovin [80.75%], ShockWave Medical[72.96%], EMCOR [64.84%], Constellation Energy[58.62%], CAVA [56.54%], Tenet [54.11%], Wingstop [52%], Natera [48.53%], NRG Energy[44.9%], Interactive Brokers[43.9%], Antero Resources[43.12%] Best Midcap Stocks This Week:
Olaplex [24.63%], Tenet [21.15%], C.H. Robinson[18.73%], Valmont Industries[16.61%], Bio-Techne [16.16%], Avis Budget[15.1%], Garmin [14.63%], Brookfield Renewable[14.24%], Hertz Global[13.12%], New York[12.63%], Maravai LifeSciences[12.53%] Best Midcap Stocks Daily:
Avis Budget[22.39%], Olaplex [19.29%], Valmont Industries[17.90%], C.H. Robinson[15.65%], Wayfair [12.43%], Hertz Global[11.86%], Coinbase Global[10.36%], BorgWarner [8.61%], Kellogg [7.65%], Monolithic Power[7.51%], IAC/InterActiveCorp [7.23%]