
 Login Sign Up


| |||||
 |  | ||||

| 12Stocks.com Market Intelligence |
Best MidCap Stocks
|
| In a hurry? Mid Cap Stocks Lists: Performance Trends Table, Stock Charts
Sort midcap stocks: Daily, Weekly, Year-to-Date, Market Cap & Trends. Filter midcap stocks list by sector: Show all, Tech, Finance, Energy, Staples, Retail, Industrial, Materials, Utilities and HealthCare Filter midcap stocks list by size:All MidCap Large Mid-Range Small |
| 12Stocks.com Mid Cap Stocks Performances & Trends Daily | |||||||||
|
|  The overall Smart Investing & Trading Score is 63 (0-bearish to 100-bullish) which puts Mid Cap index in short term neutral to bullish trend. The Smart Investing & Trading Score from previous trading session is 44 and an improvement of trend continues.
| ||||||||
Here are the Smart Investing & Trading Scores of the most requested mid cap stocks at 12Stocks.com (click stock name for detailed review):
|


| 12Stocks.com: Top Performing Mid Cap Index Stocks | ||||||||||||||||||||||||||||||||||||||||||||||||
 The top performing Mid Cap Index stocks year to date are
Now, more recently, over last week, the top performing Mid Cap Index stocks on the move are


|
||||||||||||||||||||||||||||||||||||||||||||||||
| 12Stocks.com: Investing in Midcap Index with Stocks | |
|
The following table helps investors and traders sort through current performance and trends (as measured by Smart Investing & Trading Score) of various
stocks in the Midcap Index. Quick View: Move mouse or cursor over stock symbol (ticker) to view short-term technical chart and over stock name to view long term chart. Click on  to add stock symbol to your watchlist and to add stock symbol to your watchlist and  to view watchlist. Click on any ticker or stock name for detailed market intelligence report for that stock. to view watchlist. Click on any ticker or stock name for detailed market intelligence report for that stock. |
12Stocks.com Performance of Stocks in Midcap Index
| Ticker | Stock Name | Watchlist | Category | Recent Price | Smart Investing & Trading Score | Change % | YTD Change% |
| IPG | Interpublic |   | Services & Goods | 31.41 | 67 | 1.36 | -3.77% |
| SWKS | Skyworks Solutions | | Technology | 100.64 | 32 | 1.35 | -10.48% |
| CUZ | Cousins Properties | | Financials | 23.00 | 67 | 1.34 | -5.52% |
| HIW | Highwoods Properties | | Financials | 25.74 | 95 | 1.34 | 12.11% |
| RH | RH | | Services & Goods | 251.88 | 42 | 1.34 | -13.58% |
| EXR | Extra Space | | Financials | 135.05 | 35 | 1.33 | -15.77% |
| SUI | Sun Communities | | Financials | 121.61 | 59 | 1.31 | -9.01% |
| OLED | Universal Display | | Technology | 155.92 | 42 | 1.31 | -18.48% |
| COLM | Columbia Sportswear | | Consumer Staples | 80.02 | 87 | 1.30 | 0.60% |
| HPQ | HP | | Technology | 28.02 | 25 | 1.28 | -6.86% |
| APH | Amphenol | | Technology | 115.71 | 75 | 1.26 | 16.72% |
| IBKR | Interactive Brokers | | Financials | 116.14 | 95 | 1.26 | 40.10% |
| AWK | American Water | | Utilities | 121.35 | 74 | 1.23 | -8.06% |
| BHF | Brighthouse Financial | | Financials | 50.51 | 44 | 1.22 | -4.55% |
| GNTX | Gentex | | Consumer Staples | 35.08 | 65 | 1.21 | 7.41% |
| SSRM | SSR Mining | | Materials | 5.43 | 55 | 1.21 | -49.54% |
| GFS | GLOBALFOUNDRIES | | Technology | 46.87 | 25 | 1.21 | -22.53% |
| BJ | BJ s | | Services & Goods | 75.81 | 53 | 1.19 | 13.73% |
| TPR | Tapestry | | Consumer Staples | 39.91 | 36 | 1.19 | 8.42% |
| CNP | CenterPoint Energy | | Utilities | 29.07 | 100 | 1.18 | 1.75% |
| DLR | Digital Realty | | Financials | 140.17 | 55 | 1.18 | 4.15% |
| LEA | Lear | | Consumer Staples | 135.08 | 65 | 1.16 | -4.34% |
| SNX | SYNNEX | | Technology | 117.29 | 85 | 1.16 | 9.00% |
| PRI | Primerica | | Financials | 220.92 | 32 | 1.16 | 7.37% |
| IONS | Ionis | | Health Care | 42.33 | 49 | 1.16 | -16.34% |
| For chart view version of above stock list: Chart View ➞ 0 - 25 , 25 - 50 , 50 - 75 , 75 - 100 , 100 - 125 , 125 - 150 , 150 - 175 , 175 - 200 , 200 - 225 , 225 - 250 , 250 - 275 , 275 - 300 , 300 - 325 , 325 - 350 , 350 - 375 , 375 - 400 , 400 - 425 , 425 - 450 , 450 - 475 , 475 - 500 , 500 - 525 , 525 - 550 , 550 - 575 , 575 - 600 , 600 - 625 , 625 - 650 , 650 - 675 , 675 - 700 , 700 - 725 , 725 - 750 , 750 - 775 | ||
 | Click To Change The Sort Order: By Market Cap or Company Size Performance: Year-to-date, Week and Day |  |
|
Get the most comprehensive stock market coverage daily at 12Stocks.com ➞ Best Stocks Today ➞ Best Stocks Weekly ➞ Best Stocks Year-to-Date ➞ Best Stocks Trends ➞  Best Stocks Today 12Stocks.com Best Nasdaq Stocks ➞ Best S&P 500 Stocks ➞ Best Tech Stocks ➞ Best Biotech Stocks ➞ |
| Detailed Overview of Midcap Stocks |
| Midcap Technical Overview, Leaders & Laggards, Top Midcap ETF Funds & Detailed Midcap Stocks List, Charts, Trends & More |
| Midcap: Technical Analysis, Trends & YTD Performance | |
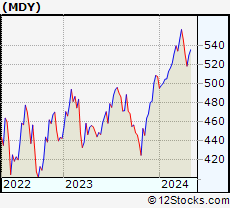
| MidCap segment as represented by
MDY, an exchange-traded fund [ETF], holds basket of about four hundred midcap stocks from across all major sectors of the US stock market. The midcap index (contains stocks like Green Mountain Coffee Roasters and Tractor Supply Company) is up by 4.26% and is currently underperforming the overall market by -1.23% year-to-date. Below is a quick view of technical charts and trends: | |
 MDY Weekly Chart |
|
| Long Term Trend: Very Good | |
| Medium Term Trend: Not Good | |
 MDY Daily Chart |
|
| Short Term Trend: Very Good | |
| Overall Trend Score: 63 | |
| YTD Performance: 4.26% | |
| **Trend Scores & Views Are Only For Educational Purposes And Not For Investing | |
| 12Stocks.com: Investing in Midcap Index using Exchange Traded Funds | |
|
The following table shows list of key exchange traded funds (ETF) that
help investors track Midcap index. The following list also includes leveraged ETF funds that track twice or thrice the daily returns of Midcap indices. Short or inverse ETF funds move in the opposite direction to the index they track and are useful during market pullbacks or during bear markets. Quick View: Move mouse or cursor over ETF symbol (ticker) to view short-term technical chart and over ETF name to view long term chart. Click on ticker or stock name for detailed view. Click on to add stock symbol to your watchlist and to view watchlist. |
12Stocks.com List of ETFs that track Midcap Index
| Ticker | ETF Name | Watchlist | Recent Price | Smart Investing & Trading Score | Change % | Week % | Year-to-date % |
| IJH | iShares Core S&P Mid-Cap | | 57.81 | 68 | -0.07 | 2.17 | 4.29% |
| IWR | iShares Russell Mid-Cap | | 80.31 | 48 | -0.08 | 2.09 | 3.31% |
| MDY | SPDR S&P MidCap 400 ETF | | 528.99 | 63 | -0.15 | 2.07 | 4.26% |
| IWP | iShares Russell Mid-Cap Growth | | 108.49 | 43 | -0.13 | 2.64 | 3.86% |
| IJK | iShares S&P Mid-Cap 400 Growth | | 86.82 | 48 | -0.13 | 2.32 | 9.59% |
| IWS | iShares Russell Mid-Cap Value | | 119.72 | 68 | -0.12 | 1.76 | 2.95% |
| IJJ | iShares S&P Mid-Cap 400 Value | | 112.33 | 41 | -0.12 | 1.61 | -1.5% |
| XMLV | PowerShares S&P MidCap Low Volatil ETF | | 54.96 | 53 | 0.09 | 1.47 | 3.34% |
| UMDD | ProShares UltraPro MidCap400 | | 23.82 | 63 | -1.20 | 5.57 | 6.72% |
| MVV | ProShares Ultra MidCap400 | | 61.39 | 41 | -0.24 | 4.05 | 6.05% |
| SMDD | ProShares UltraPro Short MidCap400 | | 11.84 | 32 | 1.58 | -5.79 | -12.1% |
| MYY | ProShares Short MidCap400 | | 20.74 | 32 | 0.00 | -2.12 | -3.34% |
| MZZ | ProShares UltraShort MidCap400 | | 11.69 | 34 | 0.26 | -3.95 | -7.01% |
| 12Stocks.com: Charts, Trends, Fundamental Data and Performances of MidCap Stocks | |
|
We now take in-depth look at all MidCap stocks including charts, multi-period performances and overall trends (as measured by Smart Investing & Trading Score). One can sort MidCap stocks (click link to choose) by Daily, Weekly and by Year-to-Date performances. Also, one can sort by size of the company or by market capitalization. |
| Select Your Default Chart Type: | |||||
| |||||
| Click on stock symbol or name for detailed view. Click on to add stock symbol to your watchlist and to view watchlist. Quick View: Move mouse or cursor over "Daily" to quickly view daily technical stock chart and over "Weekly" to view weekly technical stock chart. | |||||

 | IPG The Interpublic Group of Companies, Inc. |
| Sector: Services & Goods | |
| SubSector: Advertising Agencies | |
| MarketCap: 5730.55 Millions | |
| Recent Price: 31.41 Smart Investing & Trading Score: 67 | |
| Day Percent Change: 1.36% Day Change: 0.42 | |
| Week Change: 2.25% Year-to-date Change: -3.8% | |
| IPG Links: Profile News Message Board | |
| Charts:- Daily , Weekly | |
| Add IPG to Watchlist: View: Get Complete IPG Trend Analysis ➞ | |
 | SWKS Skyworks Solutions, Inc. |
| Sector: Technology | |
| SubSector: Semiconductor - Integrated Circuits | |
| MarketCap: 13981 Millions | |
| Recent Price: 100.64 Smart Investing & Trading Score: 32 | |
| Day Percent Change: 1.35% Day Change: 1.34 | |
| Week Change: 4.71% Year-to-date Change: -10.5% | |
| SWKS Links: Profile News Message Board | |
| Charts:- Daily , Weekly | |
| Add SWKS to Watchlist: View: Get Complete SWKS Trend Analysis ➞ | |
 | CUZ Cousins Properties Incorporated |
| Sector: Financials | |
| SubSector: REIT - Diversified | |
| MarketCap: 3828.13 Millions | |
| Recent Price: 23.00 Smart Investing & Trading Score: 67 | |
| Day Percent Change: 1.34% Day Change: 0.30 | |
| Week Change: 3.77% Year-to-date Change: -5.5% | |
| CUZ Links: Profile News Message Board | |
| Charts:- Daily , Weekly | |
| Add CUZ to Watchlist: View: Get Complete CUZ Trend Analysis ➞ | |
 | HIW Highwoods Properties, Inc. |
| Sector: Financials | |
| SubSector: REIT - Office | |
| MarketCap: 3227.46 Millions | |
| Recent Price: 25.74 Smart Investing & Trading Score: 95 | |
| Day Percent Change: 1.34% Day Change: 0.34 | |
| Week Change: 6.45% Year-to-date Change: 12.1% | |
| HIW Links: Profile News Message Board | |
| Charts:- Daily , Weekly | |
| Add HIW to Watchlist: View: Get Complete HIW Trend Analysis ➞ | |
 | RH RH |
| Sector: Services & Goods | |
| SubSector: Home Furnishing Stores | |
| MarketCap: 1828.25 Millions | |
| Recent Price: 251.88 Smart Investing & Trading Score: 42 | |
| Day Percent Change: 1.34% Day Change: 3.32 | |
| Week Change: 4.77% Year-to-date Change: -13.6% | |
| RH Links: Profile News Message Board | |
| Charts:- Daily , Weekly | |
| Add RH to Watchlist: View: Get Complete RH Trend Analysis ➞ | |
 | EXR Extra Space Storage Inc. |
| Sector: Financials | |
| SubSector: REIT - Industrial | |
| MarketCap: 11203.9 Millions | |
| Recent Price: 135.05 Smart Investing & Trading Score: 35 | |
| Day Percent Change: 1.33% Day Change: 1.77 | |
| Week Change: 1.96% Year-to-date Change: -15.8% | |
| EXR Links: Profile News Message Board | |
| Charts:- Daily , Weekly | |
| Add EXR to Watchlist: View: Get Complete EXR Trend Analysis ➞ | |
 | SUI Sun Communities, Inc. |
| Sector: Financials | |
| SubSector: REIT - Residential | |
| MarketCap: 11280.5 Millions | |
| Recent Price: 121.61 Smart Investing & Trading Score: 59 | |
| Day Percent Change: 1.31% Day Change: 1.57 | |
| Week Change: 3.33% Year-to-date Change: -9.0% | |
| SUI Links: Profile News Message Board | |
| Charts:- Daily , Weekly | |
| Add SUI to Watchlist: View: Get Complete SUI Trend Analysis ➞ | |
 | OLED Universal Display Corporation |
| Sector: Technology | |
| SubSector: Semiconductor Equipment & Materials | |
| MarketCap: 5660.08 Millions | |
| Recent Price: 155.92 Smart Investing & Trading Score: 42 | |
| Day Percent Change: 1.31% Day Change: 2.02 | |
| Week Change: 4.08% Year-to-date Change: -18.5% | |
| OLED Links: Profile News Message Board | |
| Charts:- Daily , Weekly | |
| Add OLED to Watchlist: View: Get Complete OLED Trend Analysis ➞ | |
 | COLM Columbia Sportswear Company |
| Sector: Consumer Staples | |
| SubSector: Textile - Apparel Clothing | |
| MarketCap: 4371.75 Millions | |
| Recent Price: 80.02 Smart Investing & Trading Score: 87 | |
| Day Percent Change: 1.30% Day Change: 1.03 | |
| Week Change: 4.53% Year-to-date Change: 0.6% | |
| COLM Links: Profile News Message Board | |
| Charts:- Daily , Weekly | |
| Add COLM to Watchlist: View: Get Complete COLM Trend Analysis ➞ | |
 | HPQ HP Inc. |
| Sector: Technology | |
| SubSector: Diversified Computer Systems | |
| MarketCap: 22107.8 Millions | |
| Recent Price: 28.02 Smart Investing & Trading Score: 25 | |
| Day Percent Change: 1.28% Day Change: 0.35 | |
| Week Change: 0.77% Year-to-date Change: -6.9% | |
| HPQ Links: Profile News Message Board | |
| Charts:- Daily , Weekly | |
| Add HPQ to Watchlist: View: Get Complete HPQ Trend Analysis ➞ | |
 | APH Amphenol Corporation |
| Sector: Technology | |
| SubSector: Diversified Electronics | |
| MarketCap: 23422 Millions | |
| Recent Price: 115.71 Smart Investing & Trading Score: 75 | |
| Day Percent Change: 1.26% Day Change: 1.44 | |
| Week Change: 5.02% Year-to-date Change: 16.7% | |
| APH Links: Profile News Message Board | |
| Charts:- Daily , Weekly | |
| Add APH to Watchlist: View: Get Complete APH Trend Analysis ➞ | |
 | IBKR Interactive Brokers Group, Inc. |
| Sector: Financials | |
| SubSector: Investment Brokerage - National | |
| MarketCap: 16975.7 Millions | |
| Recent Price: 116.14 Smart Investing & Trading Score: 95 | |
| Day Percent Change: 1.26% Day Change: 1.45 | |
| Week Change: 4.11% Year-to-date Change: 40.1% | |
| IBKR Links: Profile News Message Board | |
| Charts:- Daily , Weekly | |
| Add IBKR to Watchlist: View: Get Complete IBKR Trend Analysis ➞ | |
 | AWK American Water Works Company, Inc. |
| Sector: Utilities | |
| SubSector: Water Utilities | |
| MarketCap: 20029.2 Millions | |
| Recent Price: 121.35 Smart Investing & Trading Score: 74 | |
| Day Percent Change: 1.23% Day Change: 1.48 | |
| Week Change: 2.39% Year-to-date Change: -8.1% | |
| AWK Links: Profile News Message Board | |
| Charts:- Daily , Weekly | |
| Add AWK to Watchlist: View: Get Complete AWK Trend Analysis ➞ | |
 | BHF Brighthouse Financial, Inc. |
| Sector: Financials | |
| SubSector: Life Insurance | |
| MarketCap: 2045.06 Millions | |
| Recent Price: 50.51 Smart Investing & Trading Score: 44 | |
| Day Percent Change: 1.22% Day Change: 0.61 | |
| Week Change: 3.33% Year-to-date Change: -4.6% | |
| BHF Links: Profile News Message Board | |
| Charts:- Daily , Weekly | |
| Add BHF to Watchlist: View: Get Complete BHF Trend Analysis ➞ | |
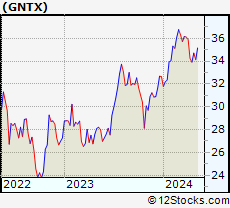 | GNTX Gentex Corporation |
| Sector: Consumer Staples | |
| SubSector: Auto Parts | |
| MarketCap: 5638.99 Millions | |
| Recent Price: 35.08 Smart Investing & Trading Score: 65 | |
| Day Percent Change: 1.21% Day Change: 0.42 | |
| Week Change: 3.45% Year-to-date Change: 7.4% | |
| GNTX Links: Profile News Message Board | |
| Charts:- Daily , Weekly | |
| Add GNTX to Watchlist: View: Get Complete GNTX Trend Analysis ➞ | |
 | SSRM SSR Mining Inc. |
| Sector: Materials | |
| SubSector: Gold | |
| MarketCap: 1546.09 Millions | |
| Recent Price: 5.43 Smart Investing & Trading Score: 55 | |
| Day Percent Change: 1.21% Day Change: 0.06 | |
| Week Change: 1.59% Year-to-date Change: -49.5% | |
| SSRM Links: Profile News Message Board | |
| Charts:- Daily , Weekly | |
| Add SSRM to Watchlist: View: Get Complete SSRM Trend Analysis ➞ | |
 | GFS GLOBALFOUNDRIES Inc. |
| Sector: Technology | |
| SubSector: Semiconductors | |
| MarketCap: 35570 Millions | |
| Recent Price: 46.87 Smart Investing & Trading Score: 25 | |
| Day Percent Change: 1.21% Day Change: 0.56 | |
| Week Change: 1.32% Year-to-date Change: -22.5% | |
| GFS Links: Profile News Message Board | |
| Charts:- Daily , Weekly | |
| Add GFS to Watchlist: View: Get Complete GFS Trend Analysis ➞ | |
 | BJ BJ s Wholesale Club Holdings, Inc. |
| Sector: Services & Goods | |
| SubSector: Discount, Variety Stores | |
| MarketCap: 3346.02 Millions | |
| Recent Price: 75.81 Smart Investing & Trading Score: 53 | |
| Day Percent Change: 1.19% Day Change: 0.89 | |
| Week Change: 2.81% Year-to-date Change: 13.7% | |
| BJ Links: Profile News Message Board | |
| Charts:- Daily , Weekly | |
| Add BJ to Watchlist: View: Get Complete BJ Trend Analysis ➞ | |
 | TPR Tapestry, Inc. |
| Sector: Consumer Staples | |
| SubSector: Textile - Apparel Footwear & Accessories | |
| MarketCap: 3890.1 Millions | |
| Recent Price: 39.91 Smart Investing & Trading Score: 36 | |
| Day Percent Change: 1.19% Day Change: 0.47 | |
| Week Change: -1.75% Year-to-date Change: 8.4% | |
| TPR Links: Profile News Message Board | |
| Charts:- Daily , Weekly | |
| Add TPR to Watchlist: View: Get Complete TPR Trend Analysis ➞ | |
 | CNP CenterPoint Energy, Inc. |
| Sector: Utilities | |
| SubSector: Gas Utilities | |
| MarketCap: 7444.07 Millions | |
| Recent Price: 29.07 Smart Investing & Trading Score: 100 | |
| Day Percent Change: 1.18% Day Change: 0.34 | |
| Week Change: 1.89% Year-to-date Change: 1.8% | |
| CNP Links: Profile News Message Board | |
| Charts:- Daily , Weekly | |
| Add CNP to Watchlist: View: Get Complete CNP Trend Analysis ➞ | |
 | DLR Digital Realty Trust, Inc. |
| Sector: Financials | |
| SubSector: REIT - Office | |
| MarketCap: 27038.6 Millions | |
| Recent Price: 140.17 Smart Investing & Trading Score: 55 | |
| Day Percent Change: 1.18% Day Change: 1.64 | |
| Week Change: 2.44% Year-to-date Change: 4.2% | |
| DLR Links: Profile News Message Board | |
| Charts:- Daily , Weekly | |
| Add DLR to Watchlist: View: Get Complete DLR Trend Analysis ➞ | |
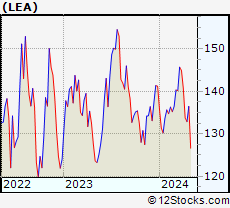 | LEA Lear Corporation |
| Sector: Consumer Staples | |
| SubSector: Auto Parts | |
| MarketCap: 5106.09 Millions | |
| Recent Price: 135.08 Smart Investing & Trading Score: 65 | |
| Day Percent Change: 1.16% Day Change: 1.55 | |
| Week Change: 1.67% Year-to-date Change: -4.3% | |
| LEA Links: Profile News Message Board | |
| Charts:- Daily , Weekly | |
| Add LEA to Watchlist: View: Get Complete LEA Trend Analysis ➞ | |
 | SNX SYNNEX Corporation |
| Sector: Technology | |
| SubSector: Information Technology Services | |
| MarketCap: 4519.48 Millions | |
| Recent Price: 117.29 Smart Investing & Trading Score: 85 | |
| Day Percent Change: 1.16% Day Change: 1.35 | |
| Week Change: 3.5% Year-to-date Change: 9.0% | |
| SNX Links: Profile News Message Board | |
| Charts:- Daily , Weekly | |
| Add SNX to Watchlist: View: Get Complete SNX Trend Analysis ➞ | |
 | PRI Primerica, Inc. |
| Sector: Financials | |
| SubSector: Life Insurance | |
| MarketCap: 2782.06 Millions | |
| Recent Price: 220.92 Smart Investing & Trading Score: 32 | |
| Day Percent Change: 1.16% Day Change: 2.53 | |
| Week Change: 2.73% Year-to-date Change: 7.4% | |
| PRI Links: Profile News Message Board | |
| Charts:- Daily , Weekly | |
| Add PRI to Watchlist: View: Get Complete PRI Trend Analysis ➞ | |
 | IONS Ionis Pharmaceuticals, Inc. |
| Sector: Health Care | |
| SubSector: Biotechnology | |
| MarketCap: 6725.05 Millions | |
| Recent Price: 42.33 Smart Investing & Trading Score: 49 | |
| Day Percent Change: 1.16% Day Change: 0.48 | |
| Week Change: 4.04% Year-to-date Change: -16.3% | |
| IONS Links: Profile News Message Board | |
| Charts:- Daily , Weekly | |
| Add IONS to Watchlist: View: Get Complete IONS Trend Analysis ➞ | |
| For tabular summary view of above stock list: Summary View ➞ 0 - 25 , 25 - 50 , 50 - 75 , 75 - 100 , 100 - 125 , 125 - 150 , 150 - 175 , 175 - 200 , 200 - 225 , 225 - 250 , 250 - 275 , 275 - 300 , 300 - 325 , 325 - 350 , 350 - 375 , 375 - 400 , 400 - 425 , 425 - 450 , 450 - 475 , 475 - 500 , 500 - 525 , 525 - 550 , 550 - 575 , 575 - 600 , 600 - 625 , 625 - 650 , 650 - 675 , 675 - 700 , 700 - 725 , 725 - 750 , 750 - 775 | ||
| Click To Change The Sort Order: By Market Cap or Company Size Performance: Year-to-date, Week and Day | |
| Select Chart Type: | ||
|
Best Stocks Today 12Stocks.com |
© 2024 12Stocks.com Terms & Conditions Privacy Contact Us
All Information Provided Only For Education And Not To Be Used For Investing or Trading. See Terms & Conditions


One More Thing ... Get Best Stocks Delivered Daily!
Never Ever Miss A Move With Our Top Ten Stocks Lists
Find Best Stocks In Any Market - Bull or Bear Market
Take A Peek At Our Top Ten Stocks Lists: Daily, Weekly, Year-to-Date & Top Trends
Find Best Stocks In Any Market - Bull or Bear Market
Take A Peek At Our Top Ten Stocks Lists: Daily, Weekly, Year-to-Date & Top Trends
Midcap Stocks With Best Up Trends [0-bearish to 100-bullish]: Hasbro [100], Wabtec [100], Allegro Micro[100], Synchrony Financial[100], Virtu Financial[100], Kemper [100], EQT [100], Microchip [100], Range Resources[100], Equity Residential[100], Crane Co[100]
Best Midcap Stocks Year-to-Date:
Vistra Energy[82.42%], AppLovin [74.52%], ShockWave Medical[72.27%], Constellation Energy[59.4%], EMCOR [56.6%], Spotify [49.86%], Natera [47.47%], Pure Storage[42.5%], Wingstop [42.21%], Williams-Sonoma [41.32%], NRG Energy[40.98%] Best Midcap Stocks This Week:
HashiCorp [23.7%], Globe Life[23.01%], Hasbro [17.18%], Tandem Diabetes[15.51%], Wabtec [13.26%], MongoDB [12.71%], Ryder System[10.52%], Watsco [10.33%], Microchip [9.78%], Coinbase Global[9.74%], Crane Co[9.5%] Best Midcap Stocks Daily:
Hasbro [11.39%], Wabtec [9.97%], CoStar [8.44%], Globe Life[8.37%], Allegro Micro[6.66%], Sarepta [6.36%], Watsco [5.89%], ON Semiconductor[5.38%], Synchrony Financial[5.11%], MSCI [5.03%], Virtu Financial[4.88%]