
 Login Sign Up


| |||||
 |  | ||||

| 12Stocks.com Market Intelligence |
Best MidCap Stocks
|
| In a hurry? Mid Cap Stocks Lists: Performance Trends Table, Stock Charts
Sort midcap stocks: Daily, Weekly, Year-to-Date, Market Cap & Trends. Filter midcap stocks list by sector: Show all, Tech, Finance, Energy, Staples, Retail, Industrial, Materials, Utilities and HealthCare Filter midcap stocks list by size:All MidCap Large Mid-Range Small |
| 12Stocks.com Mid Cap Stocks Performances & Trends Daily | |||||||||
|
|  The overall Smart Investing & Trading Score is 44 (0-bearish to 100-bullish) which puts Mid Cap index in short term neutral trend. The Smart Investing & Trading Score from previous trading session is 36 and hence an improvement of trend.
| ||||||||
Here are the Smart Investing & Trading Scores of the most requested mid cap stocks at 12Stocks.com (click stock name for detailed review):
|


| 12Stocks.com: Top Performing Mid Cap Index Stocks | ||||||||||||||||||||||||||||||||||||||||||||||||
 The top performing Mid Cap Index stocks year to date are
Now, more recently, over last week, the top performing Mid Cap Index stocks on the move are


|
||||||||||||||||||||||||||||||||||||||||||||||||
| 12Stocks.com: Investing in Midcap Index with Stocks | |
|
The following table helps investors and traders sort through current performance and trends (as measured by Smart Investing & Trading Score) of various
stocks in the Midcap Index. Quick View: Move mouse or cursor over stock symbol (ticker) to view short-term technical chart and over stock name to view long term chart. Click on  to add stock symbol to your watchlist and to add stock symbol to your watchlist and  to view watchlist. Click on any ticker or stock name for detailed market intelligence report for that stock. to view watchlist. Click on any ticker or stock name for detailed market intelligence report for that stock. |
12Stocks.com Performance of Stocks in Midcap Index
| Ticker | Stock Name | Watchlist | Category | Recent Price | Smart Investing & Trading Score | Change % | YTD Change% |
| FHN | First Horizon |   | Financials | 14.59 | 68 | 2.17 | 3.04% |
| JBHT | J.B. Hunt | | Transports | 167.74 | 17 | 2.16 | -16.02% |
| SNA | Snap-on | | Industrials | 267.40 | 0 | 2.15 | -7.42% |
| THG | Hanover Insurance | | Financials | 129.90 | 35 | 2.11 | 6.98% |
| NFG | National Fuel | | Energy | 53.11 | 68 | 2.11 | 5.86% |
| CTRA | Contura Energy | | Materials | 27.80 | 61 | 2.11 | 8.91% |
| BWA | BorgWarner | | Consumer Staples | 32.78 | 35 | 2.09 | -8.56% |
| ESTC | Elastic N.V | | Technology | 97.29 | 35 | 2.08 | -13.67% |
| WPC | W. P. | | Financials | 55.78 | 52 | 2.07 | -13.93% |
| COLB | Columbia Banking | | Financials | 18.11 | 52 | 2.06 | -32.14% |
| OGE | OGE Energy | | Utilities | 33.83 | 65 | 2.05 | -3.15% |
| ALL | Allstate | | Financials | 172.56 | 76 | 2.04 | 23.27% |
| EIX | Edison | | Utilities | 69.52 | 68 | 2.04 | -2.76% |
| OMF | OneMain | | Financials | 48.87 | 50 | 2.03 | -0.67% |
| ALK | Alaska Air | | Transports | 45.34 | 100 | 2.01 | 16.04% |
| EBAY | eBay | | Services & Goods | 50.95 | 68 | 2.01 | 16.82% |
| ORI | Old Republic | | Financials | 29.70 | 58 | 1.99 | 1.02% |
| CAR | Avis Budget | | Transports | 104.03 | 10 | 1.99 | -41.31% |
| LNC | Loln National | | Financials | 27.77 | 68 | 1.98 | 2.97% |
| UA | Under Armour | | Services & Goods | 6.49 | 42 | 1.97 | -22.34% |
| PSX | Phillips 66 | | Energy | 156.33 | 41 | 1.97 | 17.42% |
| ETR | Entergy | | Utilities | 105.78 | 73 | 1.95 | 4.53% |
| BHF | Brighthouse Financial | | Financials | 48.51 | 32 | 1.95 | -8.33% |
| AFL | Aflac | | Financials | 82.55 | 32 | 1.94 | 0.06% |
| KSS | Kohl s | | Services & Goods | 23.29 | 32 | 1.93 | -18.79% |
| For chart view version of above stock list: Chart View ➞ 0 - 25 , 25 - 50 , 50 - 75 , 75 - 100 , 100 - 125 , 125 - 150 , 150 - 175 , 175 - 200 , 200 - 225 , 225 - 250 , 250 - 275 , 275 - 300 , 300 - 325 , 325 - 350 , 350 - 375 , 375 - 400 , 400 - 425 , 425 - 450 , 450 - 475 , 475 - 500 , 500 - 525 , 525 - 550 , 550 - 575 , 575 - 600 , 600 - 625 , 625 - 650 , 650 - 675 , 675 - 700 , 700 - 725 , 725 - 750 | ||
 | Click To Change The Sort Order: By Market Cap or Company Size Performance: Year-to-date, Week and Day |  |
|
Get the most comprehensive stock market coverage daily at 12Stocks.com ➞ Best Stocks Today ➞ Best Stocks Weekly ➞ Best Stocks Year-to-Date ➞ Best Stocks Trends ➞  Best Stocks Today 12Stocks.com Best Nasdaq Stocks ➞ Best S&P 500 Stocks ➞ Best Tech Stocks ➞ Best Biotech Stocks ➞ |
| Detailed Overview of Midcap Stocks |
| Midcap Technical Overview, Leaders & Laggards, Top Midcap ETF Funds & Detailed Midcap Stocks List, Charts, Trends & More |
| Midcap: Technical Analysis, Trends & YTD Performance | |
| MidCap segment as represented by
MDY, an exchange-traded fund [ETF], holds basket of about four hundred midcap stocks from across all major sectors of the US stock market. The midcap index (contains stocks like Green Mountain Coffee Roasters and Tractor Supply Company) is up by 2.26% and is currently underperforming the overall market by -1.82% year-to-date. Below is a quick view of technical charts and trends: | |
 MDY Weekly Chart |
|
| Long Term Trend: Good | |
| Medium Term Trend: Not Good | |
 MDY Daily Chart |
|
| Short Term Trend: Deteriorating | |
| Overall Trend Score: 44 | |
| YTD Performance: 2.26% | |
| **Trend Scores & Views Are Only For Educational Purposes And Not For Investing | |
| 12Stocks.com: Investing in Midcap Index using Exchange Traded Funds | |
|
The following table shows list of key exchange traded funds (ETF) that
help investors track Midcap index. The following list also includes leveraged ETF funds that track twice or thrice the daily returns of Midcap indices. Short or inverse ETF funds move in the opposite direction to the index they track and are useful during market pullbacks or during bear markets. Quick View: Move mouse or cursor over ETF symbol (ticker) to view short-term technical chart and over ETF name to view long term chart. Click on ticker or stock name for detailed view. Click on to add stock symbol to your watchlist and to view watchlist. |
12Stocks.com List of ETFs that track Midcap Index
| Ticker | ETF Name | Watchlist | Recent Price | Smart Investing & Trading Score | Change % | Week % | Year-to-date % |
| MDY | SPDR S&P MidCap 400 ETF | | 518.85 | 44 | 0.44 | -2.09 | 2.26% |
| SMDD | ProShares UltraPro Short MidCap400 | | 12.52 | 59 | -1.33 | 6.56 | -7% |
| UMDD | ProShares UltraPro MidCap400 | | 22.57 | 36 | 1.20 | -6.61 | 1.14% |
| MZZ | ProShares UltraShort MidCap400 | | 12.26 | 34 | 0.25 | 5.69 | -2.47% |
| MYY | ProShares Short MidCap400 | | 21.27 | 69 | 0.03 | 2.72 | -0.88% |
| 12Stocks.com: Charts, Trends, Fundamental Data and Performances of MidCap Stocks | |
|
We now take in-depth look at all MidCap stocks including charts, multi-period performances and overall trends (as measured by Smart Investing & Trading Score). One can sort MidCap stocks (click link to choose) by Daily, Weekly and by Year-to-Date performances. Also, one can sort by size of the company or by market capitalization. |
| Select Your Default Chart Type: | |||||
| |||||
| Click on stock symbol or name for detailed view. Click on to add stock symbol to your watchlist and to view watchlist. Quick View: Move mouse or cursor over "Daily" to quickly view daily technical stock chart and over "Weekly" to view weekly technical stock chart. | |||||

 | FHN First Horizon National Corporation |
| Sector: Financials | |
| SubSector: Regional - Southeast Banks | |
| MarketCap: 2661.05 Millions | |
| Recent Price: 14.59 Smart Investing & Trading Score: 68 | |
| Day Percent Change: 2.17% Day Change: 0.31 | |
| Week Change: 2.75% Year-to-date Change: 3.0% | |
| FHN Links: Profile News Message Board | |
| Charts:- Daily , Weekly | |
| Add FHN to Watchlist: View: Get Complete FHN Trend Analysis ➞ | |
 | JBHT J.B. Hunt Transport Services, Inc. |
| Sector: Transports | |
| SubSector: Trucking | |
| MarketCap: 9074 Millions | |
| Recent Price: 167.74 Smart Investing & Trading Score: 17 | |
| Day Percent Change: 2.16% Day Change: 3.54 | |
| Week Change: -9.56% Year-to-date Change: -16.0% | |
| JBHT Links: Profile News Message Board | |
| Charts:- Daily , Weekly | |
| Add JBHT to Watchlist: View: Get Complete JBHT Trend Analysis ➞ | |
 | SNA Snap-on Incorporated |
| Sector: Industrials | |
| SubSector: Small Tools & Accessories | |
| MarketCap: 5947.26 Millions | |
| Recent Price: 267.40 Smart Investing & Trading Score: 0 | |
| Day Percent Change: 2.15% Day Change: 5.64 | |
| Week Change: -7.66% Year-to-date Change: -7.4% | |
| SNA Links: Profile News Message Board | |
| Charts:- Daily , Weekly | |
| Add SNA to Watchlist: View: Get Complete SNA Trend Analysis ➞ | |
 | THG The Hanover Insurance Group, Inc. |
| Sector: Financials | |
| SubSector: Property & Casualty Insurance | |
| MarketCap: 3677.92 Millions | |
| Recent Price: 129.90 Smart Investing & Trading Score: 35 | |
| Day Percent Change: 2.11% Day Change: 2.69 | |
| Week Change: 1.14% Year-to-date Change: 7.0% | |
| THG Links: Profile News Message Board | |
| Charts:- Daily , Weekly | |
| Add THG to Watchlist: View: Get Complete THG Trend Analysis ➞ | |
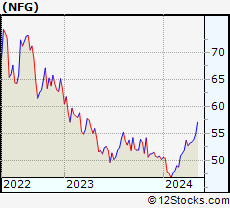 | NFG National Fuel Gas Company |
| Sector: Energy | |
| SubSector: Independent Oil & Gas | |
| MarketCap: 3197.73 Millions | |
| Recent Price: 53.11 Smart Investing & Trading Score: 68 | |
| Day Percent Change: 2.11% Day Change: 1.10 | |
| Week Change: -0.17% Year-to-date Change: 5.9% | |
| NFG Links: Profile News Message Board | |
| Charts:- Daily , Weekly | |
| Add NFG to Watchlist: View: Get Complete NFG Trend Analysis ➞ | |
 | CTRA Contura Energy, Inc. |
| Sector: Materials | |
| SubSector: Industrial Metals & Minerals | |
| MarketCap: 75.291 Millions | |
| Recent Price: 27.80 Smart Investing & Trading Score: 61 | |
| Day Percent Change: 2.11% Day Change: 0.58 | |
| Week Change: 0.56% Year-to-date Change: 8.9% | |
| CTRA Links: Profile News Message Board | |
| Charts:- Daily , Weekly | |
| Add CTRA to Watchlist: View: Get Complete CTRA Trend Analysis ➞ | |
 | BWA BorgWarner Inc. |
| Sector: Consumer Staples | |
| SubSector: Auto Parts | |
| MarketCap: 4604.09 Millions | |
| Recent Price: 32.78 Smart Investing & Trading Score: 35 | |
| Day Percent Change: 2.09% Day Change: 0.67 | |
| Week Change: -2.15% Year-to-date Change: -8.6% | |
| BWA Links: Profile News Message Board | |
| Charts:- Daily , Weekly | |
| Add BWA to Watchlist: View: Get Complete BWA Trend Analysis ➞ | |
 | ESTC Elastic N.V. |
| Sector: Technology | |
| SubSector: Application Software | |
| MarketCap: 4420.92 Millions | |
| Recent Price: 97.29 Smart Investing & Trading Score: 35 | |
| Day Percent Change: 2.08% Day Change: 1.98 | |
| Week Change: 0.05% Year-to-date Change: -13.7% | |
| ESTC Links: Profile News Message Board | |
| Charts:- Daily , Weekly | |
| Add ESTC to Watchlist: View: Get Complete ESTC Trend Analysis ➞ | |
 | WPC W. P. Carey Inc. |
| Sector: Financials | |
| SubSector: REIT - Diversified | |
| MarketCap: 9560.03 Millions | |
| Recent Price: 55.78 Smart Investing & Trading Score: 52 | |
| Day Percent Change: 2.07% Day Change: 1.13 | |
| Week Change: 1.47% Year-to-date Change: -13.9% | |
| WPC Links: Profile News Message Board | |
| Charts:- Daily , Weekly | |
| Add WPC to Watchlist: View: Get Complete WPC Trend Analysis ➞ | |
 | COLB Columbia Banking System, Inc. |
| Sector: Financials | |
| SubSector: Savings & Loans | |
| MarketCap: 1868.3 Millions | |
| Recent Price: 18.11 Smart Investing & Trading Score: 52 | |
| Day Percent Change: 2.06% Day Change: 0.37 | |
| Week Change: 2.58% Year-to-date Change: -32.1% | |
| COLB Links: Profile News Message Board | |
| Charts:- Daily , Weekly | |
| Add COLB to Watchlist: View: Get Complete COLB Trend Analysis ➞ | |
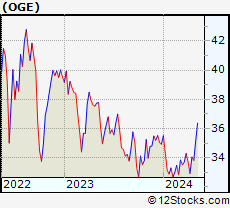 | OGE OGE Energy Corp. |
| Sector: Utilities | |
| SubSector: Electric Utilities | |
| MarketCap: 5454.34 Millions | |
| Recent Price: 33.83 Smart Investing & Trading Score: 65 | |
| Day Percent Change: 2.05% Day Change: 0.68 | |
| Week Change: 2.76% Year-to-date Change: -3.2% | |
| OGE Links: Profile News Message Board | |
| Charts:- Daily , Weekly | |
| Add OGE to Watchlist: View: Get Complete OGE Trend Analysis ➞ | |
 | ALL The Allstate Corporation |
| Sector: Financials | |
| SubSector: Property & Casualty Insurance | |
| MarketCap: 25916.6 Millions | |
| Recent Price: 172.56 Smart Investing & Trading Score: 76 | |
| Day Percent Change: 2.04% Day Change: 3.45 | |
| Week Change: 3.45% Year-to-date Change: 23.3% | |
| ALL Links: Profile News Message Board | |
| Charts:- Daily , Weekly | |
| Add ALL to Watchlist: View: Get Complete ALL Trend Analysis ➞ | |
 | EIX Edison International |
| Sector: Utilities | |
| SubSector: Electric Utilities | |
| MarketCap: 19358.1 Millions | |
| Recent Price: 69.52 Smart Investing & Trading Score: 68 | |
| Day Percent Change: 2.04% Day Change: 1.39 | |
| Week Change: 1.3% Year-to-date Change: -2.8% | |
| EIX Links: Profile News Message Board | |
| Charts:- Daily , Weekly | |
| Add EIX to Watchlist: View: Get Complete EIX Trend Analysis ➞ | |
 | OMF OneMain Holdings, Inc. |
| Sector: Financials | |
| SubSector: Credit Services | |
| MarketCap: 2753.38 Millions | |
| Recent Price: 48.87 Smart Investing & Trading Score: 50 | |
| Day Percent Change: 2.03% Day Change: 0.97 | |
| Week Change: 4.6% Year-to-date Change: -0.7% | |
| OMF Links: Profile News Message Board | |
| Charts:- Daily , Weekly | |
| Add OMF to Watchlist: View: Get Complete OMF Trend Analysis ➞ | |
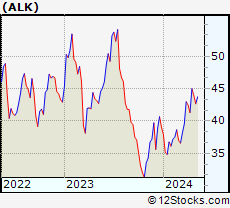 | ALK Alaska Air Group, Inc. |
| Sector: Transports | |
| SubSector: Regional Airlines | |
| MarketCap: 3772.5 Millions | |
| Recent Price: 45.34 Smart Investing & Trading Score: 100 | |
| Day Percent Change: 2.01% Day Change: 0.90 | |
| Week Change: 9.77% Year-to-date Change: 16.0% | |
| ALK Links: Profile News Message Board | |
| Charts:- Daily , Weekly | |
| Add ALK to Watchlist: View: Get Complete ALK Trend Analysis ➞ | |
 | EBAY eBay Inc. |
| Sector: Services & Goods | |
| SubSector: Specialty Retail, Other | |
| MarketCap: 23152.3 Millions | |
| Recent Price: 50.95 Smart Investing & Trading Score: 68 | |
| Day Percent Change: 2.01% Day Change: 1.00 | |
| Week Change: -0.69% Year-to-date Change: 16.8% | |
| EBAY Links: Profile News Message Board | |
| Charts:- Daily , Weekly | |
| Add EBAY to Watchlist: View: Get Complete EBAY Trend Analysis ➞ | |
 | ORI Old Republic International Corporation |
| Sector: Financials | |
| SubSector: Property & Casualty Insurance | |
| MarketCap: 4420.92 Millions | |
| Recent Price: 29.70 Smart Investing & Trading Score: 58 | |
| Day Percent Change: 1.99% Day Change: 0.58 | |
| Week Change: 1.23% Year-to-date Change: 1.0% | |
| ORI Links: Profile News Message Board | |
| Charts:- Daily , Weekly | |
| Add ORI to Watchlist: View: Get Complete ORI Trend Analysis ➞ | |
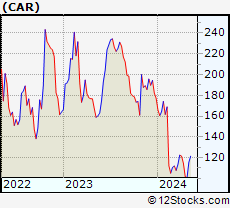 | CAR Avis Budget Group, Inc. |
| Sector: Transports | |
| SubSector: Rental & Leasing Services | |
| MarketCap: 1020.44 Millions | |
| Recent Price: 104.03 Smart Investing & Trading Score: 10 | |
| Day Percent Change: 1.99% Day Change: 2.03 | |
| Week Change: -9.33% Year-to-date Change: -41.3% | |
| CAR Links: Profile News Message Board | |
| Charts:- Daily , Weekly | |
| Add CAR to Watchlist: View: Get Complete CAR Trend Analysis ➞ | |
 | LNC Lincoln National Corporation |
| Sector: Financials | |
| SubSector: Life Insurance | |
| MarketCap: 4545.26 Millions | |
| Recent Price: 27.77 Smart Investing & Trading Score: 68 | |
| Day Percent Change: 1.98% Day Change: 0.54 | |
| Week Change: -1.8% Year-to-date Change: 3.0% | |
| LNC Links: Profile News Message Board | |
| Charts:- Daily , Weekly | |
| Add LNC to Watchlist: View: Get Complete LNC Trend Analysis ➞ | |
 | UA Under Armour, Inc. |
| Sector: Services & Goods | |
| SubSector: Textile - Apparel Clothing | |
| MarketCap: 3926.93 Millions | |
| Recent Price: 6.49 Smart Investing & Trading Score: 42 | |
| Day Percent Change: 1.97% Day Change: 0.13 | |
| Week Change: 3.1% Year-to-date Change: -22.3% | |
| UA Links: Profile News Message Board | |
| Charts:- Daily , Weekly | |
| Add UA to Watchlist: View: Get Complete UA Trend Analysis ➞ | |
 | PSX Phillips 66 |
| Sector: Energy | |
| SubSector: Oil & Gas Refining & Marketing | |
| MarketCap: 25253.6 Millions | |
| Recent Price: 156.33 Smart Investing & Trading Score: 41 | |
| Day Percent Change: 1.97% Day Change: 3.02 | |
| Week Change: -3.79% Year-to-date Change: 17.4% | |
| PSX Links: Profile News Message Board | |
| Charts:- Daily , Weekly | |
| Add PSX to Watchlist: View: Get Complete PSX Trend Analysis ➞ | |
 | ETR Entergy Corporation |
| Sector: Utilities | |
| SubSector: Electric Utilities | |
| MarketCap: 17545 Millions | |
| Recent Price: 105.78 Smart Investing & Trading Score: 73 | |
| Day Percent Change: 1.95% Day Change: 2.03 | |
| Week Change: 2.78% Year-to-date Change: 4.5% | |
| ETR Links: Profile News Message Board | |
| Charts:- Daily , Weekly | |
| Add ETR to Watchlist: View: Get Complete ETR Trend Analysis ➞ | |
 | BHF Brighthouse Financial, Inc. |
| Sector: Financials | |
| SubSector: Life Insurance | |
| MarketCap: 2045.06 Millions | |
| Recent Price: 48.51 Smart Investing & Trading Score: 32 | |
| Day Percent Change: 1.95% Day Change: 0.93 | |
| Week Change: 1.15% Year-to-date Change: -8.3% | |
| BHF Links: Profile News Message Board | |
| Charts:- Daily , Weekly | |
| Add BHF to Watchlist: View: Get Complete BHF Trend Analysis ➞ | |
 | AFL Aflac Incorporated |
| Sector: Financials | |
| SubSector: Accident & Health Insurance | |
| MarketCap: 22706 Millions | |
| Recent Price: 82.55 Smart Investing & Trading Score: 32 | |
| Day Percent Change: 1.94% Day Change: 1.57 | |
| Week Change: 2.83% Year-to-date Change: 0.1% | |
| AFL Links: Profile News Message Board | |
| Charts:- Daily , Weekly | |
| Add AFL to Watchlist: View: Get Complete AFL Trend Analysis ➞ | |
 | KSS Kohl s Corporation |
| Sector: Services & Goods | |
| SubSector: Department Stores | |
| MarketCap: 3068 Millions | |
| Recent Price: 23.29 Smart Investing & Trading Score: 32 | |
| Day Percent Change: 1.93% Day Change: 0.44 | |
| Week Change: 2.46% Year-to-date Change: -18.8% | |
| KSS Links: Profile News Message Board | |
| Charts:- Daily , Weekly | |
| Add KSS to Watchlist: View: Get Complete KSS Trend Analysis ➞ | |
| For tabular summary view of above stock list: Summary View ➞ 0 - 25 , 25 - 50 , 50 - 75 , 75 - 100 , 100 - 125 , 125 - 150 , 150 - 175 , 175 - 200 , 200 - 225 , 225 - 250 , 250 - 275 , 275 - 300 , 300 - 325 , 325 - 350 , 350 - 375 , 375 - 400 , 400 - 425 , 425 - 450 , 450 - 475 , 475 - 500 , 500 - 525 , 525 - 550 , 550 - 575 , 575 - 600 , 600 - 625 , 625 - 650 , 650 - 675 , 675 - 700 , 700 - 725 , 725 - 750 | ||
| Click To Change The Sort Order: By Market Cap or Company Size Performance: Year-to-date, Week and Day | |
| Select Chart Type: | ||
|
Best Stocks Today 12Stocks.com |
© 2024 12Stocks.com Terms & Conditions Privacy Contact Us
All Information Provided Only For Education And Not To Be Used For Investing or Trading. See Terms & Conditions


One More Thing ... Get Best Stocks Delivered Daily!
Never Ever Miss A Move With Our Top Ten Stocks Lists
Find Best Stocks In Any Market - Bull or Bear Market
Take A Peek At Our Top Ten Stocks Lists: Daily, Weekly, Year-to-Date & Top Trends
Find Best Stocks In Any Market - Bull or Bear Market
Take A Peek At Our Top Ten Stocks Lists: Daily, Weekly, Year-to-Date & Top Trends
Midcap Stocks With Best Up Trends [0-bearish to 100-bullish]: Bunge [100], Alaska Air[100], Conagra [100], Genuine Parts[100], Flowers Foods[100], United Airlines[100], Medical Properties[100], Generac [93], Commerce Bancshares[93], United [93], Inspire Medical[93]
Best Midcap Stocks Year-to-Date:
ShockWave Medical[71.95%], Vistra Energy[71.92%], AppLovin [69.92%], Constellation Energy[57.45%], EMCOR [54.5%], Spotify [47.6%], CAVA [39.8%], Pure Storage[39.01%], Williams-Sonoma [38.26%], Wingstop [37.35%], Allison Transmission[36.14%] Best Midcap Stocks This Week:
United Airlines[23.18%], AMC Entertainment[17.36%], Medical Properties[17.04%], Genuine Parts[10.93%], Globe Life[10.86%], agilon health[10.71%], Advance Auto[10.04%], Alaska Air[9.77%], Iridium [8.72%], American Airlines[8.4%], UGI [7.97%] Best Midcap Stocks Daily:
AMC Entertainment[6.51%], UGI [6.47%], Fifth Third[5.13%], agilon health[4.48%], Hawaiian Electric[4.11%], Darling Ingredients[3.74%], SSR Mining[3.50%], Bunge [2.96%], Iridium [2.92%], DXC [2.86%], Penn National[2.76%]