
 Login Sign Up


| |||||
 |  | ||||

| 12Stocks.com Market Intelligence |
Best MidCap Stocks
|
| In a hurry? Mid Cap Stocks Lists: Performance Trends Table, Stock Charts
Sort midcap stocks: Daily, Weekly, Year-to-Date, Market Cap & Trends. Filter midcap stocks list by sector: Show all, Tech, Finance, Energy, Staples, Retail, Industrial, Materials, Utilities and HealthCare Filter midcap stocks list by size:All MidCap Large Mid-Range Small |
| 12Stocks.com Mid Cap Stocks Performances & Trends Daily | |||||||||
|
|  The overall Smart Investing & Trading Score is 45 (0-bearish to 100-bullish) which puts Mid Cap index in short term neutral trend. The Smart Investing & Trading Score from previous trading session is 7 and hence an improvement of trend.
| ||||||||
Here are the Smart Investing & Trading Scores of the most requested mid cap stocks at 12Stocks.com (click stock name for detailed review):
|


| 12Stocks.com: Top Performing Mid Cap Index Stocks | ||||||||||||||||||||||||||||||||||||||||||||||||
 The top performing Mid Cap Index stocks year to date are
Now, more recently, over last week, the top performing Mid Cap Index stocks on the move are


|
||||||||||||||||||||||||||||||||||||||||||||||||
| 12Stocks.com: Investing in Midcap Index with Stocks | |
|
The following table helps investors and traders sort through current performance and trends (as measured by Smart Investing & Trading Score) of various
stocks in the Midcap Index. Quick View: Move mouse or cursor over stock symbol (ticker) to view short-term technical chart and over stock name to view long term chart. Click on  to add stock symbol to your watchlist and to add stock symbol to your watchlist and  to view watchlist. Click on any ticker or stock name for detailed market intelligence report for that stock. to view watchlist. Click on any ticker or stock name for detailed market intelligence report for that stock. |
12Stocks.com Performance of Stocks in Midcap Index
| Ticker | Stock Name | Watchlist | Category | Recent Price | Smart Investing & Trading Score | Change % | YTD Change% |
| WTM | White Mountains |   | Financials | 1825.67 | 100 | 0.11 | 21.31% |
| RGA | Reinsurance | | Financials | 191.13 | 85 | 0.11 | 18.14% |
| RNR | RenaissanceRe | | Financials | 218.56 | 40 | 0.11 | 11.51% |
| PCAR | PACCAR | | Consumer Staples | 106.46 | 10 | 0.11 | 9.02% |
| X | United States | | Materials | 37.02 | 35 | 0.11 | -23.91% |
| STT | State Street | | Financials | 73.18 | 23 | 0.10 | -5.53% |
| TPL | Texas Pacific | | Financials | 559.26 | 15 | 0.10 | -64.43% |
| POST | Post | | Consumer Staples | 104.92 | 53 | 0.10 | 19.15% |
| PFGC | Performance Food | | Services & Goods | 68.49 | 35 | 0.09 | -0.95% |
| COO | Cooper | | Health Care | 89.75 | 18 | 0.09 | -5.14% |
| COLM | Columbia Sportswear | | Consumer Staples | 81.56 | 69 | 0.09 | 2.53% |
| PINS | | Industrials | 40.52 | 80 | 0.09 | 9.38% | |
| ROK | Rockwell Automation | | Industrials | 269.97 | 0 | 0.08 | -13.05% |
| OMF | OneMain | | Financials | 50.80 | 63 | 0.08 | 3.25% |
| SWAV | ShockWave Medical | | Health Care | 330.10 | 75 | 0.08 | 73.23% |
| CAVA | CAVA | | Services & Goods | 68.06 | 53 | 0.08 | 56.54% |
| SWN | Southwestern Energy | | Energy | 7.22 | 26 | 0.07 | 10.31% |
| JKHY | Jack Henry | | Technology | 162.61 | 10 | 0.06 | -0.49% |
| ZI | ZoomInfo Technologies | | Technology | 16.37 | 67 | 0.06 | -11.47% |
| AIRC | Apartment ome | | Financials | 38.52 | 75 | 0.06 | 10.37% |
| CLX | Clorox | | Consumer Staples | 139.67 | 0 | 0.03 | -2.05% |
| FLS | Flowserve | | Industrials | 47.24 | 71 | 0.02 | 14.60% |
| AR | Antero Resources | | Energy | 32.66 | 63 | 0.02 | 44.03% |
| XEL | Xcel Energy | | Utilities | 53.78 | 61 | 0.01 | -13.12% |
| OKE | ONEOK | | Utilities | 76.92 | 26 | 0.00 | 9.54% |
| For chart view version of above stock list: Chart View ➞ 0 - 25 , 25 - 50 , 50 - 75 , 75 - 100 , 100 - 125 , 125 - 150 , 150 - 175 , 175 - 200 , 200 - 225 , 225 - 250 , 250 - 275 , 275 - 300 , 300 - 325 , 325 - 350 , 350 - 375 , 375 - 400 , 400 - 425 , 425 - 450 , 450 - 475 , 475 - 500 , 500 - 525 , 525 - 550 , 550 - 575 , 575 - 600 , 600 - 625 , 625 - 650 , 650 - 675 , 675 - 700 , 700 - 725 , 725 - 750 , 750 - 775 | ||
 | Click To Change The Sort Order: By Market Cap or Company Size Performance: Year-to-date, Week and Day |  |
|
Get the most comprehensive stock market coverage daily at 12Stocks.com ➞ Best Stocks Today ➞ Best Stocks Weekly ➞ Best Stocks Year-to-Date ➞ Best Stocks Trends ➞  Best Stocks Today 12Stocks.com Best Nasdaq Stocks ➞ Best S&P 500 Stocks ➞ Best Tech Stocks ➞ Best Biotech Stocks ➞ |
| Detailed Overview of Midcap Stocks |
| Midcap Technical Overview, Leaders & Laggards, Top Midcap ETF Funds & Detailed Midcap Stocks List, Charts, Trends & More |
| Midcap: Technical Analysis, Trends & YTD Performance | |
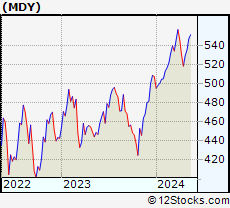
| MidCap segment as represented by
MDY, an exchange-traded fund [ETF], holds basket of about four hundred midcap stocks from across all major sectors of the US stock market. The midcap index (contains stocks like Green Mountain Coffee Roasters and Tractor Supply Company) is up by 4.51% and is currently underperforming the overall market by -1.1% year-to-date. Below is a quick view of technical charts and trends: | |
 MDY Weekly Chart |
|
| Long Term Trend: Good | |
| Medium Term Trend: Good | |
 MDY Daily Chart |
|
| Short Term Trend: Deteriorating | |
| Overall Trend Score: 45 | |
| YTD Performance: 4.51% | |
| **Trend Scores & Views Are Only For Educational Purposes And Not For Investing | |
| 12Stocks.com: Investing in Midcap Index using Exchange Traded Funds | |
|
The following table shows list of key exchange traded funds (ETF) that
help investors track Midcap index. The following list also includes leveraged ETF funds that track twice or thrice the daily returns of Midcap indices. Short or inverse ETF funds move in the opposite direction to the index they track and are useful during market pullbacks or during bear markets. Quick View: Move mouse or cursor over ETF symbol (ticker) to view short-term technical chart and over ETF name to view long term chart. Click on ticker or stock name for detailed view. Click on to add stock symbol to your watchlist and to view watchlist. |
12Stocks.com List of ETFs that track Midcap Index
| Ticker | ETF Name | Watchlist | Recent Price | Smart Investing & Trading Score | Change % | Week % | Year-to-date % |
| IJH | iShares Core S&P Mid-Cap | | 57.95 | 38 | 1.38 | 0.22 | 4.55% |
| IWR | iShares Russell Mid-Cap | | 80.21 | 17 | 0.92 | -0.38 | 3.19% |
| MDY | SPDR S&P MidCap 400 ETF | | 530.27 | 45 | 1.35 | 0.17 | 4.51% |
| IWP | iShares Russell Mid-Cap Growth | | 108.08 | 17 | 0.57 | -0.83 | 3.46% |
| IWS | iShares Russell Mid-Cap Value | | 119.79 | 38 | 0.85 | -0.17 | 3.01% |
| IJK | iShares S&P Mid-Cap 400 Growth | | 86.98 | 30 | 1.34 | -0.02 | 9.8% |
| IJJ | iShares S&P Mid-Cap 400 Value | | 112.71 | 25 | 1.29 | 0.43 | -1.17% |
| MVV | ProShares Ultra MidCap400 | | 61.27 | 17 | 2.18 | -0.26 | 5.84% |
| XMLV | PowerShares S&P MidCap Low Volatil ETF | | 55.16 | 40 | 0.84 | 0.93 | 3.72% |
| MZZ | ProShares UltraShort MidCap400 | | 11.77 | 46 | -1.59 | 0.77 | -6.37% |
| UMDD | ProShares UltraPro MidCap400 | | 23.94 | 10 | 3.44 | -0.08 | 7.26% |
| SMDD | ProShares UltraPro Short MidCap400 | | 11.96 | 40 | -1.84 | 1.1 | -11.17% |
| MYY | ProShares Short MidCap400 | | 20.73 | 70 | -1.31 | -0.29 | -3.38% |
| 12Stocks.com: Charts, Trends, Fundamental Data and Performances of MidCap Stocks | |
|
We now take in-depth look at all MidCap stocks including charts, multi-period performances and overall trends (as measured by Smart Investing & Trading Score). One can sort MidCap stocks (click link to choose) by Daily, Weekly and by Year-to-Date performances. Also, one can sort by size of the company or by market capitalization. |
| Select Your Default Chart Type: | |||||
| |||||
| Click on stock symbol or name for detailed view. Click on to add stock symbol to your watchlist and to view watchlist. Quick View: Move mouse or cursor over "Daily" to quickly view daily technical stock chart and over "Weekly" to view weekly technical stock chart. | |||||

 | WTM White Mountains Insurance Group, Ltd. |
| Sector: Financials | |
| SubSector: Property & Casualty Insurance | |
| MarketCap: 2502.62 Millions | |
| Recent Price: 1825.67 Smart Investing & Trading Score: 100 | |
| Day Percent Change: 0.11% Day Change: 1.93 | |
| Week Change: 3.24% Year-to-date Change: 21.3% | |
| WTM Links: Profile News Message Board | |
| Charts:- Daily , Weekly | |
| Add WTM to Watchlist: View: Get Complete WTM Trend Analysis ➞ | |
 | RGA Reinsurance Group of America, Incorporated |
| Sector: Financials | |
| SubSector: Life Insurance | |
| MarketCap: 4423.36 Millions | |
| Recent Price: 191.13 Smart Investing & Trading Score: 85 | |
| Day Percent Change: 0.11% Day Change: 0.21 | |
| Week Change: 1.24% Year-to-date Change: 18.1% | |
| RGA Links: Profile News Message Board | |
| Charts:- Daily , Weekly | |
| Add RGA to Watchlist: View: Get Complete RGA Trend Analysis ➞ | |
 | RNR RenaissanceRe Holdings Ltd. |
| Sector: Financials | |
| SubSector: Property & Casualty Insurance | |
| MarketCap: 6153.32 Millions | |
| Recent Price: 218.56 Smart Investing & Trading Score: 40 | |
| Day Percent Change: 0.11% Day Change: 0.24 | |
| Week Change: -0.24% Year-to-date Change: 11.5% | |
| RNR Links: Profile News Message Board | |
| Charts:- Daily , Weekly | |
| Add RNR to Watchlist: View: Get Complete RNR Trend Analysis ➞ | |
 | PCAR PACCAR Inc |
| Sector: Consumer Staples | |
| SubSector: Trucks & Other Vehicles | |
| MarketCap: 19117.7 Millions | |
| Recent Price: 106.46 Smart Investing & Trading Score: 10 | |
| Day Percent Change: 0.11% Day Change: 0.12 | |
| Week Change: -4.91% Year-to-date Change: 9.0% | |
| PCAR Links: Profile News Message Board | |
| Charts:- Daily , Weekly | |
| Add PCAR to Watchlist: View: Get Complete PCAR Trend Analysis ➞ | |
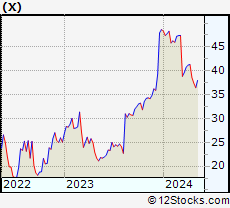 | X United States Steel Corporation |
| Sector: Materials | |
| SubSector: Steel & Iron | |
| MarketCap: 1062.88 Millions | |
| Recent Price: 37.02 Smart Investing & Trading Score: 35 | |
| Day Percent Change: 0.11% Day Change: 0.04 | |
| Week Change: -1.07% Year-to-date Change: -23.9% | |
| X Links: Profile News Message Board | |
| Charts:- Daily , Weekly | |
| Add X to Watchlist: View: Get Complete X Trend Analysis ➞ | |
 | STT State Street Corporation |
| Sector: Financials | |
| SubSector: Asset Management | |
| MarketCap: 18623 Millions | |
| Recent Price: 73.18 Smart Investing & Trading Score: 23 | |
| Day Percent Change: 0.10% Day Change: 0.07 | |
| Week Change: -0.29% Year-to-date Change: -5.5% | |
| STT Links: Profile News Message Board | |
| Charts:- Daily , Weekly | |
| Add STT to Watchlist: View: Get Complete STT Trend Analysis ➞ | |
 | TPL Texas Pacific Land Trust |
| Sector: Financials | |
| SubSector: Real Estate Development | |
| MarketCap: 3052.29 Millions | |
| Recent Price: 559.26 Smart Investing & Trading Score: 15 | |
| Day Percent Change: 0.10% Day Change: 0.57 | |
| Week Change: -6.11% Year-to-date Change: -64.4% | |
| TPL Links: Profile News Message Board | |
| Charts:- Daily , Weekly | |
| Add TPL to Watchlist: View: Get Complete TPL Trend Analysis ➞ | |
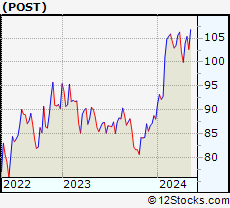 | POST Post Holdings, Inc. |
| Sector: Consumer Staples | |
| SubSector: Food - Major Diversified | |
| MarketCap: 5576.53 Millions | |
| Recent Price: 104.92 Smart Investing & Trading Score: 53 | |
| Day Percent Change: 0.10% Day Change: 0.10 | |
| Week Change: -0.44% Year-to-date Change: 19.2% | |
| POST Links: Profile News Message Board | |
| Charts:- Daily , Weekly | |
| Add POST to Watchlist: View: Get Complete POST Trend Analysis ➞ | |
 | PFGC Performance Food Group Company |
| Sector: Services & Goods | |
| SubSector: Restaurants | |
| MarketCap: 2457.5 Millions | |
| Recent Price: 68.49 Smart Investing & Trading Score: 35 | |
| Day Percent Change: 0.09% Day Change: 0.06 | |
| Week Change: -0.52% Year-to-date Change: -1.0% | |
| PFGC Links: Profile News Message Board | |
| Charts:- Daily , Weekly | |
| Add PFGC to Watchlist: View: Get Complete PFGC Trend Analysis ➞ | |
 | COO The Cooper Companies, Inc. |
| Sector: Health Care | |
| SubSector: Medical Instruments & Supplies | |
| MarketCap: 15460 Millions | |
| Recent Price: 89.75 Smart Investing & Trading Score: 18 | |
| Day Percent Change: 0.09% Day Change: 0.09 | |
| Week Change: 1.02% Year-to-date Change: -5.1% | |
| COO Links: Profile News Message Board | |
| Charts:- Daily , Weekly | |
| Add COO to Watchlist: View: Get Complete COO Trend Analysis ➞ | |
 | COLM Columbia Sportswear Company |
| Sector: Consumer Staples | |
| SubSector: Textile - Apparel Clothing | |
| MarketCap: 4371.75 Millions | |
| Recent Price: 81.56 Smart Investing & Trading Score: 69 | |
| Day Percent Change: 0.09% Day Change: 0.08 | |
| Week Change: 1.94% Year-to-date Change: 2.5% | |
| COLM Links: Profile News Message Board | |
| Charts:- Daily , Weekly | |
| Add COLM to Watchlist: View: Get Complete COLM Trend Analysis ➞ | |
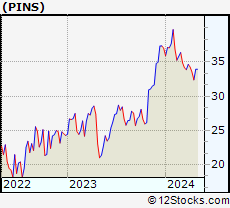 | PINS Pinterest, Inc. |
| Sector: Industrials | |
| SubSector: Conglomerates | |
| MarketCap: 8115.78 Millions | |
| Recent Price: 40.52 Smart Investing & Trading Score: 80 | |
| Day Percent Change: 0.09% Day Change: 0.04 | |
| Week Change: 19.3% Year-to-date Change: 9.4% | |
| PINS Links: Profile News Message Board | |
| Charts:- Daily , Weekly | |
| Add PINS to Watchlist: View: Get Complete PINS Trend Analysis ➞ | |
 | ROK Rockwell Automation, Inc. |
| Sector: Industrials | |
| SubSector: Diversified Machinery | |
| MarketCap: 15666.1 Millions | |
| Recent Price: 269.97 Smart Investing & Trading Score: 0 | |
| Day Percent Change: 0.08% Day Change: 0.22 | |
| Week Change: -3.62% Year-to-date Change: -13.1% | |
| ROK Links: Profile News Message Board | |
| Charts:- Daily , Weekly | |
| Add ROK to Watchlist: View: Get Complete ROK Trend Analysis ➞ | |
 | OMF OneMain Holdings, Inc. |
| Sector: Financials | |
| SubSector: Credit Services | |
| MarketCap: 2753.38 Millions | |
| Recent Price: 50.80 Smart Investing & Trading Score: 63 | |
| Day Percent Change: 0.08% Day Change: 0.04 | |
| Week Change: -0.18% Year-to-date Change: 3.3% | |
| OMF Links: Profile News Message Board | |
| Charts:- Daily , Weekly | |
| Add OMF to Watchlist: View: Get Complete OMF Trend Analysis ➞ | |
 | SWAV ShockWave Medical, Inc. |
| Sector: Health Care | |
| SubSector: Medical Appliances & Equipment | |
| MarketCap: 855.58 Millions | |
| Recent Price: 330.10 Smart Investing & Trading Score: 75 | |
| Day Percent Change: 0.08% Day Change: 0.26 | |
| Week Change: 0.03% Year-to-date Change: 73.2% | |
| SWAV Links: Profile News Message Board | |
| Charts:- Daily , Weekly | |
| Add SWAV to Watchlist: View: Get Complete SWAV Trend Analysis ➞ | |
 | CAVA CAVA Group, Inc. |
| Sector: Services & Goods | |
| SubSector: Restaurants | |
| MarketCap: 4510 Millions | |
| Recent Price: 68.06 Smart Investing & Trading Score: 53 | |
| Day Percent Change: 0.08% Day Change: 0.05 | |
| Week Change: -1.58% Year-to-date Change: 56.5% | |
| CAVA Links: Profile News Message Board | |
| Charts:- Daily , Weekly | |
| Add CAVA to Watchlist: View: Get Complete CAVA Trend Analysis ➞ | |
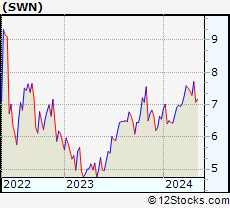 | SWN Southwestern Energy Company |
| Sector: Energy | |
| SubSector: Independent Oil & Gas | |
| MarketCap: 1122.03 Millions | |
| Recent Price: 7.22 Smart Investing & Trading Score: 26 | |
| Day Percent Change: 0.07% Day Change: 0.00 | |
| Week Change: -6.29% Year-to-date Change: 10.3% | |
| SWN Links: Profile News Message Board | |
| Charts:- Daily , Weekly | |
| Add SWN to Watchlist: View: Get Complete SWN Trend Analysis ➞ | |
 | JKHY Jack Henry & Associates, Inc. |
| Sector: Technology | |
| SubSector: Information Technology Services | |
| MarketCap: 10695.4 Millions | |
| Recent Price: 162.61 Smart Investing & Trading Score: 10 | |
| Day Percent Change: 0.06% Day Change: 0.09 | |
| Week Change: -1.38% Year-to-date Change: -0.5% | |
| JKHY Links: Profile News Message Board | |
| Charts:- Daily , Weekly | |
| Add JKHY to Watchlist: View: Get Complete JKHY Trend Analysis ➞ | |
 | ZI ZoomInfo Technologies Inc. |
| Sector: Technology | |
| SubSector: Software Application | |
| MarketCap: 15937 Millions | |
| Recent Price: 16.37 Smart Investing & Trading Score: 67 | |
| Day Percent Change: 0.06% Day Change: 0.01 | |
| Week Change: 0% Year-to-date Change: -11.5% | |
| ZI Links: Profile News Message Board | |
| Charts:- Daily , Weekly | |
| Add ZI to Watchlist: View: Get Complete ZI Trend Analysis ➞ | |
 | AIRC Apartment Income REIT Corp. |
| Sector: Financials | |
| SubSector: REIT - Residential | |
| MarketCap: 5280 Millions | |
| Recent Price: 38.52 Smart Investing & Trading Score: 75 | |
| Day Percent Change: 0.06% Day Change: 0.02 | |
| Week Change: 0.3% Year-to-date Change: 10.4% | |
| AIRC Links: Profile News Message Board | |
| Charts:- Daily , Weekly | |
| Add AIRC to Watchlist: View: Get Complete AIRC Trend Analysis ➞ | |
 | CLX The Clorox Company |
| Sector: Consumer Staples | |
| SubSector: Housewares & Accessories | |
| MarketCap: 23688.3 Millions | |
| Recent Price: 139.67 Smart Investing & Trading Score: 0 | |
| Day Percent Change: 0.03% Day Change: 0.04 | |
| Week Change: -4.65% Year-to-date Change: -2.1% | |
| CLX Links: Profile News Message Board | |
| Charts:- Daily , Weekly | |
| Add CLX to Watchlist: View: Get Complete CLX Trend Analysis ➞ | |
 | FLS Flowserve Corporation |
| Sector: Industrials | |
| SubSector: Diversified Machinery | |
| MarketCap: 2974.66 Millions | |
| Recent Price: 47.24 Smart Investing & Trading Score: 71 | |
| Day Percent Change: 0.02% Day Change: 0.01 | |
| Week Change: 1.03% Year-to-date Change: 14.6% | |
| FLS Links: Profile News Message Board | |
| Charts:- Daily , Weekly | |
| Add FLS to Watchlist: View: Get Complete FLS Trend Analysis ➞ | |
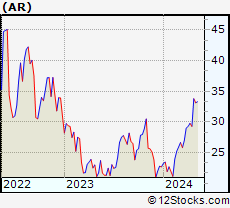 | AR Antero Resources Corporation |
| Sector: Energy | |
| SubSector: Oil & Gas Drilling & Exploration | |
| MarketCap: 256.939 Millions | |
| Recent Price: 32.66 Smart Investing & Trading Score: 63 | |
| Day Percent Change: 0.02% Day Change: 0.01 | |
| Week Change: -3.36% Year-to-date Change: 44.0% | |
| AR Links: Profile News Message Board | |
| Charts:- Daily , Weekly | |
| Add AR to Watchlist: View: Get Complete AR Trend Analysis ➞ | |
 | XEL Xcel Energy Inc. |
| Sector: Utilities | |
| SubSector: Electric Utilities | |
| MarketCap: 28960.8 Millions | |
| Recent Price: 53.78 Smart Investing & Trading Score: 61 | |
| Day Percent Change: 0.01% Day Change: 0.00 | |
| Week Change: -0.32% Year-to-date Change: -13.1% | |
| XEL Links: Profile News Message Board | |
| Charts:- Daily , Weekly | |
| Add XEL to Watchlist: View: Get Complete XEL Trend Analysis ➞ | |
 | OKE ONEOK, Inc. |
| Sector: Utilities | |
| SubSector: Gas Utilities | |
| MarketCap: 10788.7 Millions | |
| Recent Price: 76.92 Smart Investing & Trading Score: 26 | |
| Day Percent Change: 0.00% Day Change: 0.00 | |
| Week Change: -5.11% Year-to-date Change: 9.5% | |
| OKE Links: Profile News Message Board | |
| Charts:- Daily , Weekly | |
| Add OKE to Watchlist: View: Get Complete OKE Trend Analysis ➞ | |
| For tabular summary view of above stock list: Summary View ➞ 0 - 25 , 25 - 50 , 50 - 75 , 75 - 100 , 100 - 125 , 125 - 150 , 150 - 175 , 175 - 200 , 200 - 225 , 225 - 250 , 250 - 275 , 275 - 300 , 300 - 325 , 325 - 350 , 350 - 375 , 375 - 400 , 400 - 425 , 425 - 450 , 450 - 475 , 475 - 500 , 500 - 525 , 525 - 550 , 550 - 575 , 575 - 600 , 600 - 625 , 625 - 650 , 650 - 675 , 675 - 700 , 700 - 725 , 725 - 750 , 750 - 775 | ||
| Click To Change The Sort Order: By Market Cap or Company Size Performance: Year-to-date, Week and Day | |
| Select Chart Type: | ||
|
Best Stocks Today 12Stocks.com |
© 2024 12Stocks.com Terms & Conditions Privacy Contact Us
All Information Provided Only For Education And Not To Be Used For Investing or Trading. See Terms & Conditions


One More Thing ... Get Best Stocks Delivered Daily!
Never Ever Miss A Move With Our Top Ten Stocks Lists
Find Best Stocks In Any Market - Bull or Bear Market
Take A Peek At Our Top Ten Stocks Lists: Daily, Weekly, Year-to-Date & Top Trends
Find Best Stocks In Any Market - Bull or Bear Market
Take A Peek At Our Top Ten Stocks Lists: Daily, Weekly, Year-to-Date & Top Trends
Midcap Stocks With Best Up Trends [0-bearish to 100-bullish]: Avis Budget[100], Valmont Industries[100], C.H. Robinson[100], BorgWarner [100], Kellogg [100], WESCO [100], Markel [100], WestRock [100], Tetra Tech[100], Cognex [100], Ventas [100]
Best Midcap Stocks Year-to-Date:
Vistra Energy[107.27%], AppLovin [80.75%], ShockWave Medical[73.23%], EMCOR [65.28%], Constellation Energy[58.62%], Tenet [57.44%], Spotify [56.59%], CAVA [56.54%], Natera [49.62%], Wingstop [48.55%], NRG Energy[45.3%] Best Midcap Stocks This Week:
Olaplex [24.63%], Tenet [23.77%], Pinterest [19.3%], Bio-Techne [18.09%], Valmont Industries[16.45%], Garmin [15.26%], C.H. Robinson[15.2%], Brookfield Renewable[14.24%], New York[13.47%], Hertz Global[13.24%], Avis Budget[12.97%] Best Midcap Stocks Daily:
Avis Budget[20.12%], Olaplex [19.29%], Valmont Industries[17.73%], GameStop [17.19%], Wayfair [16.01%], IAC/InterActiveCorp [12.29%], C.H. Robinson[12.21%], Hertz Global[11.97%], Aptiv [11.53%], NovoCure [11.38%], Coinbase Global[10.36%]