
 Login Sign Up


| |||||
 |  | ||||

| 12Stocks.com Market Intelligence |
Best MidCap Stocks
|
| In a hurry? Mid Cap Stocks Lists: Performance Trends Table, Stock Charts
Sort midcap stocks: Daily, Weekly, Year-to-Date, Market Cap & Trends. Filter midcap stocks list by sector: Show all, Tech, Finance, Energy, Staples, Retail, Industrial, Materials, Utilities and HealthCare Filter midcap stocks list by size:All MidCap Large Mid-Range Small |
| 12Stocks.com Mid Cap Stocks Performances & Trends Daily | |||||||||
|
|  The overall Smart Investing & Trading Score is 63 (0-bearish to 100-bullish) which puts Mid Cap index in short term neutral to bullish trend. The Smart Investing & Trading Score from previous trading session is 44 and an improvement of trend continues.
| ||||||||
Here are the Smart Investing & Trading Scores of the most requested mid cap stocks at 12Stocks.com (click stock name for detailed review):
|


| 12Stocks.com: Top Performing Mid Cap Index Stocks | ||||||||||||||||||||||||||||||||||||||||||||||||
 The top performing Mid Cap Index stocks year to date are
Now, more recently, over last week, the top performing Mid Cap Index stocks on the move are


|
||||||||||||||||||||||||||||||||||||||||||||||||
| 12Stocks.com: Investing in Midcap Index with Stocks | |
|
The following table helps investors and traders sort through current performance and trends (as measured by Smart Investing & Trading Score) of various
stocks in the Midcap Index. Quick View: Move mouse or cursor over stock symbol (ticker) to view short-term technical chart and over stock name to view long term chart. Click on  to add stock symbol to your watchlist and to add stock symbol to your watchlist and  to view watchlist. Click on any ticker or stock name for detailed market intelligence report for that stock. to view watchlist. Click on any ticker or stock name for detailed market intelligence report for that stock. |
12Stocks.com Performance of Stocks in Midcap Index
| Ticker | Stock Name | Watchlist | Category | Recent Price | Smart Investing & Trading Score | Change % | YTD Change% |
| NTAP | NetApp |   | Technology | 100.06 | 63 | 0.64 | 13.50% |
| PAG | Penske Automotive | | Services & Goods | 153.18 | 83 | 0.64 | -4.57% |
| WH | Wyndham Hotels | | Services & Goods | 71.96 | 27 | 0.64 | -10.51% |
| ACHC | Acadia | | Health Care | 71.19 | 32 | 0.64 | -8.45% |
| AFL | Aflac | | Financials | 84.28 | 62 | 0.63 | 2.16% |
| PRU | Prudential Financial | | Financials | 112.76 | 70 | 0.63 | 8.73% |
| OZK | Bank OZK | | Financials | 46.37 | 80 | 0.63 | -6.94% |
| GO | Grocery Outlet | | Services & Goods | 27.36 | 63 | 0.63 | 1.48% |
| DGX | Quest Diagnostics | | Health Care | 137.55 | 100 | 0.62 | -0.24% |
| HSIC | Henry Schein | | Services & Goods | 73.21 | 74 | 0.62 | -3.30% |
| TTC | Toro | | Industrials | 87.20 | 67 | 0.62 | -9.16% |
| ALGN | Align | | Health Care | 313.78 | 68 | 0.61 | 14.52% |
| NXST | Nexstar Media | | Services & Goods | 164.11 | 42 | 0.61 | 4.70% |
| UHS | Universal Health | | Health Care | 165.90 | 58 | 0.60 | 8.83% |
| CHD | Church & Dwight Co | | Consumer Staples | 107.35 | 93 | 0.60 | 13.53% |
| LCID | Lucid | | Services & Goods | 2.54 | 59 | 0.60 | -39.28% |
| CMA | Comerica | | Financials | 52.95 | 73 | 0.59 | -5.12% |
| HRB | H&R Block | | Services & Goods | 47.93 | 90 | 0.59 | -0.91% |
| HPE | Hewlett Packard | | Technology | 16.93 | 61 | 0.59 | -0.29% |
| EXPE | Expedia | | Services & Goods | 135.80 | 64 | 0.58 | -10.53% |
| RPRX | Royalty Pharma | | Health Care | 27.98 | 17 | 0.58 | -0.39% |
| AM | Antero Midstream | | Energy | 14.02 | 75 | 0.57 | 11.89% |
| EFX | Equifax | | Financials | 225.71 | 32 | 0.56 | -8.73% |
| TSN | Tyson Foods | | Consumer Staples | 61.32 | 100 | 0.56 | 14.08% |
| BPOP | Popular | | Financials | 88.36 | 100 | 0.55 | 7.66% |
| For chart view version of above stock list: Chart View ➞ 0 - 25 , 25 - 50 , 50 - 75 , 75 - 100 , 100 - 125 , 125 - 150 , 150 - 175 , 175 - 200 , 200 - 225 , 225 - 250 , 250 - 275 , 275 - 300 , 300 - 325 , 325 - 350 , 350 - 375 , 375 - 400 , 400 - 425 , 425 - 450 , 450 - 475 , 475 - 500 , 500 - 525 , 525 - 550 , 550 - 575 , 575 - 600 , 600 - 625 , 625 - 650 , 650 - 675 , 675 - 700 , 700 - 725 , 725 - 750 , 750 - 775 | ||
 | Click To Change The Sort Order: By Market Cap or Company Size Performance: Year-to-date, Week and Day |  |
|
Get the most comprehensive stock market coverage daily at 12Stocks.com ➞ Best Stocks Today ➞ Best Stocks Weekly ➞ Best Stocks Year-to-Date ➞ Best Stocks Trends ➞  Best Stocks Today 12Stocks.com Best Nasdaq Stocks ➞ Best S&P 500 Stocks ➞ Best Tech Stocks ➞ Best Biotech Stocks ➞ |
| Detailed Overview of Midcap Stocks |
| Midcap Technical Overview, Leaders & Laggards, Top Midcap ETF Funds & Detailed Midcap Stocks List, Charts, Trends & More |
| Midcap: Technical Analysis, Trends & YTD Performance | |
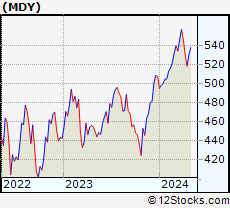
| MidCap segment as represented by
MDY, an exchange-traded fund [ETF], holds basket of about four hundred midcap stocks from across all major sectors of the US stock market. The midcap index (contains stocks like Green Mountain Coffee Roasters and Tractor Supply Company) is up by 4.42% and is currently underperforming the overall market by -1.24% year-to-date. Below is a quick view of technical charts and trends: | |
 MDY Weekly Chart |
|
| Long Term Trend: Very Good | |
| Medium Term Trend: Not Good | |
 MDY Daily Chart |
|
| Short Term Trend: Very Good | |
| Overall Trend Score: 63 | |
| YTD Performance: 4.42% | |
| **Trend Scores & Views Are Only For Educational Purposes And Not For Investing | |
| 12Stocks.com: Investing in Midcap Index using Exchange Traded Funds | |
|
The following table shows list of key exchange traded funds (ETF) that
help investors track Midcap index. The following list also includes leveraged ETF funds that track twice or thrice the daily returns of Midcap indices. Short or inverse ETF funds move in the opposite direction to the index they track and are useful during market pullbacks or during bear markets. Quick View: Move mouse or cursor over ETF symbol (ticker) to view short-term technical chart and over ETF name to view long term chart. Click on ticker or stock name for detailed view. Click on to add stock symbol to your watchlist and to view watchlist. |
12Stocks.com List of ETFs that track Midcap Index
| Ticker | ETF Name | Watchlist | Recent Price | Smart Investing & Trading Score | Change % | Week % | Year-to-date % |
| IJH | iShares Core S&P Mid-Cap | | 57.87 | 68 | 0.03 | 2.28 | 4.4% |
| IWR | iShares Russell Mid-Cap | | 80.41 | 63 | 0.05 | 2.22 | 3.45% |
| IWP | iShares Russell Mid-Cap Growth | | 108.49 | 58 | -0.13 | 2.64 | 3.86% |
| MDY | SPDR S&P MidCap 400 ETF | | 529.80 | 63 | 0.00 | 2.22 | 4.42% |
| IJK | iShares S&P Mid-Cap 400 Growth | | 86.99 | 63 | 0.07 | 2.52 | 9.81% |
| IWS | iShares Russell Mid-Cap Value | | 119.97 | 68 | 0.09 | 1.97 | 3.16% |
| IJJ | iShares S&P Mid-Cap 400 Value | | 112.59 | 51 | 0.11 | 1.85 | -1.27% |
| XMLV | PowerShares S&P MidCap Low Volatil ETF | | 55.04 | 75 | 0.24 | 1.62 | 3.5% |
| MVV | ProShares Ultra MidCap400 | | 61.60 | 41 | 0.10 | 4.41 | 6.41% |
| UMDD | ProShares UltraPro MidCap400 | | 24.09 | 63 | -0.08 | 6.77 | 7.93% |
| SMDD | ProShares UltraPro Short MidCap400 | | 11.84 | 32 | 1.58 | -5.79 | -12.1% |
| MYY | ProShares Short MidCap400 | | 20.74 | 32 | 0.00 | -2.12 | -3.33% |
| MZZ | ProShares UltraShort MidCap400 | | 11.69 | 34 | 0.26 | -3.95 | -7.01% |
| 12Stocks.com: Charts, Trends, Fundamental Data and Performances of MidCap Stocks | |
|
We now take in-depth look at all MidCap stocks including charts, multi-period performances and overall trends (as measured by Smart Investing & Trading Score). One can sort MidCap stocks (click link to choose) by Daily, Weekly and by Year-to-Date performances. Also, one can sort by size of the company or by market capitalization. |
| Select Your Default Chart Type: | |||||
| |||||
| Click on stock symbol or name for detailed view. Click on to add stock symbol to your watchlist and to view watchlist. Quick View: Move mouse or cursor over "Daily" to quickly view daily technical stock chart and over "Weekly" to view weekly technical stock chart. | |||||

 | NTAP NetApp, Inc. |
| Sector: Technology | |
| SubSector: Data Storage Devices | |
| MarketCap: 9028.89 Millions | |
| Recent Price: 100.06 Smart Investing & Trading Score: 63 | |
| Day Percent Change: 0.64% Day Change: 0.64 | |
| Week Change: 2.15% Year-to-date Change: 13.5% | |
| NTAP Links: Profile News Message Board | |
| Charts:- Daily , Weekly | |
| Add NTAP to Watchlist: View: Get Complete NTAP Trend Analysis ➞ | |
 | PAG Penske Automotive Group, Inc. |
| Sector: Services & Goods | |
| SubSector: Auto Dealerships | |
| MarketCap: 2088.81 Millions | |
| Recent Price: 153.18 Smart Investing & Trading Score: 83 | |
| Day Percent Change: 0.64% Day Change: 0.98 | |
| Week Change: 3.54% Year-to-date Change: -4.6% | |
| PAG Links: Profile News Message Board | |
| Charts:- Daily , Weekly | |
| Add PAG to Watchlist: View: Get Complete PAG Trend Analysis ➞ | |
 | WH Wyndham Hotels & Resorts, Inc. |
| Sector: Services & Goods | |
| SubSector: Lodging | |
| MarketCap: 2656.66 Millions | |
| Recent Price: 71.96 Smart Investing & Trading Score: 27 | |
| Day Percent Change: 0.64% Day Change: 0.46 | |
| Week Change: 2.92% Year-to-date Change: -10.5% | |
| WH Links: Profile News Message Board | |
| Charts:- Daily , Weekly | |
| Add WH to Watchlist: View: Get Complete WH Trend Analysis ➞ | |
 | ACHC Acadia Healthcare Company, Inc. |
| Sector: Health Care | |
| SubSector: Specialized Health Services | |
| MarketCap: 1331.56 Millions | |
| Recent Price: 71.19 Smart Investing & Trading Score: 32 | |
| Day Percent Change: 0.64% Day Change: 0.45 | |
| Week Change: 1.47% Year-to-date Change: -8.5% | |
| ACHC Links: Profile News Message Board | |
| Charts:- Daily , Weekly | |
| Add ACHC to Watchlist: View: Get Complete ACHC Trend Analysis ➞ | |
 | AFL Aflac Incorporated |
| Sector: Financials | |
| SubSector: Accident & Health Insurance | |
| MarketCap: 22706 Millions | |
| Recent Price: 84.28 Smart Investing & Trading Score: 62 | |
| Day Percent Change: 0.63% Day Change: 0.53 | |
| Week Change: 1.26% Year-to-date Change: 2.2% | |
| AFL Links: Profile News Message Board | |
| Charts:- Daily , Weekly | |
| Add AFL to Watchlist: View: Get Complete AFL Trend Analysis ➞ | |
 | PRU Prudential Financial, Inc. |
| Sector: Financials | |
| SubSector: Life Insurance | |
| MarketCap: 21001.6 Millions | |
| Recent Price: 112.76 Smart Investing & Trading Score: 70 | |
| Day Percent Change: 0.63% Day Change: 0.71 | |
| Week Change: 1.94% Year-to-date Change: 8.7% | |
| PRU Links: Profile News Message Board | |
| Charts:- Daily , Weekly | |
| Add PRU to Watchlist: View: Get Complete PRU Trend Analysis ➞ | |
 | OZK Bank OZK |
| Sector: Financials | |
| SubSector: Regional - Southeast Banks | |
| MarketCap: 2518.35 Millions | |
| Recent Price: 46.37 Smart Investing & Trading Score: 80 | |
| Day Percent Change: 0.63% Day Change: 0.29 | |
| Week Change: 3.2% Year-to-date Change: -6.9% | |
| OZK Links: Profile News Message Board | |
| Charts:- Daily , Weekly | |
| Add OZK to Watchlist: View: Get Complete OZK Trend Analysis ➞ | |
 | GO Grocery Outlet Holding Corp. |
| Sector: Services & Goods | |
| SubSector: Grocery Stores | |
| MarketCap: 3065.95 Millions | |
| Recent Price: 27.36 Smart Investing & Trading Score: 63 | |
| Day Percent Change: 0.63% Day Change: 0.17 | |
| Week Change: 1.52% Year-to-date Change: 1.5% | |
| GO Links: Profile News Message Board | |
| Charts:- Daily , Weekly | |
| Add GO to Watchlist: View: Get Complete GO Trend Analysis ➞ | |
 | DGX Quest Diagnostics Incorporated |
| Sector: Health Care | |
| SubSector: Medical Laboratories & Research | |
| MarketCap: 11076.1 Millions | |
| Recent Price: 137.55 Smart Investing & Trading Score: 100 | |
| Day Percent Change: 0.62% Day Change: 0.85 | |
| Week Change: 7.09% Year-to-date Change: -0.2% | |
| DGX Links: Profile News Message Board | |
| Charts:- Daily , Weekly | |
| Add DGX to Watchlist: View: Get Complete DGX Trend Analysis ➞ | |
 | HSIC Henry Schein, Inc. |
| Sector: Services & Goods | |
| SubSector: Medical Equipment Wholesale | |
| MarketCap: 6760.9 Millions | |
| Recent Price: 73.21 Smart Investing & Trading Score: 74 | |
| Day Percent Change: 0.62% Day Change: 0.45 | |
| Week Change: 3.32% Year-to-date Change: -3.3% | |
| HSIC Links: Profile News Message Board | |
| Charts:- Daily , Weekly | |
| Add HSIC to Watchlist: View: Get Complete HSIC Trend Analysis ➞ | |
 | TTC The Toro Company |
| Sector: Industrials | |
| SubSector: Small Tools & Accessories | |
| MarketCap: 6426.96 Millions | |
| Recent Price: 87.20 Smart Investing & Trading Score: 67 | |
| Day Percent Change: 0.62% Day Change: 0.54 | |
| Week Change: 2.46% Year-to-date Change: -9.2% | |
| TTC Links: Profile News Message Board | |
| Charts:- Daily , Weekly | |
| Add TTC to Watchlist: View: Get Complete TTC Trend Analysis ➞ | |
 | ALGN Align Technology, Inc. |
| Sector: Health Care | |
| SubSector: Medical Appliances & Equipment | |
| MarketCap: 12802 Millions | |
| Recent Price: 313.78 Smart Investing & Trading Score: 68 | |
| Day Percent Change: 0.61% Day Change: 1.90 | |
| Week Change: 4.95% Year-to-date Change: 14.5% | |
| ALGN Links: Profile News Message Board | |
| Charts:- Daily , Weekly | |
| Add ALGN to Watchlist: View: Get Complete ALGN Trend Analysis ➞ | |
 | NXST Nexstar Media Group, Inc. |
| Sector: Services & Goods | |
| SubSector: Broadcasting - TV | |
| MarketCap: 2763.73 Millions | |
| Recent Price: 164.11 Smart Investing & Trading Score: 42 | |
| Day Percent Change: 0.61% Day Change: 1.00 | |
| Week Change: -0.69% Year-to-date Change: 4.7% | |
| NXST Links: Profile News Message Board | |
| Charts:- Daily , Weekly | |
| Add NXST to Watchlist: View: Get Complete NXST Trend Analysis ➞ | |
 | UHS Universal Health Services, Inc. |
| Sector: Health Care | |
| SubSector: Hospitals | |
| MarketCap: 7217.66 Millions | |
| Recent Price: 165.90 Smart Investing & Trading Score: 58 | |
| Day Percent Change: 0.60% Day Change: 0.99 | |
| Week Change: 5.35% Year-to-date Change: 8.8% | |
| UHS Links: Profile News Message Board | |
| Charts:- Daily , Weekly | |
| Add UHS to Watchlist: View: Get Complete UHS Trend Analysis ➞ | |
 | CHD Church & Dwight Co., Inc. |
| Sector: Consumer Staples | |
| SubSector: Cleaning Products | |
| MarketCap: 17425.7 Millions | |
| Recent Price: 107.35 Smart Investing & Trading Score: 93 | |
| Day Percent Change: 0.60% Day Change: 0.64 | |
| Week Change: 2.87% Year-to-date Change: 13.5% | |
| CHD Links: Profile News Message Board | |
| Charts:- Daily , Weekly | |
| Add CHD to Watchlist: View: Get Complete CHD Trend Analysis ➞ | |
 | LCID Lucid Group, Inc. |
| Sector: Services & Goods | |
| SubSector: Auto Manufacturers | |
| MarketCap: 12910 Millions | |
| Recent Price: 2.54 Smart Investing & Trading Score: 59 | |
| Day Percent Change: 0.60% Day Change: 0.02 | |
| Week Change: 3.47% Year-to-date Change: -39.3% | |
| LCID Links: Profile News Message Board | |
| Charts:- Daily , Weekly | |
| Add LCID to Watchlist: View: Get Complete LCID Trend Analysis ➞ | |
 | CMA Comerica Incorporated |
| Sector: Financials | |
| SubSector: Money Center Banks | |
| MarketCap: 4449.49 Millions | |
| Recent Price: 52.95 Smart Investing & Trading Score: 73 | |
| Day Percent Change: 0.59% Day Change: 0.31 | |
| Week Change: 2.7% Year-to-date Change: -5.1% | |
| CMA Links: Profile News Message Board | |
| Charts:- Daily , Weekly | |
| Add CMA to Watchlist: View: Get Complete CMA Trend Analysis ➞ | |
 | HRB H&R Block, Inc. |
| Sector: Services & Goods | |
| SubSector: Personal Services | |
| MarketCap: 3052.45 Millions | |
| Recent Price: 47.93 Smart Investing & Trading Score: 90 | |
| Day Percent Change: 0.59% Day Change: 0.28 | |
| Week Change: 2.33% Year-to-date Change: -0.9% | |
| HRB Links: Profile News Message Board | |
| Charts:- Daily , Weekly | |
| Add HRB to Watchlist: View: Get Complete HRB Trend Analysis ➞ | |
 | HPE Hewlett Packard Enterprise Company |
| Sector: Technology | |
| SubSector: Communication Equipment | |
| MarketCap: 12886.1 Millions | |
| Recent Price: 16.93 Smart Investing & Trading Score: 61 | |
| Day Percent Change: 0.59% Day Change: 0.10 | |
| Week Change: 0.83% Year-to-date Change: -0.3% | |
| HPE Links: Profile News Message Board | |
| Charts:- Daily , Weekly | |
| Add HPE to Watchlist: View: Get Complete HPE Trend Analysis ➞ | |
 | EXPE Expedia Group, Inc. |
| Sector: Services & Goods | |
| SubSector: Lodging | |
| MarketCap: 8052.96 Millions | |
| Recent Price: 135.80 Smart Investing & Trading Score: 64 | |
| Day Percent Change: 0.58% Day Change: 0.78 | |
| Week Change: 5.27% Year-to-date Change: -10.5% | |
| EXPE Links: Profile News Message Board | |
| Charts:- Daily , Weekly | |
| Add EXPE to Watchlist: View: Get Complete EXPE Trend Analysis ➞ | |
 | RPRX Royalty Pharma plc |
| Sector: Health Care | |
| SubSector: Biotechnology | |
| MarketCap: 28457 Millions | |
| Recent Price: 27.98 Smart Investing & Trading Score: 17 | |
| Day Percent Change: 0.58% Day Change: 0.16 | |
| Week Change: -0.64% Year-to-date Change: -0.4% | |
| RPRX Links: Profile News Message Board | |
| Charts:- Daily , Weekly | |
| Add RPRX to Watchlist: View: Get Complete RPRX Trend Analysis ➞ | |
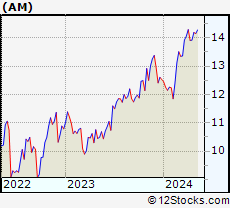 | AM Antero Midstream Corporation |
| Sector: Energy | |
| SubSector: Oil & Gas Pipelines | |
| MarketCap: 1195.35 Millions | |
| Recent Price: 14.02 Smart Investing & Trading Score: 75 | |
| Day Percent Change: 0.57% Day Change: 0.08 | |
| Week Change: 0.72% Year-to-date Change: 11.9% | |
| AM Links: Profile News Message Board | |
| Charts:- Daily , Weekly | |
| Add AM to Watchlist: View: Get Complete AM Trend Analysis ➞ | |
 | EFX Equifax Inc. |
| Sector: Financials | |
| SubSector: Credit Services | |
| MarketCap: 13754.6 Millions | |
| Recent Price: 225.71 Smart Investing & Trading Score: 32 | |
| Day Percent Change: 0.56% Day Change: 1.25 | |
| Week Change: 4.4% Year-to-date Change: -8.7% | |
| EFX Links: Profile News Message Board | |
| Charts:- Daily , Weekly | |
| Add EFX to Watchlist: View: Get Complete EFX Trend Analysis ➞ | |
 | TSN Tyson Foods, Inc. |
| Sector: Consumer Staples | |
| SubSector: Meat Products | |
| MarketCap: 22124.1 Millions | |
| Recent Price: 61.32 Smart Investing & Trading Score: 100 | |
| Day Percent Change: 0.56% Day Change: 0.34 | |
| Week Change: 2.29% Year-to-date Change: 14.1% | |
| TSN Links: Profile News Message Board | |
| Charts:- Daily , Weekly | |
| Add TSN to Watchlist: View: Get Complete TSN Trend Analysis ➞ | |
 | BPOP Popular, Inc. |
| Sector: Financials | |
| SubSector: Foreign Regional Banks | |
| MarketCap: 2671.99 Millions | |
| Recent Price: 88.36 Smart Investing & Trading Score: 100 | |
| Day Percent Change: 0.55% Day Change: 0.48 | |
| Week Change: 6.2% Year-to-date Change: 7.7% | |
| BPOP Links: Profile News Message Board | |
| Charts:- Daily , Weekly | |
| Add BPOP to Watchlist: View: Get Complete BPOP Trend Analysis ➞ | |
| For tabular summary view of above stock list: Summary View ➞ 0 - 25 , 25 - 50 , 50 - 75 , 75 - 100 , 100 - 125 , 125 - 150 , 150 - 175 , 175 - 200 , 200 - 225 , 225 - 250 , 250 - 275 , 275 - 300 , 300 - 325 , 325 - 350 , 350 - 375 , 375 - 400 , 400 - 425 , 425 - 450 , 450 - 475 , 475 - 500 , 500 - 525 , 525 - 550 , 550 - 575 , 575 - 600 , 600 - 625 , 625 - 650 , 650 - 675 , 675 - 700 , 700 - 725 , 725 - 750 , 750 - 775 | ||
| Click To Change The Sort Order: By Market Cap or Company Size Performance: Year-to-date, Week and Day | |
| Select Chart Type: | ||
|
Best Stocks Today 12Stocks.com |
© 2024 12Stocks.com Terms & Conditions Privacy Contact Us
All Information Provided Only For Education And Not To Be Used For Investing or Trading. See Terms & Conditions


One More Thing ... Get Best Stocks Delivered Daily!
Never Ever Miss A Move With Our Top Ten Stocks Lists
Find Best Stocks In Any Market - Bull or Bear Market
Take A Peek At Our Top Ten Stocks Lists: Daily, Weekly, Year-to-Date & Top Trends
Find Best Stocks In Any Market - Bull or Bear Market
Take A Peek At Our Top Ten Stocks Lists: Daily, Weekly, Year-to-Date & Top Trends
Midcap Stocks With Best Up Trends [0-bearish to 100-bullish]: Hasbro [100], Wabtec [100], Allegro Micro[100], Microchip [100], Synchrony Financial[100], EQT [100], Prosperity Bancshares[100], Range Resources[100], Virtu Financial[100], Crane Co[100], National Fuel[100]
Best Midcap Stocks Year-to-Date:
Vistra Energy[82.92%], AppLovin [74.52%], ShockWave Medical[72.58%], Constellation Energy[59.4%], EMCOR [57.31%], Spotify [49.66%], Natera [46.07%], Pure Storage[42.04%], Williams-Sonoma [41.5%], Wingstop [41.38%], NRG Energy[40.44%] Best Midcap Stocks This Week:
HashiCorp [23.7%], Globe Life[17.77%], Hasbro [17.66%], Tandem Diabetes[15.41%], Wabtec [13.32%], MongoDB [12.82%], Ryder System[12.4%], Microchip [11.02%], Watsco [11%], Crane Co[9.77%], Coinbase Global[9.74%] Best Midcap Stocks Daily:
Hasbro [11.85%], Wabtec [10.04%], CoStar [8.66%], Allegro Micro[8.24%], GameStop [7.58%], Watsco [6.54%], ON Semiconductor[6.24%], Hertz Global[6.23%], Sarepta [6.09%], Lattice Semiconductor[5.31%], Microchip [5.21%]