
 Login Sign Up


| |||||
 |  | ||||

| 12Stocks.com Market Intelligence |
Best Biotech Stocks
|
|
| Quick Read: Best Biotech Stocks List By Performances & Trends: Daily, Weekly, Year-to-Date, Market Cap (Size) & Technical Trends | |||
| Best Biotech Stocks Views: Quick Browse View, Summary & Slide Show View | |||
| 12Stocks.com Biotech Stocks Performances & Trends Daily | |||||||||
|
|  The overall market intelligence score is 25 (0-bearish to 100-bullish) which puts Biotech sector in short term bearish to neutral trend. The market intelligence score from previous trading session is 32 and a deterioration of trend continues.
| ||||||||
Here are the market intelligence trend scores of the most requested Biotech stocks at 12Stocks.com (click stock name for detailed review):
|


| 12Stocks.com: Investing in Biotech sector with Stocks | |
|
The following table helps investors and traders sort through current performance and trends (as measured by market intelligence score) of various
stocks in the Biotech sector. Quick View: Move mouse or cursor over stock symbol (ticker) to view short-term Technical chart and over stock name to view long term chart. Click on  to add stock symbol to your watchlist and to add stock symbol to your watchlist and  to view watchlist. Click on any ticker or stock name for detailed market intelligence report for that stock. to view watchlist. Click on any ticker or stock name for detailed market intelligence report for that stock. |
12Stocks.com Performance of Stocks in Biotech Sector
| Ticker | Stock Name | Watchlist | Category | Recent Price | Market Intelligence Score | Change % | YTD Change% |
| NBIX | Neurocrine |   | Biotechnology | 137.76 | 63 | -0.87% | 4.55% |
| LBPH | Longboard | | Biotechnology | 19.43 | 62 | -1.67% | 218.00% |
| CARA | Cara | | Biotechnology | 0.70 | 61 | 4.23% | -5.79% |
| AFMD | Affimed N.V | | Biotechnology | 4.88 | 61 | 0.00% | 680.80% |
| ERAS | Erasca | | Biotechnology | 1.88 | 61 | 0.00% | -11.74% |
| IBIO | iBio | | Biotechnology | 1.72 | 61 | -9.47% | 25.55% |
| THRD | Third Harmonic | | Biotechnology | 10.42 | 61 | -8.27% | -5.40% |
| PEPG | PepGen | | Biotechnology | 11.03 | 61 | -5.73% | 61.26% |
| NVAX | Novavax | | Biotechnology | 3.95 | 61 | -4.82% | -17.71% |
| RANI | Rani | | Biotechnology | 6.58 | 61 | -4.22% | 99.39% |
| MLYS | Mineralys | | Biotechnology | 11.04 | 61 | -3.71% | 26.61% |
| GBIO | Generation Bio | | Biotechnology | 2.92 | 61 | -2.34% | 77.27% |
| ITOS | iTeos | | Biotechnology | 10.45 | 61 | -1.23% | -4.48% |
| NUVB | Nuvation Bio | | Biotechnology | 2.62 | 61 | -1.13% | 72.94% |
| ABUS | Arbutus Biopharma | | Biotechnology | 2.72 | 61 | -1.09% | 8.80% |
| CMPX | Compass | | Biotechnology | 1.48 | 61 | -0.67% | -3.58% |
| GERN | Geron | | Biotechnology | 3.56 | 61 | -0.56% | 68.72% |
| INO | Inovio | | Biotechnology | 10.13 | 61 | -0.34% | NA |
| SIGA | SIGA Technologies | | Biotechnology | 8.64 | 61 | -0.23% | 54.29% |
| MCRB | Seres | | Biotechnology | 0.74 | 59 | 1.81% | -46.95% |
| PMVP | PMV | | Biotechnology | 1.70 | 59 | 0.59% | -45.16% |
| JANX | Janux | | Biotechnology | 47.10 | 59 | -3.04% | 338.34% |
| TARA | ArTara | | Biotechnology | 2.89 | 58 | 2.48% | 54.13% |
| LYRA | Lyra | | Biotechnology | 5.26 | 58 | 0.67% | 0.86% |
| TYRA | Tyra | | Biotechnology | 15.11 | 58 | -5.53% | 13.35% |
| To view more stocks, click on Next / Previous arrows or select different range: 0 - 25 , 25 - 50 , 50 - 75 , 75 - 100 , 100 - 125 , 125 - 150 , 150 - 175 , 175 - 200 , 200 - 225 , 225 - 250 , 250 - 275 , 275 - 300 , 300 - 325 , 325 - 350 , 350 - 375 , 375 - 400 | ||
 | Click To Change The Sort Order: By Market Cap or Company Size Performance: Year-to-date, Week and Day |  |
|
Get the most comprehensive stock market coverage daily at 12Stocks.com ➞ Best Stocks Today ➞ Best Stocks Weekly ➞ Best Stocks Year-to-Date ➞ Best Stocks Trends ➞  Best Stocks Today 12Stocks.com Best Nasdaq Stocks ➞ Best S&P 500 Stocks ➞ Best Tech Stocks ➞ Best Biotech Stocks ➞ |
| Detailed Overview of Biotech Stocks |
| Biotech Technical Overview, Leaders & Laggards, Top Biotech ETF Funds & Detailed Biotech Stocks List, Charts, Trends & More |
| Biotech Sector: Technical Analysis, Trends & YTD Performance | |
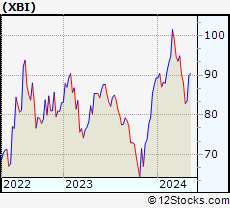
| Biotech sector, as represented by XBI, an exchange-traded fund [ETF] that holds basket of Biotech stocks (e.g, Amgen, Celgene) is down by -7.92% and is currently underperforming the overall market by -13.08% year-to-date. Below is a quick view of Technical charts and trends: | |
 XBI Weekly Chart |
|
| Long Term Trend: Not Good | |
| Medium Term Trend: Not Good | |
 XBI Daily Chart |
|
| Short Term Trend: Very Good | |
| Overall Trend Score: 25 | |
| YTD Performance: -7.92% | |
| **Trend Scores & Views Are Only For Educational Purposes And Not For Investing | |
| 12Stocks.com: Top Performing Biotech Sector Stocks | ||||||||||||||||||||||||||||||||||||||||||||||||
 The top performing Biotech sector stocks year to date are
Now, more recently, over last week, the top performing Biotech sector stocks on the move are


|
||||||||||||||||||||||||||||||||||||||||||||||||
| 12Stocks.com: Investing in Biotech Sector using Exchange Traded Funds | |
|
The following table shows list of key exchange traded funds (ETF) that
help investors track Biotech Index. For detailed view, check out our ETF Funds section of our website. Quick View: Move mouse or cursor over ETF symbol (ticker) to view short-term Technical chart and over ETF name to view long term chart. Click on ticker or stock name for detailed view. Click on to add stock symbol to your watchlist and to view watchlist. |
12Stocks.com List of ETFs that track Biotech Index
| Ticker | ETF Name | Watchlist | Recent Price | Market Intelligence Score | Change % | Week % | Year-to-date % |
| LABD | Biotech Bear 3X | | 11.03 | 75 | 6.36 | 2.13 | 13.83% |
| XBI | Biotech | | 82.22 | 25 | -2.05 | -0.74 | -7.92% |
| LABU | Biotech Bull 3X | | 83.72 | 25 | -6.35 | -2.71 | -31.36% |
| IBB | Biotechnology | | 125.67 | 18 | -1.64 | 0.76 | -7.49% |
| IYH | Healthcare | | 58.68 | 45 | -0.69 | 0.89 | 2.5% |
| IHF | Healthcare Providers | | 52.11 | 55 | -0.29 | -0.19 | -0.76% |
| IXJ | Global Healthcare | | 88.91 | 25 | -0.45 | 1.32 | 2.53% |
| BBH | Biotech | | 154.61 | 49 | -1.73 | 1.48 | -6.47% |
| FBT | First NYSE | | 142.59 | 25 | -1.93 | 0.64 | -9.78% |
| CURE | Healthcare Bull 3X | | 105.32 | 25 | -2.35 | 1.92 | 3.52% |
| BIB | Biotechnology | | 48.83 | 32 | -2.69 | 1.31 | -14.41% |
| BIS | Short Biotech | | 20.59 | 61 | 2.49 | -1.46 | 13.95% |
| PTH | DWA Healthcare Momentum | | 39.60 | 46 | -0.08 | 0.18 | 1.18% |
| PBE | Biotech & Genome | | 59.85 | 32 | -1.69 | 0 | -9.1% |
| BBC | Bio Biotechnology Clinical | | 24.70 | 36 | -3.62 | -0.04 | 1.01% |
| BTEC | Principal Healthcare Innovators | | 34.21 | 32 | 0.02 | 1.04 | -5.83% |
| BBP | Bio Biotechnology Products | | 51.14 | 35 | -2.40 | 1.41 | -11.96% |
| 12Stocks.com: Charts, Trends, Fundamental Data and Performances of Biotech Stocks | |
|
We now take in-depth look at all Biotech stocks including charts, multi-period performances and overall trends (as measured by market intelligence score). One can sort Biotech stocks (click link to choose) by Daily, Weekly and by Year-to-Date performances. Also, one can sort by size of the company or by market capitalization. |
| Select Your Default Chart Type: | |||||
| |||||
| Click on stock symbol or name for detailed view. Click on to add stock symbol to your watchlist and to view watchlist. Quick View: Move mouse or cursor over "Daily" to quickly view daily Technical stock chart and over "Weekly" to view weekly Technical stock chart. | |||||

 | NBIX Neurocrine Biosciences, Inc. |
| Sector: Health Care | |
| SubSector: Biotechnology | |
| MarketCap: 7897.85 Millions | |
| Recent Price: 137.76 Market Intelligence Score: 63 | |
| Day Percent Change: -0.87% Day Change: -1.21 | |
| Week Change: 4.36% Year-to-date Change: 4.6% | |
| NBIX Links: Profile News Message Board | |
| Charts:- Daily , Weekly | |
| Add NBIX to Watchlist: View: Get Complete NBIX Trend Analysis ➞ | |
 | LBPH Longboard Pharmaceuticals, Inc. |
| Sector: Health Care | |
| SubSector: Biotechnology | |
| MarketCap: 169 Millions | |
| Recent Price: 19.43 Market Intelligence Score: 62 | |
| Day Percent Change: -1.67% Day Change: -0.33 | |
| Week Change: 11.41% Year-to-date Change: 218.0% | |
| LBPH Links: Profile News Message Board | |
| Charts:- Daily , Weekly | |
| Add LBPH to Watchlist: View: Get Complete LBPH Trend Analysis ➞ | |
 | CARA Cara Therapeutics, Inc. |
| Sector: Health Care | |
| SubSector: Biotechnology | |
| MarketCap: 597.985 Millions | |
| Recent Price: 0.70 Market Intelligence Score: 61 | |
| Day Percent Change: 4.23% Day Change: 0.03 | |
| Week Change: 5.9% Year-to-date Change: -5.8% | |
| CARA Links: Profile News Message Board | |
| Charts:- Daily , Weekly | |
| Add CARA to Watchlist: View: Get Complete CARA Trend Analysis ➞ | |
 | AFMD Affimed N.V. |
| Sector: Health Care | |
| SubSector: Biotechnology | |
| MarketCap: 161.385 Millions | |
| Recent Price: 4.88 Market Intelligence Score: 61 | |
| Day Percent Change: 0.00% Day Change: 0.00 | |
| Week Change: -5.24% Year-to-date Change: 680.8% | |
| AFMD Links: Profile News Message Board | |
| Charts:- Daily , Weekly | |
| Add AFMD to Watchlist: View: Get Complete AFMD Trend Analysis ➞ | |
 | ERAS Erasca, Inc. |
| Sector: Health Care | |
| SubSector: Biotechnology | |
| MarketCap: 419 Millions | |
| Recent Price: 1.88 Market Intelligence Score: 61 | |
| Day Percent Change: 0.00% Day Change: 0.00 | |
| Week Change: 5.03% Year-to-date Change: -11.7% | |
| ERAS Links: Profile News Message Board | |
| Charts:- Daily , Weekly | |
| Add ERAS to Watchlist: View: Get Complete ERAS Trend Analysis ➞ | |
 | IBIO iBio, Inc. |
| Sector: Health Care | |
| SubSector: Biotechnology | |
| MarketCap: 110.885 Millions | |
| Recent Price: 1.72 Market Intelligence Score: 61 | |
| Day Percent Change: -9.47% Day Change: -0.18 | |
| Week Change: 0% Year-to-date Change: 25.6% | |
| IBIO Links: Profile News Message Board | |
| Charts:- Daily , Weekly | |
| Add IBIO to Watchlist: View: Get Complete IBIO Trend Analysis ➞ | |
 | THRD Third Harmonic Bio, Inc. |
| Sector: Health Care | |
| SubSector: Biotechnology | |
| MarketCap: 190 Millions | |
| Recent Price: 10.42 Market Intelligence Score: 61 | |
| Day Percent Change: -8.27% Day Change: -0.94 | |
| Week Change: -10.79% Year-to-date Change: -5.4% | |
| THRD Links: Profile News Message Board | |
| Charts:- Daily , Weekly | |
| Add THRD to Watchlist: View: Get Complete THRD Trend Analysis ➞ | |
 | PEPG PepGen Inc. |
| Sector: Health Care | |
| SubSector: Biotechnology | |
| MarketCap: 216 Millions | |
| Recent Price: 11.03 Market Intelligence Score: 61 | |
| Day Percent Change: -5.73% Day Change: -0.67 | |
| Week Change: 4.7% Year-to-date Change: 61.3% | |
| PEPG Links: Profile News Message Board | |
| Charts:- Daily , Weekly | |
| Add PEPG to Watchlist: View: Get Complete PEPG Trend Analysis ➞ | |
 | NVAX Novavax, Inc. |
| Sector: Health Care | |
| SubSector: Biotechnology | |
| MarketCap: 376.185 Millions | |
| Recent Price: 3.95 Market Intelligence Score: 61 | |
| Day Percent Change: -4.82% Day Change: -0.20 | |
| Week Change: -0.5% Year-to-date Change: -17.7% | |
| NVAX Links: Profile News Message Board | |
| Charts:- Daily , Weekly | |
| Add NVAX to Watchlist: View: Get Complete NVAX Trend Analysis ➞ | |
 | RANI Rani Therapeutics Holdings, Inc. |
| Sector: Health Care | |
| SubSector: Biotechnology | |
| MarketCap: 202 Millions | |
| Recent Price: 6.58 Market Intelligence Score: 61 | |
| Day Percent Change: -4.22% Day Change: -0.29 | |
| Week Change: -6.93% Year-to-date Change: 99.4% | |
| RANI Links: Profile News Message Board | |
| Charts:- Daily , Weekly | |
| Add RANI to Watchlist: View: Get Complete RANI Trend Analysis ➞ | |
 | MLYS Mineralys Therapeutics, Inc. |
| Sector: Health Care | |
| SubSector: Biotechnology | |
| MarketCap: 719 Millions | |
| Recent Price: 11.04 Market Intelligence Score: 61 | |
| Day Percent Change: -3.71% Day Change: -0.43 | |
| Week Change: -2.21% Year-to-date Change: 26.6% | |
| MLYS Links: Profile News Message Board | |
| Charts:- Daily , Weekly | |
| Add MLYS to Watchlist: View: Get Complete MLYS Trend Analysis ➞ | |
 | GBIO Generation Bio Co. |
| Sector: Health Care | |
| SubSector: Biotechnology | |
| MarketCap: 17487 Millions | |
| Recent Price: 2.92 Market Intelligence Score: 61 | |
| Day Percent Change: -2.34% Day Change: -0.07 | |
| Week Change: 5.6% Year-to-date Change: 77.3% | |
| GBIO Links: Profile News Message Board | |
| Charts:- Daily , Weekly | |
| Add GBIO to Watchlist: View: Get Complete GBIO Trend Analysis ➞ | |
 | ITOS iTeos Therapeutics, Inc. |
| Sector: Health Care | |
| SubSector: Biotechnology | |
| MarketCap: 10487 Millions | |
| Recent Price: 10.45 Market Intelligence Score: 61 | |
| Day Percent Change: -1.23% Day Change: -0.13 | |
| Week Change: 2% Year-to-date Change: -4.5% | |
| ITOS Links: Profile News Message Board | |
| Charts:- Daily , Weekly | |
| Add ITOS to Watchlist: View: Get Complete ITOS Trend Analysis ➞ | |
 | NUVB Nuvation Bio Inc. |
| Sector: Health Care | |
| SubSector: Biotechnology | |
| MarketCap: 381 Millions | |
| Recent Price: 2.62 Market Intelligence Score: 61 | |
| Day Percent Change: -1.13% Day Change: -0.03 | |
| Week Change: 0.77% Year-to-date Change: 72.9% | |
| NUVB Links: Profile News Message Board | |
| Charts:- Daily , Weekly | |
| Add NUVB to Watchlist: View: Get Complete NUVB Trend Analysis ➞ | |
 | ABUS Arbutus Biopharma Corporation |
| Sector: Health Care | |
| SubSector: Biotechnology | |
| MarketCap: 110.885 Millions | |
| Recent Price: 2.72 Market Intelligence Score: 61 | |
| Day Percent Change: -1.09% Day Change: -0.03 | |
| Week Change: 0% Year-to-date Change: 8.8% | |
| ABUS Links: Profile News Message Board | |
| Charts:- Daily , Weekly | |
| Add ABUS to Watchlist: View: Get Complete ABUS Trend Analysis ➞ | |
 | CMPX Compass Therapeutics, Inc. |
| Sector: Health Care | |
| SubSector: Biotechnology | |
| MarketCap: 406 Millions | |
| Recent Price: 1.48 Market Intelligence Score: 61 | |
| Day Percent Change: -0.67% Day Change: -0.01 | |
| Week Change: 0.68% Year-to-date Change: -3.6% | |
| CMPX Links: Profile News Message Board | |
| Charts:- Daily , Weekly | |
| Add CMPX to Watchlist: View: Get Complete CMPX Trend Analysis ➞ | |
 | GERN Geron Corporation |
| Sector: Health Care | |
| SubSector: Biotechnology | |
| MarketCap: 228.685 Millions | |
| Recent Price: 3.56 Market Intelligence Score: 61 | |
| Day Percent Change: -0.56% Day Change: -0.02 | |
| Week Change: -3.52% Year-to-date Change: 68.7% | |
| GERN Links: Profile News Message Board | |
| Charts:- Daily , Weekly | |
| Add GERN to Watchlist: View: Get Complete GERN Trend Analysis ➞ | |
 | INO Inovio Pharmaceuticals, Inc. |
| Sector: Health Care | |
| SubSector: Biotechnology | |
| MarketCap: 876.385 Millions | |
| Recent Price: 10.13 Market Intelligence Score: 61 | |
| Day Percent Change: -0.34% Day Change: -0.04 | |
| Week Change: 4.6% Year-to-date Change: 1,885.3% | |
| INO Links: Profile News Message Board | |
| Charts:- Daily , Weekly | |
| Add INO to Watchlist: View: Get Complete INO Trend Analysis ➞ | |
 | SIGA SIGA Technologies, Inc. |
| Sector: Health Care | |
| SubSector: Biotechnology | |
| MarketCap: 424.285 Millions | |
| Recent Price: 8.64 Market Intelligence Score: 61 | |
| Day Percent Change: -0.23% Day Change: -0.02 | |
| Week Change: 3.6% Year-to-date Change: 54.3% | |
| SIGA Links: Profile News Message Board | |
| Charts:- Daily , Weekly | |
| Add SIGA to Watchlist: View: Get Complete SIGA Trend Analysis ➞ | |
 | MCRB Seres Therapeutics, Inc. |
| Sector: Health Care | |
| SubSector: Biotechnology | |
| MarketCap: 217.585 Millions | |
| Recent Price: 0.74 Market Intelligence Score: 59 | |
| Day Percent Change: 1.81% Day Change: 0.01 | |
| Week Change: 32.65% Year-to-date Change: -47.0% | |
| MCRB Links: Profile News Message Board | |
| Charts:- Daily , Weekly | |
| Add MCRB to Watchlist: View: Get Complete MCRB Trend Analysis ➞ | |
 | PMVP PMV Pharmaceuticals, Inc. |
| Sector: Health Care | |
| SubSector: Biotechnology | |
| MarketCap: 20187 Millions | |
| Recent Price: 1.70 Market Intelligence Score: 59 | |
| Day Percent Change: 0.59% Day Change: 0.01 | |
| Week Change: 4.94% Year-to-date Change: -45.2% | |
| PMVP Links: Profile News Message Board | |
| Charts:- Daily , Weekly | |
| Add PMVP to Watchlist: View: Get Complete PMVP Trend Analysis ➞ | |
 | JANX Janux Therapeutics, Inc. |
| Sector: Health Care | |
| SubSector: Biotechnology | |
| MarketCap: 496 Millions | |
| Recent Price: 47.10 Market Intelligence Score: 59 | |
| Day Percent Change: -3.04% Day Change: -1.48 | |
| Week Change: -3.27% Year-to-date Change: 338.3% | |
| JANX Links: Profile News Message Board | |
| Charts:- Daily , Weekly | |
| Add JANX to Watchlist: View: Get Complete JANX Trend Analysis ➞ | |
 | TARA ArTara Therapeutics, Inc. |
| Sector: Health Care | |
| SubSector: Biotechnology | |
| MarketCap: 140.685 Millions | |
| Recent Price: 2.89 Market Intelligence Score: 58 | |
| Day Percent Change: 2.48% Day Change: 0.07 | |
| Week Change: 10.31% Year-to-date Change: 54.1% | |
| TARA Links: Profile News Message Board | |
| Charts:- Daily , Weekly | |
| Add TARA to Watchlist: View: Get Complete TARA Trend Analysis ➞ | |
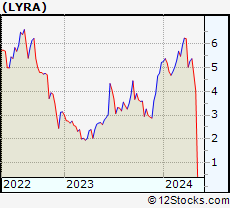 | LYRA Lyra Therapeutics, Inc. |
| Sector: Health Care | |
| SubSector: Biotechnology | |
| MarketCap: 12487 Millions | |
| Recent Price: 5.26 Market Intelligence Score: 58 | |
| Day Percent Change: 0.67% Day Change: 0.03 | |
| Week Change: -2.05% Year-to-date Change: 0.9% | |
| LYRA Links: Profile News Message Board | |
| Charts:- Daily , Weekly | |
| Add LYRA to Watchlist: View: Get Complete LYRA Trend Analysis ➞ | |
 | TYRA Tyra Biosciences, Inc. |
| Sector: Health Care | |
| SubSector: Biotechnology | |
| MarketCap: 732 Millions | |
| Recent Price: 15.11 Market Intelligence Score: 58 | |
| Day Percent Change: -5.53% Day Change: -0.88 | |
| Week Change: 0.87% Year-to-date Change: 13.4% | |
| TYRA Links: Profile News Message Board | |
| Charts:- Daily , Weekly | |
| Add TYRA to Watchlist: View: Get Complete TYRA Trend Analysis ➞ | |
| To view more stocks, click on Next / Previous arrows or select different range: 0 - 25 , 25 - 50 , 50 - 75 , 75 - 100 , 100 - 125 , 125 - 150 , 150 - 175 , 175 - 200 , 200 - 225 , 225 - 250 , 250 - 275 , 275 - 300 , 300 - 325 , 325 - 350 , 350 - 375 , 375 - 400 | ||
| Click To Change The Sort Order: By Market Cap or Company Size Performance: Year-to-date, Week and Day | |
| Select Chart Type: | ||
|
Best Stocks Today 12Stocks.com |
© 2024 12Stocks.com Terms & Conditions Privacy Contact Us
All Information Provided Only For Education And Not To Be Used For Investing or Trading. See Terms & Conditions


One More Thing ... Get Best Stocks Delivered Daily!
Never Ever Miss A Move With Our Top Ten Stocks Lists
Find Best Stocks In Any Market - Bull or Bear Market
Take A Peek At Our Top Ten Stocks Lists: Daily, Weekly, Year-to-Date & Top Trends
Find Best Stocks In Any Market - Bull or Bear Market
Take A Peek At Our Top Ten Stocks Lists: Daily, Weekly, Year-to-Date & Top Trends
Biotech Stocks With Best Up Trends [0-bearish to 100-bullish]: Annovis Bio[100], Agios [100], Agenus [95], Mesoblast [95], Cullinan Oncology[93], Avadel [93], Pieris [93], NewAmsterdam Pharma[93], PureTech Health[93], Exelixis [90], ALX Oncology[88]
Best Biotech Stocks Year-to-Date:
Pieris [6273.63%], Precision [2590.41%], Inovio [1885.29%], Assembly [1529.07%], NuCana [1198.17%], Adverum nologies[1147.34%], Agenus [902.54%], Affimed N.V[680.8%], Mesoblast [459.09%], Corbus [454.64%], Janux [338.34%] Best Biotech Stocks This Week:
Pieris [7900%], Agenus [56.31%], ProKidney [32.84%], Seres [32.65%], Annovis Bio[30%], BeyondSpring [26.11%], Cullinan Oncology[22.92%], Pharvaris N.V[18.84%], Mesoblast [18.04%], BeiGene [14.7%], Avid Bioservices[14.2%] Best Biotech Stocks Daily:
Galera [13.74%], Agenus [11.86%], ADiTx [10.57%], Apollomics [9.94%], Pharming [9.06%], Structure [8.13%], Pharvaris N.V[7.91%], ProKidney [7.75%], Avid Bioservices[7.17%], Merus N.V[7.05%], Zura Bio[6.75%]