
 Login Sign Up


| |||||
 |  | ||||

| 12Stocks.com Market Intelligence |
Best Biotech Stocks
|
|
| Quick Read: Best Biotech Stocks List By Performances & Trends: Daily, Weekly, Year-to-Date, Market Cap (Size) & Technical Trends | |||
| Best Biotech Stocks Views: Quick Browse View, Summary & Slide Show View | |||
| 12Stocks.com Biotech Stocks Performances & Trends Daily | |||||||||
|
|  The overall market intelligence score is 62 (0-bearish to 100-bullish) which puts Biotech sector in short term neutral to bullish trend. The market intelligence score from previous trading session is 55 and hence an improvement of trend.
| ||||||||
Here are the market intelligence trend scores of the most requested Biotech stocks at 12Stocks.com (click stock name for detailed review):
|


| 12Stocks.com: Investing in Biotech sector with Stocks | |
|
The following table helps investors and traders sort through current performance and trends (as measured by market intelligence score) of various
stocks in the Biotech sector. Quick View: Move mouse or cursor over stock symbol (ticker) to view short-term Technical chart and over stock name to view long term chart. Click on  to add stock symbol to your watchlist and to add stock symbol to your watchlist and  to view watchlist. Click on any ticker or stock name for detailed market intelligence report for that stock. to view watchlist. Click on any ticker or stock name for detailed market intelligence report for that stock. |
12Stocks.com Performance of Stocks in Biotech Sector
| Ticker | Stock Name | Watchlist | Category | Recent Price | Market Intelligence Score | Change % | YTD Change% |
| GHRS | GH Research |   | Biotechnology | 12.08 | 95 | 3.07% | 120.44% |
| CRNX | Crinetics | | Biotechnology | 47.68 | 95 | 2.58% | 34.01% |
| HRTX | Heron | | Biotechnology | 2.87 | 95 | 1.06% | 68.82% |
| NBIX | Neurocrine | | Biotechnology | 143.19 | 95 | 1.04% | 8.67% |
| SRPT | Sarepta | | Biotechnology | 136.04 | 95 | 0.74% | 41.08% |
| SIGA | SIGA Technologies | | Biotechnology | 10.46 | 95 | 0.67% | 86.79% |
| SPRO | Spero | | Biotechnology | 1.68 | 95 | 0.60% | 14.29% |
| ADMA | ADMA Biologics | | Biotechnology | 6.91 | 95 | 0.00% | 52.88% |
| BDTX | Black Diamond | | Biotechnology | 7.19 | 95 | -2.71% | 155.87% |
| XBIT | X | | Biotechnology | 9.20 | 95 | -1.92% | 130.00% |
| VYGR | Voyager | | Biotechnology | 8.77 | 95 | -1.90% | 3.91% |
| MESO | Mesoblast | | Biotechnology | 7.96 | 95 | -0.69% | 623.18% |
| CGEM | Cullinan Oncology | | Biotechnology | 29.35 | 90 | 3.27% | 187.89% |
| GBIO | Generation Bio | | Biotechnology | 3.18 | 90 | 1.92% | 92.73% |
| HUMA | Humacyte | | Biotechnology | 4.61 | 90 | 1.32% | 62.32% |
| NBTX | Nanobiotix S.A | | Biotechnology | 6.41 | 90 | 0.16% | -13.61% |
| FBIOP | Fortress | | Biotechnology | 16.20 | 90 | 0.00% | 36.47% |
| PROK | ProKidney | | Biotechnology | 2.39 | 88 | 6.70% | 36.96% |
| PTN | Palatin Technologies | | Biotechnology | 2.08 | 88 | 4.00% | -47.74% |
| TECH | Bio-Techne | | Biotechnology | 77.46 | 88 | 1.84% | 0.39% |
| GMAB | Genmab A/S | | Biotechnology | 29.27 | 88 | 0.83% | -8.07% |
| AMGN | Amgen | | Biotechnology | 300.30 | 88 | 0.27% | 4.26% |
| RANI | Rani | | Biotechnology | 7.46 | 88 | -2.36% | 126.06% |
| XNCR | Xencor | | Biotechnology | 24.24 | 88 | -0.29% | 14.18% |
| RPHM | Reneo | | Biotechnology | 1.74 | 88 | 0.29% | 7.41% |
| To view more stocks, click on Next / Previous arrows or select different range: 0 - 25 , 25 - 50 , 50 - 75 , 75 - 100 , 100 - 125 , 125 - 150 , 150 - 175 , 175 - 200 , 200 - 225 , 225 - 250 , 250 - 275 , 275 - 300 , 300 - 325 , 325 - 350 , 350 - 375 , 375 - 400 | ||
 | Click To Change The Sort Order: By Market Cap or Company Size Performance: Year-to-date, Week and Day |  |
|
Get the most comprehensive stock market coverage daily at 12Stocks.com ➞ Best Stocks Today ➞ Best Stocks Weekly ➞ Best Stocks Year-to-Date ➞ Best Stocks Trends ➞  Best Stocks Today 12Stocks.com Best Nasdaq Stocks ➞ Best S&P 500 Stocks ➞ Best Tech Stocks ➞ Best Biotech Stocks ➞ |
| Detailed Overview of Biotech Stocks |
| Biotech Technical Overview, Leaders & Laggards, Top Biotech ETF Funds & Detailed Biotech Stocks List, Charts, Trends & More |
| Biotech Sector: Technical Analysis, Trends & YTD Performance | |
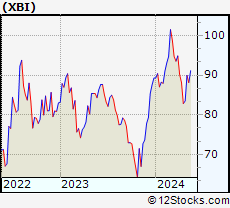
| Biotech sector, as represented by XBI, an exchange-traded fund [ETF] that holds basket of Biotech stocks (e.g, Amgen, Celgene) is up by 1.28% and is currently underperforming the overall market by -6.84% year-to-date. Below is a quick view of Technical charts and trends: | |
 XBI Weekly Chart |
|
| Long Term Trend: Not Good | |
| Medium Term Trend: Very Good | |
 XBI Daily Chart |
|
| Short Term Trend: Very Good | |
| Overall Trend Score: 62 | |
| YTD Performance: 1.28% | |
| **Trend Scores & Views Are Only For Educational Purposes And Not For Investing | |
| 12Stocks.com: Top Performing Biotech Sector Stocks | ||||||||||||||||||||||||||||||||||||||||||||||||
 The top performing Biotech sector stocks year to date are
Now, more recently, over last week, the top performing Biotech sector stocks on the move are


|
||||||||||||||||||||||||||||||||||||||||||||||||
| 12Stocks.com: Investing in Biotech Sector using Exchange Traded Funds | |
|
The following table shows list of key exchange traded funds (ETF) that
help investors track Biotech Index. For detailed view, check out our ETF Funds section of our website. Quick View: Move mouse or cursor over ETF symbol (ticker) to view short-term Technical chart and over ETF name to view long term chart. Click on ticker or stock name for detailed view. Click on to add stock symbol to your watchlist and to view watchlist. |
12Stocks.com List of ETFs that track Biotech Index
| Ticker | ETF Name | Watchlist | Recent Price | Market Intelligence Score | Change % | Week % | Year-to-date % |
| LABD | Biotech Bear 3X | | 8.16 | 36 | 0.25 | -1.45 | -15.79% |
| XBI | Biotech | | 90.43 | 62 | -0.17 | 0.5 | 1.28% |
| LABU | Biotech Bull 3X | | 110.25 | 57 | -0.33 | 1.16 | -9.61% |
| IBB | Biotechnology | | 133.28 | 62 | 0.20 | 0.24 | -1.89% |
| IYH | Healthcare | | 60.00 | 64 | 0.79 | 1.25 | 4.81% |
| IHF | Healthcare Providers | | 52.51 | 67 | 1.04 | 1.59 | 0% |
| IXJ | Global Healthcare | | 90.81 | 82 | 0.84 | 1.28 | 4.72% |
| CURE | Healthcare Bull 3X | | 110.75 | 64 | 2.54 | 3.61 | 8.86% |
| PTH | DWA Healthcare Momentum | | 42.21 | 62 | 0.70 | 0.38 | 7.84% |
| BIB | Biotechnology | | 55.60 | 55 | 0.42 | -0.05 | -2.54% |
| FBT | First NYSE | | 148.96 | 67 | 0.36 | 0.51 | -5.75% |
| BBC | Bio Biotechnology Clinical | | 28.10 | 62 | 0.64 | 0.75 | 14.92% |
| BBH | Biotech | | 163.85 | 75 | 0.04 | -0.18 | -0.88% |
| PBE | Biotech & Genome | | 64.18 | 74 | 0.93 | 0.11 | -2.52% |
| BTEC | Principal Healthcare Innovators | | 37.03 | 74 | -0.08 | 0.16 | 1.93% |
| BIS | Short Biotech | | 18.00 | 53 | -1.21 | 0.06 | -0.39% |
| BBP | Bio Biotechnology Products | | 55.46 | 52 | -0.52 | -0.05 | -4.53% |
| 12Stocks.com: Charts, Trends, Fundamental Data and Performances of Biotech Stocks | |
|
We now take in-depth look at all Biotech stocks including charts, multi-period performances and overall trends (as measured by market intelligence score). One can sort Biotech stocks (click link to choose) by Daily, Weekly and by Year-to-Date performances. Also, one can sort by size of the company or by market capitalization. |
| Select Your Default Chart Type: | |||||
| |||||
| Click on stock symbol or name for detailed view. Click on to add stock symbol to your watchlist and to view watchlist. Quick View: Move mouse or cursor over "Daily" to quickly view daily Technical stock chart and over "Weekly" to view weekly Technical stock chart. | |||||

 | GHRS GH Research PLC |
| Sector: Health Care | |
| SubSector: Biotechnology | |
| MarketCap: 614 Millions | |
| Recent Price: 12.08 Market Intelligence Score: 95 | |
| Day Percent Change: 3.07% Day Change: 0.36 | |
| Week Change: 5.04% Year-to-date Change: 120.4% | |
| GHRS Links: Profile News Message Board | |
| Charts:- Daily , Weekly | |
| Add GHRS to Watchlist: View: Get Complete GHRS Trend Analysis ➞ | |
 | CRNX Crinetics Pharmaceuticals, Inc. |
| Sector: Health Care | |
| SubSector: Biotechnology | |
| MarketCap: 381.085 Millions | |
| Recent Price: 47.68 Market Intelligence Score: 95 | |
| Day Percent Change: 2.58% Day Change: 1.20 | |
| Week Change: 1.02% Year-to-date Change: 34.0% | |
| CRNX Links: Profile News Message Board | |
| Charts:- Daily , Weekly | |
| Add CRNX to Watchlist: View: Get Complete CRNX Trend Analysis ➞ | |
 | HRTX Heron Therapeutics, Inc. |
| Sector: Health Care | |
| SubSector: Biotechnology | |
| MarketCap: 1172.75 Millions | |
| Recent Price: 2.87 Market Intelligence Score: 95 | |
| Day Percent Change: 1.06% Day Change: 0.03 | |
| Week Change: 9.96% Year-to-date Change: 68.8% | |
| HRTX Links: Profile News Message Board | |
| Charts:- Daily , Weekly | |
| Add HRTX to Watchlist: View: Get Complete HRTX Trend Analysis ➞ | |
 | NBIX Neurocrine Biosciences, Inc. |
| Sector: Health Care | |
| SubSector: Biotechnology | |
| MarketCap: 7897.85 Millions | |
| Recent Price: 143.19 Market Intelligence Score: 95 | |
| Day Percent Change: 1.04% Day Change: 1.48 | |
| Week Change: 1.76% Year-to-date Change: 8.7% | |
| NBIX Links: Profile News Message Board | |
| Charts:- Daily , Weekly | |
| Add NBIX to Watchlist: View: Get Complete NBIX Trend Analysis ➞ | |
 | SRPT Sarepta Therapeutics, Inc. |
| Sector: Health Care | |
| SubSector: Biotechnology | |
| MarketCap: 7388.05 Millions | |
| Recent Price: 136.04 Market Intelligence Score: 95 | |
| Day Percent Change: 0.74% Day Change: 1.00 | |
| Week Change: 1.78% Year-to-date Change: 41.1% | |
| SRPT Links: Profile News Message Board | |
| Charts:- Daily , Weekly | |
| Add SRPT to Watchlist: View: Get Complete SRPT Trend Analysis ➞ | |
 | SIGA SIGA Technologies, Inc. |
| Sector: Health Care | |
| SubSector: Biotechnology | |
| MarketCap: 424.285 Millions | |
| Recent Price: 10.46 Market Intelligence Score: 95 | |
| Day Percent Change: 0.67% Day Change: 0.07 | |
| Week Change: 3.05% Year-to-date Change: 86.8% | |
| SIGA Links: Profile News Message Board | |
| Charts:- Daily , Weekly | |
| Add SIGA to Watchlist: View: Get Complete SIGA Trend Analysis ➞ | |
 | SPRO Spero Therapeutics, Inc. |
| Sector: Health Care | |
| SubSector: Biotechnology | |
| MarketCap: 121.085 Millions | |
| Recent Price: 1.68 Market Intelligence Score: 95 | |
| Day Percent Change: 0.60% Day Change: 0.01 | |
| Week Change: 3.07% Year-to-date Change: 14.3% | |
| SPRO Links: Profile News Message Board | |
| Charts:- Daily , Weekly | |
| Add SPRO to Watchlist: View: Get Complete SPRO Trend Analysis ➞ | |
 | ADMA ADMA Biologics, Inc. |
| Sector: Health Care | |
| SubSector: Biotechnology | |
| MarketCap: 204.985 Millions | |
| Recent Price: 6.91 Market Intelligence Score: 95 | |
| Day Percent Change: 0.00% Day Change: 0.00 | |
| Week Change: 1.47% Year-to-date Change: 52.9% | |
| ADMA Links: Profile News Message Board | |
| Charts:- Daily , Weekly | |
| Add ADMA to Watchlist: View: Get Complete ADMA Trend Analysis ➞ | |
 | BDTX Black Diamond Therapeutics, Inc. |
| Sector: Health Care | |
| SubSector: Biotechnology | |
| MarketCap: 12587 Millions | |
| Recent Price: 7.19 Market Intelligence Score: 95 | |
| Day Percent Change: -2.71% Day Change: -0.20 | |
| Week Change: 3.3% Year-to-date Change: 155.9% | |
| BDTX Links: Profile News Message Board | |
| Charts:- Daily , Weekly | |
| Add BDTX to Watchlist: View: Get Complete BDTX Trend Analysis ➞ | |
 | XBIT XBiotech Inc. |
| Sector: Health Care | |
| SubSector: Biotechnology | |
| MarketCap: 420.385 Millions | |
| Recent Price: 9.20 Market Intelligence Score: 95 | |
| Day Percent Change: -1.92% Day Change: -0.18 | |
| Week Change: 8.36% Year-to-date Change: 130.0% | |
| XBIT Links: Profile News Message Board | |
| Charts:- Daily , Weekly | |
| Add XBIT to Watchlist: View: Get Complete XBIT Trend Analysis ➞ | |
 | VYGR Voyager Therapeutics, Inc. |
| Sector: Health Care | |
| SubSector: Biotechnology | |
| MarketCap: 321.085 Millions | |
| Recent Price: 8.77 Market Intelligence Score: 95 | |
| Day Percent Change: -1.90% Day Change: -0.17 | |
| Week Change: -0.45% Year-to-date Change: 3.9% | |
| VYGR Links: Profile News Message Board | |
| Charts:- Daily , Weekly | |
| Add VYGR to Watchlist: View: Get Complete VYGR Trend Analysis ➞ | |
 | MESO Mesoblast Limited |
| Sector: Health Care | |
| SubSector: Biotechnology | |
| MarketCap: 471.385 Millions | |
| Recent Price: 7.96 Market Intelligence Score: 95 | |
| Day Percent Change: -0.69% Day Change: -0.05 | |
| Week Change: 6.07% Year-to-date Change: 623.2% | |
| MESO Links: Profile News Message Board | |
| Charts:- Daily , Weekly | |
| Add MESO to Watchlist: View: Get Complete MESO Trend Analysis ➞ | |
 | CGEM Cullinan Oncology, Inc. |
| Sector: Health Care | |
| SubSector: Biotechnology | |
| MarketCap: 433 Millions | |
| Recent Price: 29.35 Market Intelligence Score: 90 | |
| Day Percent Change: 3.27% Day Change: 0.93 | |
| Week Change: 3.97% Year-to-date Change: 187.9% | |
| CGEM Links: Profile News Message Board | |
| Charts:- Daily , Weekly | |
| Add CGEM to Watchlist: View: Get Complete CGEM Trend Analysis ➞ | |
 | GBIO Generation Bio Co. |
| Sector: Health Care | |
| SubSector: Biotechnology | |
| MarketCap: 17487 Millions | |
| Recent Price: 3.18 Market Intelligence Score: 90 | |
| Day Percent Change: 1.92% Day Change: 0.06 | |
| Week Change: 0% Year-to-date Change: 92.7% | |
| GBIO Links: Profile News Message Board | |
| Charts:- Daily , Weekly | |
| Add GBIO to Watchlist: View: Get Complete GBIO Trend Analysis ➞ | |
 | HUMA Humacyte, Inc. |
| Sector: Health Care | |
| SubSector: Biotechnology | |
| MarketCap: 297 Millions | |
| Recent Price: 4.61 Market Intelligence Score: 90 | |
| Day Percent Change: 1.32% Day Change: 0.06 | |
| Week Change: 3.6% Year-to-date Change: 62.3% | |
| HUMA Links: Profile News Message Board | |
| Charts:- Daily , Weekly | |
| Add HUMA to Watchlist: View: Get Complete HUMA Trend Analysis ➞ | |
 | NBTX Nanobiotix S.A. |
| Sector: Health Care | |
| SubSector: Biotechnology | |
| MarketCap: 177 Millions | |
| Recent Price: 6.41 Market Intelligence Score: 90 | |
| Day Percent Change: 0.16% Day Change: 0.01 | |
| Week Change: 7.19% Year-to-date Change: -13.6% | |
| NBTX Links: Profile News Message Board | |
| Charts:- Daily , Weekly | |
| Add NBTX to Watchlist: View: Get Complete NBTX Trend Analysis ➞ | |
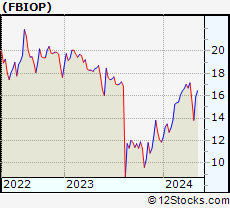 | FBIOP Fortress Biotech, Inc. |
| Sector: Health Care | |
| SubSector: Biotechnology | |
| MarketCap: 836.085 Millions | |
| Recent Price: 16.20 Market Intelligence Score: 90 | |
| Day Percent Change: 0.00% Day Change: 0.00 | |
| Week Change: 1.62% Year-to-date Change: 36.5% | |
| FBIOP Links: Profile News Message Board | |
| Charts:- Daily , Weekly | |
| Add FBIOP to Watchlist: View: Get Complete FBIOP Trend Analysis ➞ | |
 | PROK ProKidney Corp. |
| Sector: Health Care | |
| SubSector: Biotechnology | |
| MarketCap: 2470 Millions | |
| Recent Price: 2.39 Market Intelligence Score: 88 | |
| Day Percent Change: 6.70% Day Change: 0.15 | |
| Week Change: 11.94% Year-to-date Change: 37.0% | |
| PROK Links: Profile News Message Board | |
| Charts:- Daily , Weekly | |
| Add PROK to Watchlist: View: Get Complete PROK Trend Analysis ➞ | |
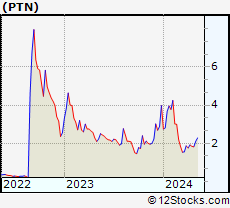 | PTN Palatin Technologies, Inc. |
| Sector: Health Care | |
| SubSector: Biotechnology | |
| MarketCap: 109.285 Millions | |
| Recent Price: 2.08 Market Intelligence Score: 88 | |
| Day Percent Change: 4.00% Day Change: 0.08 | |
| Week Change: -1.42% Year-to-date Change: -47.7% | |
| PTN Links: Profile News Message Board | |
| Charts:- Daily , Weekly | |
| Add PTN to Watchlist: View: Get Complete PTN Trend Analysis ➞ | |
 | TECH Bio-Techne Corporation |
| Sector: Health Care | |
| SubSector: Biotechnology | |
| MarketCap: 6958.05 Millions | |
| Recent Price: 77.46 Market Intelligence Score: 88 | |
| Day Percent Change: 1.84% Day Change: 1.40 | |
| Week Change: 0.22% Year-to-date Change: 0.4% | |
| TECH Links: Profile News Message Board | |
| Charts:- Daily , Weekly | |
| Add TECH to Watchlist: View: Get Complete TECH Trend Analysis ➞ | |
 | GMAB Genmab A/S |
| Sector: Health Care | |
| SubSector: Biotechnology | |
| MarketCap: 12482.3 Millions | |
| Recent Price: 29.27 Market Intelligence Score: 88 | |
| Day Percent Change: 0.83% Day Change: 0.24 | |
| Week Change: -1.51% Year-to-date Change: -8.1% | |
| GMAB Links: Profile News Message Board | |
| Charts:- Daily , Weekly | |
| Add GMAB to Watchlist: View: Get Complete GMAB Trend Analysis ➞ | |
 | AMGN Amgen Inc. |
| Sector: Health Care | |
| SubSector: Biotechnology | |
| MarketCap: 121030 Millions | |
| Recent Price: 300.30 Market Intelligence Score: 88 | |
| Day Percent Change: 0.27% Day Change: 0.82 | |
| Week Change: -3.53% Year-to-date Change: 4.3% | |
| AMGN Links: Profile News Message Board | |
| Charts:- Daily , Weekly | |
| Add AMGN to Watchlist: View: Get Complete AMGN Trend Analysis ➞ | |
 | RANI Rani Therapeutics Holdings, Inc. |
| Sector: Health Care | |
| SubSector: Biotechnology | |
| MarketCap: 202 Millions | |
| Recent Price: 7.46 Market Intelligence Score: 88 | |
| Day Percent Change: -2.36% Day Change: -0.18 | |
| Week Change: 4.78% Year-to-date Change: 126.1% | |
| RANI Links: Profile News Message Board | |
| Charts:- Daily , Weekly | |
| Add RANI to Watchlist: View: Get Complete RANI Trend Analysis ➞ | |
 | XNCR Xencor, Inc. |
| Sector: Health Care | |
| SubSector: Biotechnology | |
| MarketCap: 1744.35 Millions | |
| Recent Price: 24.24 Market Intelligence Score: 88 | |
| Day Percent Change: -0.29% Day Change: -0.07 | |
| Week Change: 0.54% Year-to-date Change: 14.2% | |
| XNCR Links: Profile News Message Board | |
| Charts:- Daily , Weekly | |
| Add XNCR to Watchlist: View: Get Complete XNCR Trend Analysis ➞ | |
 | RPHM Reneo Pharmaceuticals, Inc. |
| Sector: Health Care | |
| SubSector: Biotechnology | |
| MarketCap: 233 Millions | |
| Recent Price: 1.74 Market Intelligence Score: 88 | |
| Day Percent Change: 0.29% Day Change: 0.00 | |
| Week Change: 0.58% Year-to-date Change: 7.4% | |
| RPHM Links: Profile News Message Board | |
| Charts:- Daily , Weekly | |
| Add RPHM to Watchlist: View: Get Complete RPHM Trend Analysis ➞ | |
| To view more stocks, click on Next / Previous arrows or select different range: 0 - 25 , 25 - 50 , 50 - 75 , 75 - 100 , 100 - 125 , 125 - 150 , 150 - 175 , 175 - 200 , 200 - 225 , 225 - 250 , 250 - 275 , 275 - 300 , 300 - 325 , 325 - 350 , 350 - 375 , 375 - 400 | ||
| Click To Change The Sort Order: By Market Cap or Company Size Performance: Year-to-date, Week and Day | |
| Select Chart Type: | ||
|
Best Stocks Today 12Stocks.com |
© 2024 12Stocks.com Terms & Conditions Privacy Contact Us
All Information Provided Only For Education And Not To Be Used For Investing or Trading. See Terms & Conditions


One More Thing ... Get Best Stocks Delivered Daily!
Never Ever Miss A Move With Our Top Ten Stocks Lists
Find Best Stocks In Any Market - Bull or Bear Market
Take A Peek At Our Top Ten Stocks Lists: Daily, Weekly, Year-to-Date & Top Trends
Find Best Stocks In Any Market - Bull or Bear Market
Take A Peek At Our Top Ten Stocks Lists: Daily, Weekly, Year-to-Date & Top Trends
Biotech Stocks With Best Up Trends [0-bearish to 100-bullish]: Design [100], Summit [100], Vanda [100], Emergent Bio[100], Cue Biopharma[100], Edgewise [100], Verrica [100], Avid Bioservices[100], Entrada [100], United [100], Blueprint Medicines[100]
Best Biotech Stocks Year-to-Date:
Pieris [5965.93%], Precision [2782.19%], Avenue [2620.5%], Inovio [2086.27%], Assembly [1438.84%], Agenus [1350.66%], Adverum nologies[1273.54%], NuCana [1211.7%], Affimed N.V[736.8%], Mesoblast [623.18%], Corbus [558.44%] Best Biotech Stocks This Week:
Design [23.42%], Passage Bio[21.37%], Summit [20.96%], FibroGen [20.18%], Lineage Cell[18.87%], BioCryst [18.2%], Vigil Neuroscience[17.28%], ALX Oncology[14.32%], Cerus [14.2%], Esperion [13.94%], Emergent Bio[13.11%] Best Biotech Stocks Daily:
Design [28.85%], Summit [18.79%], FibroGen [18.10%], Vanda [13.22%], Passage Bio[12.77%], Esperion [11.79%], Emergent Bio[10.55%], Vigil Neuroscience[10.38%], Athira Pharma[10.10%], ALX Oncology[9.75%], Sutro Biopharma[9.25%]