
 Login Sign Up


| |||||
 |  | ||||

| 12Stocks.com Market Intelligence |
Best Biotech Stocks
|
|
| Quick Read: Best Biotech Stocks List By Performances & Trends: Daily, Weekly, Year-to-Date, Market Cap (Size) & Technical Trends | |||
| Best Biotech Stocks Views: Quick Browse View, Summary & Slide Show View | |||
| 12Stocks.com Biotech Stocks Performances & Trends Daily | |||||||||
|
|  The overall market intelligence score is 0 (0-bearish to 100-bullish) which puts Biotech sector in short term bearish trend. The market intelligence score from previous trading session is 26 and a deterioration of trend continues.
| ||||||||
Here are the market intelligence trend scores of the most requested Biotech stocks at 12Stocks.com (click stock name for detailed review):
|


| 12Stocks.com: Investing in Biotech sector with Stocks | |
|
The following table helps investors and traders sort through current performance and trends (as measured by market intelligence score) of various
stocks in the Biotech sector. Quick View: Move mouse or cursor over stock symbol (ticker) to view short-term Technical chart and over stock name to view long term chart. Click on  to add stock symbol to your watchlist and to add stock symbol to your watchlist and  to view watchlist. Click on any ticker or stock name for detailed market intelligence report for that stock. to view watchlist. Click on any ticker or stock name for detailed market intelligence report for that stock. |
12Stocks.com Performance of Stocks in Biotech Sector
| Ticker | Stock Name | Watchlist | Category | Recent Price | Market Intelligence Score | Change % | YTD Change% |
| AMGN | Amgen |   | Biotechnology | 264.07 | 20 | -0.59% | -8.32% |
| NVO | Novo Nordisk | | Biotechnology | 124.53 | 51 | 0.87% | 20.38% |
| GILD | Gilead | | Biotechnology | 66.93 | 10 | -0.56% | -17.38% |
| PLRX | Pliant | | Biotechnology | 12.86 | 0 | -3.02% | -29.03% |
| ANNX | Annexon | | Biotechnology | 4.58 | 26 | -10.46% | 0.44% |
| ATHA | Athira Pharma | | Biotechnology | 2.12 | 0 | 0.24% | -13.32% |
| DYN | Dyne | | Biotechnology | 24.82 | 20 | 0.77% | 86.62% |
| GLSI | Greenwich Life | | Biotechnology | 13.15 | 26 | -8.81% | 24.06% |
| ALGS | Aligos | | Biotechnology | 0.81 | 31 | -3.23% | 24.06% |
| TSHA | Taysha Gene | | Biotechnology | 2.44 | 26 | -5.24% | 37.08% |
| TARS | Tarsus | | Biotechnology | 34.44 | 36 | -1.32% | 69.82% |
| FHTX | Foghorn | | Biotechnology | 5.76 | 36 | -4.48% | -10.21% |
| MNPR | Monopar | | Biotechnology | 0.66 | 36 | -10.03% | 90.41% |
| MRVI | Maravai Life | | Biotechnology | 7.73 | 36 | -5.04% | 18.02% |
| PSTX | Poseida | | Biotechnology | 2.03 | 0 | 0.00% | -39.67% |
| VRTX | Vertex | | Biotechnology | 393.10 | 10 | -0.27% | -3.39% |
| INZY | Inozyme Pharma | | Biotechnology | 4.65 | 10 | -4.12% | 9.28% |
| BIIB | Biogen | | Biotechnology | 192.16 | 0 | -1.53% | -25.74% |
| FUSN | Fusion | | Biotechnology | 21.24 | 51 | -0.09% | 121.25% |
| REGN | Regeneron | | Biotechnology | 901.19 | 25 | 0.79% | 2.61% |
| ADXN | Addex | | Biotechnology | 22.80 | 61 | 0.88% | 274.38% |
| SPRB | Spruce | | Biotechnology | 0.70 | 15 | 0.64% | -75.87% |
| SEER | Seer | | Biotechnology | 1.69 | 5 | -3.43% | -13.33% |
| IVA | Inventiva S.A | | Biotechnology | 3.22 | 0 | -2.72% | -28.60% |
| RLAY | Relay | | Biotechnology | 6.21 | 0 | -7.86% | -43.55% |
| To view more stocks, click on Next / Previous arrows or select different range: 0 - 25 , 25 - 50 , 50 - 75 , 75 - 100 , 100 - 125 , 125 - 150 , 150 - 175 , 175 - 200 , 200 - 225 , 225 - 250 , 250 - 275 , 275 - 300 , 300 - 325 , 325 - 350 , 350 - 375 , 375 - 400 | ||
 | Click To Change The Sort Order: By Market Cap or Company Size Performance: Year-to-date, Week and Day |  |
|
Get the most comprehensive stock market coverage daily at 12Stocks.com ➞ Best Stocks Today ➞ Best Stocks Weekly ➞ Best Stocks Year-to-Date ➞ Best Stocks Trends ➞  Best Stocks Today 12Stocks.com Best Nasdaq Stocks ➞ Best S&P 500 Stocks ➞ Best Tech Stocks ➞ Best Biotech Stocks ➞ |
| Detailed Overview of Biotech Stocks |
| Biotech Technical Overview, Leaders & Laggards, Top Biotech ETF Funds & Detailed Biotech Stocks List, Charts, Trends & More |
| Biotech Sector: Technical Analysis, Trends & YTD Performance | |
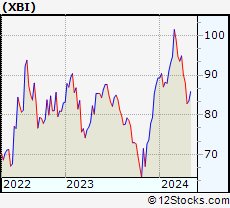
| Biotech sector, as represented by XBI, an exchange-traded fund [ETF] that holds basket of Biotech stocks (e.g, Amgen, Celgene) is down by -5.2% and is currently underperforming the overall market by -9.61% year-to-date. Below is a quick view of Technical charts and trends: | |
 XBI Weekly Chart |
|
| Long Term Trend: Not Good | |
| Medium Term Trend: Not Good | |
 XBI Daily Chart |
|
| Short Term Trend: Not Good | |
| Overall Trend Score: 0 | |
| YTD Performance: -5.2% | |
| **Trend Scores & Views Are Only For Educational Purposes And Not For Investing | |
| 12Stocks.com: Top Performing Biotech Sector Stocks | ||||||||||||||||||||||||||||||||||||||||||||||||
 The top performing Biotech sector stocks year to date are
Now, more recently, over last week, the top performing Biotech sector stocks on the move are


|
||||||||||||||||||||||||||||||||||||||||||||||||
| 12Stocks.com: Investing in Biotech Sector using Exchange Traded Funds | |
|
The following table shows list of key exchange traded funds (ETF) that
help investors track Biotech Index. For detailed view, check out our ETF Funds section of our website. Quick View: Move mouse or cursor over ETF symbol (ticker) to view short-term Technical chart and over ETF name to view long term chart. Click on ticker or stock name for detailed view. Click on to add stock symbol to your watchlist and to view watchlist. |
12Stocks.com List of ETFs that track Biotech Index
| Ticker | ETF Name | Watchlist | Recent Price | Market Intelligence Score | Change % | Week % | Year-to-date % |
| LABD | Biotech Bear 3X | | 10.08 | 87 | 5.11 | 12.25 | 4.02% |
| XBI | Biotech | | 84.65 | 0 | -1.80 | -3.97 | -5.2% |
| LABU | Biotech Bull 3X | | 92.02 | 0 | -5.43 | -11.82 | -24.56% |
| IBB | Biotechnology | | 125.89 | 0 | -0.85 | -2.85 | -7.33% |
| IYH | Healthcare | | 58.06 | 18 | -0.12 | -0.58 | 1.42% |
| IHF | Healthcare Providers | | 51.07 | 32 | 0.29 | 1.05 | -2.74% |
| IXJ | Global Healthcare | | 87.64 | 25 | 0.00 | -0.39 | 1.06% |
| CURE | Healthcare Bull 3X | | 102.67 | 18 | -0.68 | -0.7 | 0.91% |
| FBT | First NYSE | | 143.71 | 0 | -0.70 | -2.45 | -9.08% |
| BIS | Short Biotech | | 20.52 | 100 | 1.84 | 4.69 | 13.56% |
| BIB | Biotechnology | | 48.93 | 0 | -2.61 | -4.79 | -14.23% |
| PTH | DWA Healthcare Momentum | | 40.45 | 36 | -0.81 | -3.3 | 3.35% |
| BBH | Biotech | | 153.01 | 0 | -0.53 | -2.91 | -7.44% |
| BTEC | Principal Healthcare Innovators | | 34.61 | 0 | -0.70 | -3.83 | -4.73% |
| PBE | Biotech & Genome | | 60.69 | 10 | -0.09 | -0.92 | -7.83% |
| BBC | Bio Biotechnology Clinical | | 25.82 | 26 | -1.00 | -4.81 | 5.59% |
| BBP | Bio Biotechnology Products | | 52.03 | 0 | -1.25 | -2 | -10.43% |
| 12Stocks.com: Charts, Trends, Fundamental Data and Performances of Biotech Stocks | |
|
We now take in-depth look at all Biotech stocks including charts, multi-period performances and overall trends (as measured by market intelligence score). One can sort Biotech stocks (click link to choose) by Daily, Weekly and by Year-to-Date performances. Also, one can sort by size of the company or by market capitalization. |
| Select Your Default Chart Type: | |||||
| |||||
| Click on stock symbol or name for detailed view. Click on to add stock symbol to your watchlist and to view watchlist. Quick View: Move mouse or cursor over "Daily" to quickly view daily Technical stock chart and over "Weekly" to view weekly Technical stock chart. | |||||

 | AMGN Amgen Inc. |
| Sector: Health Care | |
| SubSector: Biotechnology | |
| MarketCap: 121030 Millions | |
| Recent Price: 264.07 Market Intelligence Score: 20 | |
| Day Percent Change: -0.59% Day Change: -1.57 | |
| Week Change: -1.2% Year-to-date Change: -8.3% | |
| AMGN Links: Profile News Message Board | |
| Charts:- Daily , Weekly | |
| Add AMGN to Watchlist: View: Get Complete AMGN Trend Analysis ➞ | |
 | NVO Novo Nordisk A/S |
| Sector: Health Care | |
| SubSector: Biotechnology | |
| MarketCap: 100744 Millions | |
| Recent Price: 124.53 Market Intelligence Score: 51 | |
| Day Percent Change: 0.87% Day Change: 1.08 | |
| Week Change: 0.02% Year-to-date Change: 20.4% | |
| NVO Links: Profile News Message Board | |
| Charts:- Daily , Weekly | |
| Add NVO to Watchlist: View: Get Complete NVO Trend Analysis ➞ | |
 | GILD Gilead Sciences, Inc. |
| Sector: Health Care | |
| SubSector: Biotechnology | |
| MarketCap: 99485.6 Millions | |
| Recent Price: 66.93 Market Intelligence Score: 10 | |
| Day Percent Change: -0.56% Day Change: -0.38 | |
| Week Change: -2.51% Year-to-date Change: -17.4% | |
| GILD Links: Profile News Message Board | |
| Charts:- Daily , Weekly | |
| Add GILD to Watchlist: View: Get Complete GILD Trend Analysis ➞ | |
 | PLRX Pliant Therapeutics, Inc. |
| Sector: Health Care | |
| SubSector: Biotechnology | |
| MarketCap: 96487 Millions | |
| Recent Price: 12.86 Market Intelligence Score: 0 | |
| Day Percent Change: -3.02% Day Change: -0.40 | |
| Week Change: -9.12% Year-to-date Change: -29.0% | |
| PLRX Links: Profile News Message Board | |
| Charts:- Daily , Weekly | |
| Add PLRX to Watchlist: View: Get Complete PLRX Trend Analysis ➞ | |
 | ANNX Annexon, Inc. |
| Sector: Health Care | |
| SubSector: Biotechnology | |
| MarketCap: 94487 Millions | |
| Recent Price: 4.58 Market Intelligence Score: 26 | |
| Day Percent Change: -10.46% Day Change: -0.54 | |
| Week Change: -23.41% Year-to-date Change: 0.4% | |
| ANNX Links: Profile News Message Board | |
| Charts:- Daily , Weekly | |
| Add ANNX to Watchlist: View: Get Complete ANNX Trend Analysis ➞ | |
 | ATHA Athira Pharma, Inc. |
| Sector: Health Care | |
| SubSector: Biotechnology | |
| MarketCap: 92487 Millions | |
| Recent Price: 2.12 Market Intelligence Score: 0 | |
| Day Percent Change: 0.24% Day Change: 0.01 | |
| Week Change: -13.32% Year-to-date Change: -13.3% | |
| ATHA Links: Profile News Message Board | |
| Charts:- Daily , Weekly | |
| Add ATHA to Watchlist: View: Get Complete ATHA Trend Analysis ➞ | |
 | DYN Dyne Therapeutics, Inc. |
| Sector: Health Care | |
| SubSector: Biotechnology | |
| MarketCap: 88487 Millions | |
| Recent Price: 24.82 Market Intelligence Score: 20 | |
| Day Percent Change: 0.77% Day Change: 0.19 | |
| Week Change: -3.98% Year-to-date Change: 86.6% | |
| DYN Links: Profile News Message Board | |
| Charts:- Daily , Weekly | |
| Add DYN to Watchlist: View: Get Complete DYN Trend Analysis ➞ | |
 | GLSI Greenwich LifeSciences, Inc. |
| Sector: Health Care | |
| SubSector: Biotechnology | |
| MarketCap: 86487 Millions | |
| Recent Price: 13.15 Market Intelligence Score: 26 | |
| Day Percent Change: -8.81% Day Change: -1.27 | |
| Week Change: -15.97% Year-to-date Change: 24.1% | |
| GLSI Links: Profile News Message Board | |
| Charts:- Daily , Weekly | |
| Add GLSI to Watchlist: View: Get Complete GLSI Trend Analysis ➞ | |
 | ALGS Aligos Therapeutics, Inc. |
| Sector: Health Care | |
| SubSector: Biotechnology | |
| MarketCap: 76487 Millions | |
| Recent Price: 0.81 Market Intelligence Score: 31 | |
| Day Percent Change: -3.23% Day Change: -0.03 | |
| Week Change: -19.2% Year-to-date Change: 24.1% | |
| ALGS Links: Profile News Message Board | |
| Charts:- Daily , Weekly | |
| Add ALGS to Watchlist: View: Get Complete ALGS Trend Analysis ➞ | |
 | TSHA Taysha Gene Therapies, Inc. |
| Sector: Health Care | |
| SubSector: Biotechnology | |
| MarketCap: 76487 Millions | |
| Recent Price: 2.44 Market Intelligence Score: 26 | |
| Day Percent Change: -5.24% Day Change: -0.14 | |
| Week Change: -17.01% Year-to-date Change: 37.1% | |
| TSHA Links: Profile News Message Board | |
| Charts:- Daily , Weekly | |
| Add TSHA to Watchlist: View: Get Complete TSHA Trend Analysis ➞ | |
 | TARS Tarsus Pharmaceuticals, Inc. |
| Sector: Health Care | |
| SubSector: Biotechnology | |
| MarketCap: 74487 Millions | |
| Recent Price: 34.44 Market Intelligence Score: 36 | |
| Day Percent Change: -1.32% Day Change: -0.46 | |
| Week Change: -4.78% Year-to-date Change: 69.8% | |
| TARS Links: Profile News Message Board | |
| Charts:- Daily , Weekly | |
| Add TARS to Watchlist: View: Get Complete TARS Trend Analysis ➞ | |
 | FHTX Foghorn Therapeutics Inc. |
| Sector: Health Care | |
| SubSector: Biotechnology | |
| MarketCap: 74487 Millions | |
| Recent Price: 5.76 Market Intelligence Score: 36 | |
| Day Percent Change: -4.48% Day Change: -0.27 | |
| Week Change: -28% Year-to-date Change: -10.2% | |
| FHTX Links: Profile News Message Board | |
| Charts:- Daily , Weekly | |
| Add FHTX to Watchlist: View: Get Complete FHTX Trend Analysis ➞ | |
 | MNPR Monopar Therapeutics Inc. |
| Sector: Health Care | |
| SubSector: Biotechnology | |
| MarketCap: 71487 Millions | |
| Recent Price: 0.66 Market Intelligence Score: 36 | |
| Day Percent Change: -10.03% Day Change: -0.07 | |
| Week Change: -16.13% Year-to-date Change: 90.4% | |
| MNPR Links: Profile News Message Board | |
| Charts:- Daily , Weekly | |
| Add MNPR to Watchlist: View: Get Complete MNPR Trend Analysis ➞ | |
 | MRVI Maravai LifeSciences Holdings, Inc. |
| Sector: Health Care | |
| SubSector: Biotechnology | |
| MarketCap: 67887 Millions | |
| Recent Price: 7.73 Market Intelligence Score: 36 | |
| Day Percent Change: -5.04% Day Change: -0.41 | |
| Week Change: -7.98% Year-to-date Change: 18.0% | |
| MRVI Links: Profile News Message Board | |
| Charts:- Daily , Weekly | |
| Add MRVI to Watchlist: View: Get Complete MRVI Trend Analysis ➞ | |
 | PSTX Poseida Therapeutics, Inc. |
| Sector: Health Care | |
| SubSector: Biotechnology | |
| MarketCap: 64487 Millions | |
| Recent Price: 2.03 Market Intelligence Score: 0 | |
| Day Percent Change: 0.00% Day Change: 0.00 | |
| Week Change: -25.64% Year-to-date Change: -39.7% | |
| PSTX Links: Profile News Message Board | |
| Charts:- Daily , Weekly | |
| Add PSTX to Watchlist: View: Get Complete PSTX Trend Analysis ➞ | |
 | VRTX Vertex Pharmaceuticals Incorporated |
| Sector: Health Care | |
| SubSector: Biotechnology | |
| MarketCap: 57669.6 Millions | |
| Recent Price: 393.10 Market Intelligence Score: 10 | |
| Day Percent Change: -0.27% Day Change: -1.07 | |
| Week Change: -0.87% Year-to-date Change: -3.4% | |
| VRTX Links: Profile News Message Board | |
| Charts:- Daily , Weekly | |
| Add VRTX to Watchlist: View: Get Complete VRTX Trend Analysis ➞ | |
 | INZY Inozyme Pharma, Inc. |
| Sector: Health Care | |
| SubSector: Biotechnology | |
| MarketCap: 53487 Millions | |
| Recent Price: 4.65 Market Intelligence Score: 10 | |
| Day Percent Change: -4.12% Day Change: -0.20 | |
| Week Change: -9.53% Year-to-date Change: 9.3% | |
| INZY Links: Profile News Message Board | |
| Charts:- Daily , Weekly | |
| Add INZY to Watchlist: View: Get Complete INZY Trend Analysis ➞ | |
 | BIIB Biogen Inc. |
| Sector: Health Care | |
| SubSector: Biotechnology | |
| MarketCap: 53102.6 Millions | |
| Recent Price: 192.16 Market Intelligence Score: 0 | |
| Day Percent Change: -1.53% Day Change: -2.99 | |
| Week Change: -3.04% Year-to-date Change: -25.7% | |
| BIIB Links: Profile News Message Board | |
| Charts:- Daily , Weekly | |
| Add BIIB to Watchlist: View: Get Complete BIIB Trend Analysis ➞ | |
 | FUSN Fusion Pharmaceuticals Inc. |
| Sector: Health Care | |
| SubSector: Biotechnology | |
| MarketCap: 52487 Millions | |
| Recent Price: 21.24 Market Intelligence Score: 51 | |
| Day Percent Change: -0.09% Day Change: -0.02 | |
| Week Change: -0.56% Year-to-date Change: 121.3% | |
| FUSN Links: Profile News Message Board | |
| Charts:- Daily , Weekly | |
| Add FUSN to Watchlist: View: Get Complete FUSN Trend Analysis ➞ | |
 | REGN Regeneron Pharmaceuticals, Inc. |
| Sector: Health Care | |
| SubSector: Biotechnology | |
| MarketCap: 51903.7 Millions | |
| Recent Price: 901.19 Market Intelligence Score: 25 | |
| Day Percent Change: 0.79% Day Change: 7.05 | |
| Week Change: -0.39% Year-to-date Change: 2.6% | |
| REGN Links: Profile News Message Board | |
| Charts:- Daily , Weekly | |
| Add REGN to Watchlist: View: Get Complete REGN Trend Analysis ➞ | |
 | ADXN Addex Therapeutics Ltd |
| Sector: Health Care | |
| SubSector: Biotechnology | |
| MarketCap: 51487 Millions | |
| Recent Price: 22.80 Market Intelligence Score: 61 | |
| Day Percent Change: 0.88% Day Change: 0.20 | |
| Week Change: -10.83% Year-to-date Change: 274.4% | |
| ADXN Links: Profile News Message Board | |
| Charts:- Daily , Weekly | |
| Add ADXN to Watchlist: View: Get Complete ADXN Trend Analysis ➞ | |
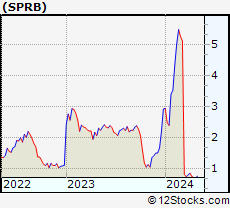 | SPRB Spruce Biosciences, Inc. |
| Sector: Health Care | |
| SubSector: Biotechnology | |
| MarketCap: 49487 Millions | |
| Recent Price: 0.70 Market Intelligence Score: 15 | |
| Day Percent Change: 0.64% Day Change: 0.00 | |
| Week Change: -4.28% Year-to-date Change: -75.9% | |
| SPRB Links: Profile News Message Board | |
| Charts:- Daily , Weekly | |
| Add SPRB to Watchlist: View: Get Complete SPRB Trend Analysis ➞ | |
 | SEER Seer, Inc. |
| Sector: Health Care | |
| SubSector: Biotechnology | |
| MarketCap: 48287 Millions | |
| Recent Price: 1.69 Market Intelligence Score: 5 | |
| Day Percent Change: -3.43% Day Change: -0.06 | |
| Week Change: -8.15% Year-to-date Change: -13.3% | |
| SEER Links: Profile News Message Board | |
| Charts:- Daily , Weekly | |
| Add SEER to Watchlist: View: Get Complete SEER Trend Analysis ➞ | |
 | IVA Inventiva S.A. |
| Sector: Health Care | |
| SubSector: Biotechnology | |
| MarketCap: 46487 Millions | |
| Recent Price: 3.22 Market Intelligence Score: 0 | |
| Day Percent Change: -2.72% Day Change: -0.09 | |
| Week Change: -9.3% Year-to-date Change: -28.6% | |
| IVA Links: Profile News Message Board | |
| Charts:- Daily , Weekly | |
| Add IVA to Watchlist: View: Get Complete IVA Trend Analysis ➞ | |
 | RLAY Relay Therapeutics, Inc. |
| Sector: Health Care | |
| SubSector: Biotechnology | |
| MarketCap: 45887 Millions | |
| Recent Price: 6.21 Market Intelligence Score: 0 | |
| Day Percent Change: -7.86% Day Change: -0.53 | |
| Week Change: -11.66% Year-to-date Change: -43.6% | |
| RLAY Links: Profile News Message Board | |
| Charts:- Daily , Weekly | |
| Add RLAY to Watchlist: View: Get Complete RLAY Trend Analysis ➞ | |
| To view more stocks, click on Next / Previous arrows or select different range: 0 - 25 , 25 - 50 , 50 - 75 , 75 - 100 , 100 - 125 , 125 - 150 , 150 - 175 , 175 - 200 , 200 - 225 , 225 - 250 , 250 - 275 , 275 - 300 , 300 - 325 , 325 - 350 , 350 - 375 , 375 - 400 | ||
| Click To Change The Sort Order: By Market Cap or Company Size Performance: Year-to-date, Week and Day | |
| Select Chart Type: | ||
|
Best Stocks Today 12Stocks.com |
© 2024 12Stocks.com Terms & Conditions Privacy Contact Us
All Information Provided Only For Education And Not To Be Used For Investing or Trading. See Terms & Conditions


One More Thing ... Get Best Stocks Delivered Daily!
Never Ever Miss A Move With Our Top Ten Stocks Lists
Find Best Stocks In Any Market - Bull or Bear Market
Take A Peek At Our Top Ten Stocks Lists: Daily, Weekly, Year-to-Date & Top Trends
Find Best Stocks In Any Market - Bull or Bear Market
Take A Peek At Our Top Ten Stocks Lists: Daily, Weekly, Year-to-Date & Top Trends
Biotech Stocks With Best Up Trends [0-bearish to 100-bullish]: Vanda [100], Rani [100], ALX Oncology[100], ProKidney [100], Avadel [100], Intra-Cellular Therapies[100], Galera [95], Reneo [93], NuCana [93], Black Diamond[90], Cullinan Oncology[90]
Best Biotech Stocks Year-to-Date:
Precision [3053.42%], Inovio [2070.59%], Assembly [1475.42%], Adverum nologies[1407.7%], NuCana [1242.12%], Affimed N.V[736.8%], Agenus [552.25%], Corbus [515.23%], Mesoblast [355.45%], Janux [346.07%], Addex [274.38%] Best Biotech Stocks This Week:
NuCana [1673.11%], ProKidney [61.71%], Rani [43.89%], Vanda [27.18%], Galera [24.86%], ALX Oncology[23.41%], Intra-Cellular Therapies[16.41%], Karyopharm [13.11%], ADC [12.98%], Avadel [12.51%], Black Diamond[8.78%] Best Biotech Stocks Daily:
Vanda [29.38%], Karyopharm [25.45%], Galera [16.71%], Inovio [14.89%], Rani [13.10%], Lineage Cell[12.17%], ADC [11.71%], Shattuck Labs[11.47%], ALX Oncology[10.97%], Mustang Bio[10.95%], Marinus [10.77%]