
 Login Sign Up


| |||||
 |  | ||||

| 12Stocks.com Market Intelligence |
Best Biotech Stocks
|
|
| Quick Read: Best Biotech Stocks List By Performances & Trends: Daily, Weekly, Year-to-Date, Market Cap (Size) & Technical Trends | |||
| Best Biotech Stocks Views: Quick Browse View, Summary & Slide Show View | |||
| 12Stocks.com Biotech Stocks Performances & Trends Daily | |||||||||
|
|  The overall market intelligence score is 55 (0-bearish to 100-bullish) which puts Biotech sector in short term neutral trend. The market intelligence score from previous trading session is 69 and hence a deterioration of trend.
| ||||||||
Here are the market intelligence trend scores of the most requested Biotech stocks at 12Stocks.com (click stock name for detailed review):
|


| 12Stocks.com: Investing in Biotech sector with Stocks | |
|
The following table helps investors and traders sort through current performance and trends (as measured by market intelligence score) of various
stocks in the Biotech sector. Quick View: Move mouse or cursor over stock symbol (ticker) to view short-term Technical chart and over stock name to view long term chart. Click on  to add stock symbol to your watchlist and to add stock symbol to your watchlist and  to view watchlist. Click on any ticker or stock name for detailed market intelligence report for that stock. to view watchlist. Click on any ticker or stock name for detailed market intelligence report for that stock. |
12Stocks.com Performance of Stocks in Biotech Sector
| Ticker | Stock Name | Watchlist | Category | Recent Price | Market Intelligence Score | Change % | YTD Change% |
| KURA | Kura Oncology |   | Biotechnology | 21.01 | 77 | 1.84% | 46.11% |
| GHRS | GH Research | | Biotechnology | 11.72 | 75 | 1.91% | 113.87% |
| NBIX | Neurocrine | | Biotechnology | 141.71 | 75 | 0.71% | 7.55% |
| STOK | Stoke | | Biotechnology | 11.87 | 75 | -1.25% | 125.67% |
| AGEN | Agenus | | Biotechnology | 12.95 | 75 | -0.92% | NA |
| TERN | Terns | | Biotechnology | 5.79 | 74 | 7.42% | -12.41% |
| MOLN | Molecular Partners | | Biotechnology | 4.03 | 74 | 7.04% | 0.37% |
| ADPT | Adaptive nologies | | Biotechnology | 3.22 | 74 | 6.98% | -34.29% |
| ARDX | Ardelyx | | Biotechnology | 9.15 | 74 | 4.93% | 47.58% |
| OBIO | Orchestra BioMed | | Biotechnology | 5.18 | 74 | 4.65% | -43.14% |
| MLYS | Mineralys | | Biotechnology | 13.74 | 74 | 4.45% | 57.57% |
| LYEL | Lyell Immunopharma | | Biotechnology | 2.53 | 74 | 3.90% | 28.75% |
| RVNC | Revance | | Biotechnology | 4.10 | 74 | 3.80% | -53.36% |
| PRTA | Prothena | | Biotechnology | 23.74 | 74 | 3.53% | -34.67% |
| ERAS | Erasca | | Biotechnology | 2.21 | 74 | 3.52% | 3.52% |
| SNDX | Syndax | | Biotechnology | 22.50 | 74 | 2.04% | 4.12% |
| BCRX | BioCryst | | Biotechnology | 5.27 | 74 | 18.43% | -12.02% |
| AKRO | Akero | | Biotechnology | 22.11 | 74 | 12.46% | -5.31% |
| NVCT | Nuvectis Pharma | | Biotechnology | 7.62 | 74 | 10.20% | -7.92% |
| SCPH | sc | | Biotechnology | 4.75 | 74 | 1.93% | -24.24% |
| RCUS | Arcus | | Biotechnology | 15.95 | 74 | 1.59% | -16.49% |
| MORF | Morphic Holding | | Biotechnology | 30.35 | 74 | 1.51% | 5.09% |
| TARS | Tarsus | | Biotechnology | 37.26 | 74 | 0.99% | 83.70% |
| REPL | Replimune | | Biotechnology | 7.01 | 74 | 0.86% | -16.84% |
| INCY | yte | | Biotechnology | 54.08 | 74 | 0.60% | -13.87% |
| To view more stocks, click on Next / Previous arrows or select different range: 0 - 25 , 25 - 50 , 50 - 75 , 75 - 100 , 100 - 125 , 125 - 150 , 150 - 175 , 175 - 200 , 200 - 225 , 225 - 250 , 250 - 275 , 275 - 300 , 300 - 325 , 325 - 350 , 350 - 375 , 375 - 400 | ||
 | Click To Change The Sort Order: By Market Cap or Company Size Performance: Year-to-date, Week and Day |  |
|
Get the most comprehensive stock market coverage daily at 12Stocks.com ➞ Best Stocks Today ➞ Best Stocks Weekly ➞ Best Stocks Year-to-Date ➞ Best Stocks Trends ➞  Best Stocks Today 12Stocks.com Best Nasdaq Stocks ➞ Best S&P 500 Stocks ➞ Best Tech Stocks ➞ Best Biotech Stocks ➞ |
| Detailed Overview of Biotech Stocks |
| Biotech Technical Overview, Leaders & Laggards, Top Biotech ETF Funds & Detailed Biotech Stocks List, Charts, Trends & More |
| Biotech Sector: Technical Analysis, Trends & YTD Performance | |
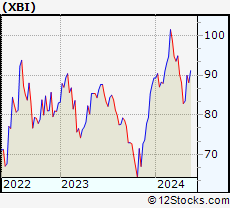
| Biotech sector, as represented by XBI, an exchange-traded fund [ETF] that holds basket of Biotech stocks (e.g, Amgen, Celgene) is up by 1.44% and is currently underperforming the overall market by -6.58% year-to-date. Below is a quick view of Technical charts and trends: | |
 XBI Weekly Chart |
|
| Long Term Trend: Not Good | |
| Medium Term Trend: Very Good | |
 XBI Daily Chart |
|
| Short Term Trend: Very Good | |
| Overall Trend Score: 55 | |
| YTD Performance: 1.44% | |
| **Trend Scores & Views Are Only For Educational Purposes And Not For Investing | |
| 12Stocks.com: Top Performing Biotech Sector Stocks | ||||||||||||||||||||||||||||||||||||||||||||||||
 The top performing Biotech sector stocks year to date are
Now, more recently, over last week, the top performing Biotech sector stocks on the move are


|
||||||||||||||||||||||||||||||||||||||||||||||||
| 12Stocks.com: Investing in Biotech Sector using Exchange Traded Funds | |
|
The following table shows list of key exchange traded funds (ETF) that
help investors track Biotech Index. For detailed view, check out our ETF Funds section of our website. Quick View: Move mouse or cursor over ETF symbol (ticker) to view short-term Technical chart and over ETF name to view long term chart. Click on ticker or stock name for detailed view. Click on to add stock symbol to your watchlist and to view watchlist. |
12Stocks.com List of ETFs that track Biotech Index
| Ticker | ETF Name | Watchlist | Recent Price | Market Intelligence Score | Change % | Week % | Year-to-date % |
| LABD | Biotech Bear 3X | | 8.14 | 43 | -1.69 | -1.69 | -16% |
| XBI | Biotech | | 90.58 | 55 | 0.67 | 0.67 | 1.44% |
| IBB | Biotechnology | | 133.02 | 62 | 0.05 | 0.05 | -2.08% |
| LABU | Biotech Bull 3X | | 110.61 | 50 | 1.49 | 1.49 | -9.31% |
| IHF | Healthcare Providers | | 51.97 | 50 | 0.54 | 0.54 | -1.03% |
| IYH | Healthcare | | 59.53 | 57 | 0.46 | 0.46 | 3.99% |
| IXJ | Global Healthcare | | 90.05 | 57 | 0.43 | 0.43 | 3.84% |
| BIB | Biotechnology | | 55.37 | 60 | -0.47 | -0.47 | -2.94% |
| FBT | First NYSE | | 148.43 | 57 | 0.16 | 0.16 | -6.09% |
| CURE | Healthcare Bull 3X | | 108.01 | 57 | 1.05 | 1.05 | 6.16% |
| BBC | Bio Biotechnology Clinical | | 27.92 | 64 | 0.11 | 0.11 | 14.18% |
| BBH | Biotech | | 163.79 | 80 | -0.22 | -0.22 | -0.92% |
| PTH | DWA Healthcare Momentum | | 41.92 | 57 | -0.31 | -0.31 | 7.1% |
| PBE | Biotech & Genome | | 63.59 | 57 | -0.81 | -0.81 | -3.42% |
| BBP | Bio Biotechnology Products | | 55.75 | 64 | 0.47 | 0.47 | -4.03% |
| BTEC | Principal Healthcare Innovators | | 37.06 | 67 | 0.24 | 0.24 | 2.01% |
| BIS | Short Biotech | | 18.22 | 43 | 1.28 | 1.28 | 0.83% |
| 12Stocks.com: Charts, Trends, Fundamental Data and Performances of Biotech Stocks | |
|
We now take in-depth look at all Biotech stocks including charts, multi-period performances and overall trends (as measured by market intelligence score). One can sort Biotech stocks (click link to choose) by Daily, Weekly and by Year-to-Date performances. Also, one can sort by size of the company or by market capitalization. |
| Select Your Default Chart Type: | |||||
| |||||
| Click on stock symbol or name for detailed view. Click on to add stock symbol to your watchlist and to view watchlist. Quick View: Move mouse or cursor over "Daily" to quickly view daily Technical stock chart and over "Weekly" to view weekly Technical stock chart. | |||||

 | KURA Kura Oncology, Inc. |
| Sector: Health Care | |
| SubSector: Biotechnology | |
| MarketCap: 401.885 Millions | |
| Recent Price: 21.01 Market Intelligence Score: 77 | |
| Day Percent Change: 1.84% Day Change: 0.38 | |
| Week Change: 1.84% Year-to-date Change: 46.1% | |
| KURA Links: Profile News Message Board | |
| Charts:- Daily , Weekly | |
| Add KURA to Watchlist: View: Get Complete KURA Trend Analysis ➞ | |
 | GHRS GH Research PLC |
| Sector: Health Care | |
| SubSector: Biotechnology | |
| MarketCap: 614 Millions | |
| Recent Price: 11.72 Market Intelligence Score: 75 | |
| Day Percent Change: 1.91% Day Change: 0.22 | |
| Week Change: 1.91% Year-to-date Change: 113.9% | |
| GHRS Links: Profile News Message Board | |
| Charts:- Daily , Weekly | |
| Add GHRS to Watchlist: View: Get Complete GHRS Trend Analysis ➞ | |
 | NBIX Neurocrine Biosciences, Inc. |
| Sector: Health Care | |
| SubSector: Biotechnology | |
| MarketCap: 7897.85 Millions | |
| Recent Price: 141.71 Market Intelligence Score: 75 | |
| Day Percent Change: 0.71% Day Change: 1.00 | |
| Week Change: 0.71% Year-to-date Change: 7.6% | |
| NBIX Links: Profile News Message Board | |
| Charts:- Daily , Weekly | |
| Add NBIX to Watchlist: View: Get Complete NBIX Trend Analysis ➞ | |
 | STOK Stoke Therapeutics, Inc. |
| Sector: Health Care | |
| SubSector: Biotechnology | |
| MarketCap: 772.485 Millions | |
| Recent Price: 11.87 Market Intelligence Score: 75 | |
| Day Percent Change: -1.25% Day Change: -0.15 | |
| Week Change: -1.25% Year-to-date Change: 125.7% | |
| STOK Links: Profile News Message Board | |
| Charts:- Daily , Weekly | |
| Add STOK to Watchlist: View: Get Complete STOK Trend Analysis ➞ | |
 | AGEN Agenus Inc. |
| Sector: Health Care | |
| SubSector: Biotechnology | |
| MarketCap: 274.885 Millions | |
| Recent Price: 12.95 Market Intelligence Score: 75 | |
| Day Percent Change: -0.92% Day Change: -0.12 | |
| Week Change: -0.92% Year-to-date Change: 1,464.2% | |
| AGEN Links: Profile News Message Board | |
| Charts:- Daily , Weekly | |
| Add AGEN to Watchlist: View: Get Complete AGEN Trend Analysis ➞ | |
 | TERN Terns Pharmaceuticals, Inc. |
| Sector: Health Care | |
| SubSector: Biotechnology | |
| MarketCap: 611 Millions | |
| Recent Price: 5.79 Market Intelligence Score: 74 | |
| Day Percent Change: 7.42% Day Change: 0.40 | |
| Week Change: 7.42% Year-to-date Change: -12.4% | |
| TERN Links: Profile News Message Board | |
| Charts:- Daily , Weekly | |
| Add TERN to Watchlist: View: Get Complete TERN Trend Analysis ➞ | |
 | MOLN Molecular Partners AG |
| Sector: Health Care | |
| SubSector: Biotechnology | |
| MarketCap: 216 Millions | |
| Recent Price: 4.03 Market Intelligence Score: 74 | |
| Day Percent Change: 7.04% Day Change: 0.27 | |
| Week Change: 7.04% Year-to-date Change: 0.4% | |
| MOLN Links: Profile News Message Board | |
| Charts:- Daily , Weekly | |
| Add MOLN to Watchlist: View: Get Complete MOLN Trend Analysis ➞ | |
 | ADPT Adaptive Biotechnologies Corporation |
| Sector: Health Care | |
| SubSector: Biotechnology | |
| MarketCap: 3525.75 Millions | |
| Recent Price: 3.22 Market Intelligence Score: 74 | |
| Day Percent Change: 6.98% Day Change: 0.21 | |
| Week Change: 6.98% Year-to-date Change: -34.3% | |
| ADPT Links: Profile News Message Board | |
| Charts:- Daily , Weekly | |
| Add ADPT to Watchlist: View: Get Complete ADPT Trend Analysis ➞ | |
 | ARDX Ardelyx, Inc. |
| Sector: Health Care | |
| SubSector: Biotechnology | |
| MarketCap: 541.985 Millions | |
| Recent Price: 9.15 Market Intelligence Score: 74 | |
| Day Percent Change: 4.93% Day Change: 0.43 | |
| Week Change: 4.93% Year-to-date Change: 47.6% | |
| ARDX Links: Profile News Message Board | |
| Charts:- Daily , Weekly | |
| Add ARDX to Watchlist: View: Get Complete ARDX Trend Analysis ➞ | |
 | OBIO Orchestra BioMed Holdings, Inc. |
| Sector: Health Care | |
| SubSector: Biotechnology | |
| MarketCap: 271 Millions | |
| Recent Price: 5.18 Market Intelligence Score: 74 | |
| Day Percent Change: 4.65% Day Change: 0.23 | |
| Week Change: 4.65% Year-to-date Change: -43.1% | |
| OBIO Links: Profile News Message Board | |
| Charts:- Daily , Weekly | |
| Add OBIO to Watchlist: View: Get Complete OBIO Trend Analysis ➞ | |
 | MLYS Mineralys Therapeutics, Inc. |
| Sector: Health Care | |
| SubSector: Biotechnology | |
| MarketCap: 719 Millions | |
| Recent Price: 13.74 Market Intelligence Score: 74 | |
| Day Percent Change: 4.45% Day Change: 0.59 | |
| Week Change: 4.45% Year-to-date Change: 57.6% | |
| MLYS Links: Profile News Message Board | |
| Charts:- Daily , Weekly | |
| Add MLYS to Watchlist: View: Get Complete MLYS Trend Analysis ➞ | |
 | LYEL Lyell Immunopharma, Inc. |
| Sector: Health Care | |
| SubSector: Biotechnology | |
| MarketCap: 809 Millions | |
| Recent Price: 2.53 Market Intelligence Score: 74 | |
| Day Percent Change: 3.90% Day Change: 0.09 | |
| Week Change: 3.9% Year-to-date Change: 28.8% | |
| LYEL Links: Profile News Message Board | |
| Charts:- Daily , Weekly | |
| Add LYEL to Watchlist: View: Get Complete LYEL Trend Analysis ➞ | |
 | RVNC Revance Therapeutics, Inc. |
| Sector: Health Care | |
| SubSector: Biotechnology | |
| MarketCap: 854.185 Millions | |
| Recent Price: 4.10 Market Intelligence Score: 74 | |
| Day Percent Change: 3.80% Day Change: 0.15 | |
| Week Change: 3.8% Year-to-date Change: -53.4% | |
| RVNC Links: Profile News Message Board | |
| Charts:- Daily , Weekly | |
| Add RVNC to Watchlist: View: Get Complete RVNC Trend Analysis ➞ | |
 | PRTA Prothena Corporation plc |
| Sector: Health Care | |
| SubSector: Biotechnology | |
| MarketCap: 357.985 Millions | |
| Recent Price: 23.74 Market Intelligence Score: 74 | |
| Day Percent Change: 3.53% Day Change: 0.81 | |
| Week Change: 3.53% Year-to-date Change: -34.7% | |
| PRTA Links: Profile News Message Board | |
| Charts:- Daily , Weekly | |
| Add PRTA to Watchlist: View: Get Complete PRTA Trend Analysis ➞ | |
 | ERAS Erasca, Inc. |
| Sector: Health Care | |
| SubSector: Biotechnology | |
| MarketCap: 419 Millions | |
| Recent Price: 2.21 Market Intelligence Score: 74 | |
| Day Percent Change: 3.52% Day Change: 0.08 | |
| Week Change: 3.52% Year-to-date Change: 3.5% | |
| ERAS Links: Profile News Message Board | |
| Charts:- Daily , Weekly | |
| Add ERAS to Watchlist: View: Get Complete ERAS Trend Analysis ➞ | |
 | SNDX Syndax Pharmaceuticals, Inc. |
| Sector: Health Care | |
| SubSector: Biotechnology | |
| MarketCap: 365.985 Millions | |
| Recent Price: 22.50 Market Intelligence Score: 74 | |
| Day Percent Change: 2.04% Day Change: 0.45 | |
| Week Change: 2.04% Year-to-date Change: 4.1% | |
| SNDX Links: Profile News Message Board | |
| Charts:- Daily , Weekly | |
| Add SNDX to Watchlist: View: Get Complete SNDX Trend Analysis ➞ | |
 | BCRX BioCryst Pharmaceuticals, Inc. |
| Sector: Health Care | |
| SubSector: Biotechnology | |
| MarketCap: 369.385 Millions | |
| Recent Price: 5.27 Market Intelligence Score: 74 | |
| Day Percent Change: 18.43% Day Change: 0.82 | |
| Week Change: 18.43% Year-to-date Change: -12.0% | |
| BCRX Links: Profile News Message Board | |
| Charts:- Daily , Weekly | |
| Add BCRX to Watchlist: View: Get Complete BCRX Trend Analysis ➞ | |
 | AKRO Akero Therapeutics, Inc. |
| Sector: Health Care | |
| SubSector: Biotechnology | |
| MarketCap: 675.085 Millions | |
| Recent Price: 22.11 Market Intelligence Score: 74 | |
| Day Percent Change: 12.46% Day Change: 2.45 | |
| Week Change: 12.46% Year-to-date Change: -5.3% | |
| AKRO Links: Profile News Message Board | |
| Charts:- Daily , Weekly | |
| Add AKRO to Watchlist: View: Get Complete AKRO Trend Analysis ➞ | |
 | NVCT Nuvectis Pharma, Inc. |
| Sector: Health Care | |
| SubSector: Biotechnology | |
| MarketCap: 258 Millions | |
| Recent Price: 7.62 Market Intelligence Score: 74 | |
| Day Percent Change: 10.20% Day Change: 0.71 | |
| Week Change: 10.2% Year-to-date Change: -7.9% | |
| NVCT Links: Profile News Message Board | |
| Charts:- Daily , Weekly | |
| Add NVCT to Watchlist: View: Get Complete NVCT Trend Analysis ➞ | |
 | SCPH scPharmaceuticals Inc. |
| Sector: Health Care | |
| SubSector: Biotechnology | |
| MarketCap: 136.185 Millions | |
| Recent Price: 4.75 Market Intelligence Score: 74 | |
| Day Percent Change: 1.93% Day Change: 0.09 | |
| Week Change: 1.93% Year-to-date Change: -24.2% | |
| SCPH Links: Profile News Message Board | |
| Charts:- Daily , Weekly | |
| Add SCPH to Watchlist: View: Get Complete SCPH Trend Analysis ➞ | |
 | RCUS Arcus Biosciences, Inc. |
| Sector: Health Care | |
| SubSector: Biotechnology | |
| MarketCap: 539.285 Millions | |
| Recent Price: 15.95 Market Intelligence Score: 74 | |
| Day Percent Change: 1.59% Day Change: 0.25 | |
| Week Change: 1.59% Year-to-date Change: -16.5% | |
| RCUS Links: Profile News Message Board | |
| Charts:- Daily , Weekly | |
| Add RCUS to Watchlist: View: Get Complete RCUS Trend Analysis ➞ | |
 | MORF Morphic Holding, Inc. |
| Sector: Health Care | |
| SubSector: Biotechnology | |
| MarketCap: 484.885 Millions | |
| Recent Price: 30.35 Market Intelligence Score: 74 | |
| Day Percent Change: 1.51% Day Change: 0.45 | |
| Week Change: 1.51% Year-to-date Change: 5.1% | |
| MORF Links: Profile News Message Board | |
| Charts:- Daily , Weekly | |
| Add MORF to Watchlist: View: Get Complete MORF Trend Analysis ➞ | |
 | TARS Tarsus Pharmaceuticals, Inc. |
| Sector: Health Care | |
| SubSector: Biotechnology | |
| MarketCap: 74487 Millions | |
| Recent Price: 37.26 Market Intelligence Score: 74 | |
| Day Percent Change: 0.99% Day Change: 0.37 | |
| Week Change: 0.99% Year-to-date Change: 83.7% | |
| TARS Links: Profile News Message Board | |
| Charts:- Daily , Weekly | |
| Add TARS to Watchlist: View: Get Complete TARS Trend Analysis ➞ | |
 | REPL Replimune Group, Inc. |
| Sector: Health Care | |
| SubSector: Biotechnology | |
| MarketCap: 367.885 Millions | |
| Recent Price: 7.01 Market Intelligence Score: 74 | |
| Day Percent Change: 0.86% Day Change: 0.06 | |
| Week Change: 0.86% Year-to-date Change: -16.8% | |
| REPL Links: Profile News Message Board | |
| Charts:- Daily , Weekly | |
| Add REPL to Watchlist: View: Get Complete REPL Trend Analysis ➞ | |
 | INCY Incyte Corporation |
| Sector: Health Care | |
| SubSector: Biotechnology | |
| MarketCap: 15343.2 Millions | |
| Recent Price: 54.08 Market Intelligence Score: 74 | |
| Day Percent Change: 0.60% Day Change: 0.32 | |
| Week Change: 0.6% Year-to-date Change: -13.9% | |
| INCY Links: Profile News Message Board | |
| Charts:- Daily , Weekly | |
| Add INCY to Watchlist: View: Get Complete INCY Trend Analysis ➞ | |
| To view more stocks, click on Next / Previous arrows or select different range: 0 - 25 , 25 - 50 , 50 - 75 , 75 - 100 , 100 - 125 , 125 - 150 , 150 - 175 , 175 - 200 , 200 - 225 , 225 - 250 , 250 - 275 , 275 - 300 , 300 - 325 , 325 - 350 , 350 - 375 , 375 - 400 | ||
| Click To Change The Sort Order: By Market Cap or Company Size Performance: Year-to-date, Week and Day | |
| Select Chart Type: | ||
|
Best Stocks Today 12Stocks.com |
© 2024 12Stocks.com Terms & Conditions Privacy Contact Us
All Information Provided Only For Education And Not To Be Used For Investing or Trading. See Terms & Conditions


One More Thing ... Get Best Stocks Delivered Daily!
Never Ever Miss A Move With Our Top Ten Stocks Lists
Find Best Stocks In Any Market - Bull or Bear Market
Take A Peek At Our Top Ten Stocks Lists: Daily, Weekly, Year-to-Date & Top Trends
Find Best Stocks In Any Market - Bull or Bear Market
Take A Peek At Our Top Ten Stocks Lists: Daily, Weekly, Year-to-Date & Top Trends
Biotech Stocks With Best Up Trends [0-bearish to 100-bullish]: Lineage Cell[100], Lantern Pharma[100], X [100], PMV [100], Phathom [100], Rani [100], Mesoblast [100], Black Diamond[100], iTeos [100], Halozyme [100], Milestone [100]
Best Biotech Stocks Year-to-Date:
Pieris [5976.92%], Precision [2804.11%], Avenue [2716.77%], Inovio [2229.41%], Assembly [1466.88%], Agenus [1464.2%], Adverum nologies[1316.05%], NuCana [1228.6%], Affimed N.V[773.6%], Mesoblast [628.18%], Corbus [542.72%] Best Biotech Stocks This Week:
Lineage Cell[22.64%], BioCryst [18.43%], Lantern Pharma[15.78%], Akero [12.46%], Cellectis S.A[12.04%], bluebird bio[11.14%], Cerus [10.49%], X [10.48%], Nuvectis Pharma[10.2%], Heron [8.81%], Akebia [8.76%] Best Biotech Stocks Daily:
Lineage Cell[22.64%], BioCryst [18.43%], Lantern Pharma[15.78%], Akero [12.46%], Cellectis S.A[12.04%], bluebird bio[11.14%], Cerus [10.49%], X [10.48%], Nuvectis Pharma[10.20%], Heron [8.81%], Akebia [8.76%]