
 Login Sign Up


| |||||
 |  | ||||

| 12Stocks.com Market Intelligence |
Best Biotech Stocks
|
|
| Quick Read: Best Biotech Stocks List By Performances & Trends: Daily, Weekly, Year-to-Date, Market Cap (Size) & Technical Trends | |||
| Best Biotech Stocks Views: Quick Browse View, Summary & Slide Show View | |||
| 12Stocks.com Biotech Stocks Performances & Trends Daily | |||||||||
|
|  The overall market intelligence score is 10 (0-bearish to 100-bullish) which puts Biotech sector in short term bearish trend. The market intelligence score from previous trading session is 0 and hence an improvement of trend.
| ||||||||
Here are the market intelligence trend scores of the most requested Biotech stocks at 12Stocks.com (click stock name for detailed review):
|


| 12Stocks.com: Investing in Biotech sector with Stocks | |
|
The following table helps investors and traders sort through current performance and trends (as measured by market intelligence score) of various
stocks in the Biotech sector. Quick View: Move mouse or cursor over stock symbol (ticker) to view short-term Technical chart and over stock name to view long term chart. Click on  to add stock symbol to your watchlist and to add stock symbol to your watchlist and  to view watchlist. Click on any ticker or stock name for detailed market intelligence report for that stock. to view watchlist. Click on any ticker or stock name for detailed market intelligence report for that stock. |
12Stocks.com Performance of Stocks in Biotech Sector
| Ticker | Stock Name | Watchlist | Category | Recent Price | Market Intelligence Score | Change % | Weekly Change% |
| NCNA | NuCana |   | Biotechnology | 3.81 | 73 | -5.93% | 1,601.65% |
| HUMA | Humacyte | | Biotechnology | 3.70 | 95 | 14.02% | 28.47% |
| VNDA | Vanda | | Biotechnology | 5.11 | 100 | 2.82% | 24.03% |
| ALXO | ALX Oncology | | Biotechnology | 15.96 | 95 | 1.53% | 22.49% |
| RANI | Rani | | Biotechnology | 6.30 | 75 | 3.11% | 16.67% |
| PROK | ProKidney | | Biotechnology | 2.04 | 68 | -11.69% | 16.57% |
| GRTX | Galera | | Biotechnology | 0.18 | 47 | -0.92% | 15.36% |
| ADCT | ADC | | Biotechnology | 4.87 | 76 | 2.31% | 10.93% |
| ITCI | Intra-Cellular Therapies | | Biotechnology | 72.37 | 68 | 0.51% | 9.85% |
| VBIV | VBI Vaccines | | Biotechnology | 0.63 | 62 | 0.64% | 9.26% |
| DAWN | Day One | | Biotechnology | 14.96 | 30 | -0.13% | 8.64% |
| AVDL | Avadel | | Biotechnology | 17.33 | 68 | -0.29% | 8.38% |
| SLGL | Sol-Gel Technologies | | Biotechnology | 0.90 | 32 | 0.00% | 7.14% |
| RDHL | RedHill Biopharma | | Biotechnology | 0.45 | 42 | 7.41% | 6.25% |
| RFL | Rafael | | Biotechnology | 1.76 | 54 | 2.92% | 6.02% |
| GLTO | Galecto | | Biotechnology | 0.72 | 63 | 1.74% | 5.73% |
| YMAB | Y-mAbs | | Biotechnology | 15.15 | 56 | 1.00% | 5.43% |
| BCYC | Bicycle | | Biotechnology | 23.41 | 68 | -4.49% | 4.98% |
| STTK | Shattuck Labs | | Biotechnology | 9.79 | 83 | -3.17% | 4.82% |
| ADMA | ADMA Biologics | | Biotechnology | 6.27 | 68 | 1.13% | 4.15% |
| ZURA | Zura Bio | | Biotechnology | 3.48 | 81 | -5.30% | 3.72% |
| ANIK | Anika | | Biotechnology | 25.84 | 83 | 1.61% | 3.36% |
| SRRK | Scholar Rock | | Biotechnology | 13.85 | 30 | -0.72% | 2.97% |
| PSNL | Personalis | | Biotechnology | 1.31 | 37 | 6.50% | 2.75% |
| UTHR | United | | Biotechnology | 237.93 | 93 | 0.42% | 2.30% |
| To view more stocks, click on Next / Previous arrows or select different range: 0 - 25 , 25 - 50 , 50 - 75 , 75 - 100 , 100 - 125 , 125 - 150 , 150 - 175 , 175 - 200 , 200 - 225 , 225 - 250 , 250 - 275 , 275 - 300 , 300 - 325 , 325 - 350 , 350 - 375 , 375 - 400 | ||
 | Click To Change The Sort Order: By Market Cap or Company Size Performance: Year-to-date, Week and Day |  |
|
Get the most comprehensive stock market coverage daily at 12Stocks.com ➞ Best Stocks Today ➞ Best Stocks Weekly ➞ Best Stocks Year-to-Date ➞ Best Stocks Trends ➞  Best Stocks Today 12Stocks.com Best Nasdaq Stocks ➞ Best S&P 500 Stocks ➞ Best Tech Stocks ➞ Best Biotech Stocks ➞ |
| Detailed Overview of Biotech Stocks |
| Biotech Technical Overview, Leaders & Laggards, Top Biotech ETF Funds & Detailed Biotech Stocks List, Charts, Trends & More |
| Biotech Sector: Technical Analysis, Trends & YTD Performance | |
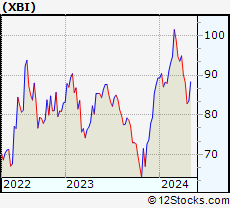
| Biotech sector, as represented by XBI, an exchange-traded fund [ETF] that holds basket of Biotech stocks (e.g, Amgen, Celgene) is down by -7.23% and is currently underperforming the overall market by -10.61% year-to-date. Below is a quick view of Technical charts and trends: | |
 XBI Weekly Chart |
|
| Long Term Trend: Not Good | |
| Medium Term Trend: Not Good | |
 XBI Daily Chart |
|
| Short Term Trend: Very Good | |
| Overall Trend Score: 10 | |
| YTD Performance: -7.23% | |
| **Trend Scores & Views Are Only For Educational Purposes And Not For Investing | |
| 12Stocks.com: Top Performing Biotech Sector Stocks | ||||||||||||||||||||||||||||||||||||||||||||||||
 The top performing Biotech sector stocks year to date are
Now, more recently, over last week, the top performing Biotech sector stocks on the move are


|
||||||||||||||||||||||||||||||||||||||||||||||||
| 12Stocks.com: Investing in Biotech Sector using Exchange Traded Funds | |
|
The following table shows list of key exchange traded funds (ETF) that
help investors track Biotech Index. For detailed view, check out our ETF Funds section of our website. Quick View: Move mouse or cursor over ETF symbol (ticker) to view short-term Technical chart and over ETF name to view long term chart. Click on ticker or stock name for detailed view. Click on to add stock symbol to your watchlist and to view watchlist. |
12Stocks.com List of ETFs that track Biotech Index
| Ticker | ETF Name | Watchlist | Recent Price | Market Intelligence Score | Change % | Week % | Year-to-date % |
| LABD | Biotech Bear 3X | | 10.80 | 80 | 2.66 | 20.27 | 11.46% |
| XBI | Biotech | | 82.83 | 10 | -0.78 | -6.04 | -7.23% |
| LABU | Biotech Bull 3X | | 86.05 | 10 | -2.26 | -17.54 | -29.45% |
| IBB | Biotechnology | | 124.72 | 10 | 0.06 | -3.75 | -8.19% |
| IYH | Healthcare | | 58.16 | 10 | 0.19 | -0.41 | 1.59% |
| IXJ | Global Healthcare | | 87.75 | 25 | 0.39 | -0.26 | 1.19% |
| IHF | Healthcare Providers | | 52.21 | 62 | 1.29 | 3.3 | -0.57% |
| CURE | Healthcare Bull 3X | | 103.33 | 25 | 1.09 | -0.06 | 1.56% |
| FBT | First NYSE | | 141.68 | 10 | 0.11 | -3.83 | -10.36% |
| BIB | Biotechnology | | 48.11 | 10 | 0.35 | -6.38 | -15.67% |
| BIS | Short Biotech | | 20.96 | 95 | 0.45 | 6.94 | 15.99% |
| PTH | DWA Healthcare Momentum | | 39.53 | 23 | -0.10 | -5.5 | 1% |
| BBH | Biotech | | 152.18 | 10 | -0.11 | -3.43 | -7.94% |
| PBE | Biotech & Genome | | 59.85 | 10 | 0.39 | -2.29 | -9.1% |
| BBC | Bio Biotechnology Clinical | | 24.71 | 23 | -3.02 | -8.9 | 1.05% |
| BBP | Bio Biotechnology Products | | 50.43 | 0 | -0.34 | -5.02 | -13.19% |
| BTEC | Principal Healthcare Innovators | | 33.86 | 0 | -0.67 | -5.92 | -6.8% |
| 12Stocks.com: Charts, Trends, Fundamental Data and Performances of Biotech Stocks | |
|
We now take in-depth look at all Biotech stocks including charts, multi-period performances and overall trends (as measured by market intelligence score). One can sort Biotech stocks (click link to choose) by Daily, Weekly and by Year-to-Date performances. Also, one can sort by size of the company or by market capitalization. |
| Select Your Default Chart Type: | |||||
| |||||
| Click on stock symbol or name for detailed view. Click on to add stock symbol to your watchlist and to view watchlist. Quick View: Move mouse or cursor over "Daily" to quickly view daily Technical stock chart and over "Weekly" to view weekly Technical stock chart. | |||||

 | NCNA NuCana plc |
| Sector: Health Care | |
| SubSector: Biotechnology | |
| MarketCap: 185.785 Millions | |
| Recent Price: 3.81 Market Intelligence Score: 73 | |
| Day Percent Change: -5.93% Day Change: -0.24 | |
| Week Change: 1601.65% Year-to-date Change: 1,188.0% | |
| NCNA Links: Profile News Message Board | |
| Charts:- Daily , Weekly | |
| Add NCNA to Watchlist: View: Get Complete NCNA Trend Analysis ➞ | |
 | HUMA Humacyte, Inc. |
| Sector: Health Care | |
| SubSector: Biotechnology | |
| MarketCap: 297 Millions | |
| Recent Price: 3.70 Market Intelligence Score: 95 | |
| Day Percent Change: 14.02% Day Change: 0.46 | |
| Week Change: 28.47% Year-to-date Change: 30.3% | |
| HUMA Links: Profile News Message Board | |
| Charts:- Daily , Weekly | |
| Add HUMA to Watchlist: View: Get Complete HUMA Trend Analysis ➞ | |
 | VNDA Vanda Pharmaceuticals Inc. |
| Sector: Health Care | |
| SubSector: Biotechnology | |
| MarketCap: 464.585 Millions | |
| Recent Price: 5.11 Market Intelligence Score: 100 | |
| Day Percent Change: 2.82% Day Change: 0.14 | |
| Week Change: 24.03% Year-to-date Change: 21.1% | |
| VNDA Links: Profile News Message Board | |
| Charts:- Daily , Weekly | |
| Add VNDA to Watchlist: View: Get Complete VNDA Trend Analysis ➞ | |
 | ALXO ALX Oncology Holdings Inc. |
| Sector: Health Care | |
| SubSector: Biotechnology | |
| MarketCap: 41787 Millions | |
| Recent Price: 15.96 Market Intelligence Score: 95 | |
| Day Percent Change: 1.53% Day Change: 0.24 | |
| Week Change: 22.49% Year-to-date Change: 7.3% | |
| ALXO Links: Profile News Message Board | |
| Charts:- Daily , Weekly | |
| Add ALXO to Watchlist: View: Get Complete ALXO Trend Analysis ➞ | |
 | RANI Rani Therapeutics Holdings, Inc. |
| Sector: Health Care | |
| SubSector: Biotechnology | |
| MarketCap: 202 Millions | |
| Recent Price: 6.30 Market Intelligence Score: 75 | |
| Day Percent Change: 3.11% Day Change: 0.19 | |
| Week Change: 16.67% Year-to-date Change: 90.9% | |
| RANI Links: Profile News Message Board | |
| Charts:- Daily , Weekly | |
| Add RANI to Watchlist: View: Get Complete RANI Trend Analysis ➞ | |
 | PROK ProKidney Corp. |
| Sector: Health Care | |
| SubSector: Biotechnology | |
| MarketCap: 2470 Millions | |
| Recent Price: 2.04 Market Intelligence Score: 68 | |
| Day Percent Change: -11.69% Day Change: -0.27 | |
| Week Change: 16.57% Year-to-date Change: 16.9% | |
| PROK Links: Profile News Message Board | |
| Charts:- Daily , Weekly | |
| Add PROK to Watchlist: View: Get Complete PROK Trend Analysis ➞ | |
 | GRTX Galera Therapeutics, Inc. |
| Sector: Health Care | |
| SubSector: Biotechnology | |
| MarketCap: 277.585 Millions | |
| Recent Price: 0.18 Market Intelligence Score: 47 | |
| Day Percent Change: -0.92% Day Change: 0.00 | |
| Week Change: 15.36% Year-to-date Change: 26.1% | |
| GRTX Links: Profile News Message Board | |
| Charts:- Daily , Weekly | |
| Add GRTX to Watchlist: View: Get Complete GRTX Trend Analysis ➞ | |
 | ADCT ADC Therapeutics SA |
| Sector: Health Care | |
| SubSector: Biotechnology | |
| MarketCap: 26087 Millions | |
| Recent Price: 4.87 Market Intelligence Score: 76 | |
| Day Percent Change: 2.31% Day Change: 0.11 | |
| Week Change: 10.93% Year-to-date Change: 193.4% | |
| ADCT Links: Profile News Message Board | |
| Charts:- Daily , Weekly | |
| Add ADCT to Watchlist: View: Get Complete ADCT Trend Analysis ➞ | |
 | ITCI Intra-Cellular Therapies, Inc. |
| Sector: Health Care | |
| SubSector: Biotechnology | |
| MarketCap: 991.885 Millions | |
| Recent Price: 72.37 Market Intelligence Score: 68 | |
| Day Percent Change: 0.51% Day Change: 0.37 | |
| Week Change: 9.85% Year-to-date Change: 1.1% | |
| ITCI Links: Profile News Message Board | |
| Charts:- Daily , Weekly | |
| Add ITCI to Watchlist: View: Get Complete ITCI Trend Analysis ➞ | |
 | VBIV VBI Vaccines Inc. |
| Sector: Health Care | |
| SubSector: Biotechnology | |
| MarketCap: 139.785 Millions | |
| Recent Price: 0.63 Market Intelligence Score: 62 | |
| Day Percent Change: 0.64% Day Change: 0.00 | |
| Week Change: 9.26% Year-to-date Change: 7.9% | |
| VBIV Links: Profile News Message Board | |
| Charts:- Daily , Weekly | |
| Add VBIV to Watchlist: View: Get Complete VBIV Trend Analysis ➞ | |
 | DAWN Day One Biopharmaceuticals, Inc. |
| Sector: Health Care | |
| SubSector: Biotechnology | |
| MarketCap: 1040 Millions | |
| Recent Price: 14.96 Market Intelligence Score: 30 | |
| Day Percent Change: -0.13% Day Change: -0.02 | |
| Week Change: 8.64% Year-to-date Change: 1.8% | |
| DAWN Links: Profile News Message Board | |
| Charts:- Daily , Weekly | |
| Add DAWN to Watchlist: View: Get Complete DAWN Trend Analysis ➞ | |
 | AVDL Avadel Pharmaceuticals plc |
| Sector: Health Care | |
| SubSector: Biotechnology | |
| MarketCap: 354.485 Millions | |
| Recent Price: 17.33 Market Intelligence Score: 68 | |
| Day Percent Change: -0.29% Day Change: -0.05 | |
| Week Change: 8.38% Year-to-date Change: 22.7% | |
| AVDL Links: Profile News Message Board | |
| Charts:- Daily , Weekly | |
| Add AVDL to Watchlist: View: Get Complete AVDL Trend Analysis ➞ | |
 | SLGL Sol-Gel Technologies Ltd. |
| Sector: Health Care | |
| SubSector: Biotechnology | |
| MarketCap: 183.285 Millions | |
| Recent Price: 0.90 Market Intelligence Score: 32 | |
| Day Percent Change: 0.00% Day Change: 0.00 | |
| Week Change: 7.14% Year-to-date Change: -18.5% | |
| SLGL Links: Profile News Message Board | |
| Charts:- Daily , Weekly | |
| Add SLGL to Watchlist: View: Get Complete SLGL Trend Analysis ➞ | |
 | RDHL RedHill Biopharma Ltd. |
| Sector: Health Care | |
| SubSector: Biotechnology | |
| MarketCap: 138.685 Millions | |
| Recent Price: 0.45 Market Intelligence Score: 42 | |
| Day Percent Change: 7.41% Day Change: 0.03 | |
| Week Change: 6.25% Year-to-date Change: -69.0% | |
| RDHL Links: Profile News Message Board | |
| Charts:- Daily , Weekly | |
| Add RDHL to Watchlist: View: Get Complete RDHL Trend Analysis ➞ | |
 | RFL Rafael Holdings, Inc. |
| Sector: Health Care | |
| SubSector: Biotechnology | |
| MarketCap: 203.685 Millions | |
| Recent Price: 1.76 Market Intelligence Score: 54 | |
| Day Percent Change: 2.92% Day Change: 0.05 | |
| Week Change: 6.02% Year-to-date Change: -3.8% | |
| RFL Links: Profile News Message Board | |
| Charts:- Daily , Weekly | |
| Add RFL to Watchlist: View: Get Complete RFL Trend Analysis ➞ | |
 | GLTO Galecto, Inc. |
| Sector: Health Care | |
| SubSector: Biotechnology | |
| MarketCap: 34487 Millions | |
| Recent Price: 0.72 Market Intelligence Score: 63 | |
| Day Percent Change: 1.74% Day Change: 0.01 | |
| Week Change: 5.73% Year-to-date Change: 0.0% | |
| GLTO Links: Profile News Message Board | |
| Charts:- Daily , Weekly | |
| Add GLTO to Watchlist: View: Get Complete GLTO Trend Analysis ➞ | |
 | YMAB Y-mAbs Therapeutics, Inc. |
| Sector: Health Care | |
| SubSector: Biotechnology | |
| MarketCap: 899.585 Millions | |
| Recent Price: 15.15 Market Intelligence Score: 56 | |
| Day Percent Change: 1.00% Day Change: 0.15 | |
| Week Change: 5.43% Year-to-date Change: 122.1% | |
| YMAB Links: Profile News Message Board | |
| Charts:- Daily , Weekly | |
| Add YMAB to Watchlist: View: Get Complete YMAB Trend Analysis ➞ | |
 | BCYC Bicycle Therapeutics plc |
| Sector: Health Care | |
| SubSector: Biotechnology | |
| MarketCap: 214.485 Millions | |
| Recent Price: 23.41 Market Intelligence Score: 68 | |
| Day Percent Change: -4.49% Day Change: -1.10 | |
| Week Change: 4.98% Year-to-date Change: 29.5% | |
| BCYC Links: Profile News Message Board | |
| Charts:- Daily , Weekly | |
| Add BCYC to Watchlist: View: Get Complete BCYC Trend Analysis ➞ | |
 | STTK Shattuck Labs, Inc. |
| Sector: Health Care | |
| SubSector: Biotechnology | |
| MarketCap: 16987 Millions | |
| Recent Price: 9.79 Market Intelligence Score: 83 | |
| Day Percent Change: -3.17% Day Change: -0.32 | |
| Week Change: 4.82% Year-to-date Change: 37.9% | |
| STTK Links: Profile News Message Board | |
| Charts:- Daily , Weekly | |
| Add STTK to Watchlist: View: Get Complete STTK Trend Analysis ➞ | |
 | ADMA ADMA Biologics, Inc. |
| Sector: Health Care | |
| SubSector: Biotechnology | |
| MarketCap: 204.985 Millions | |
| Recent Price: 6.27 Market Intelligence Score: 68 | |
| Day Percent Change: 1.13% Day Change: 0.07 | |
| Week Change: 4.15% Year-to-date Change: 38.7% | |
| ADMA Links: Profile News Message Board | |
| Charts:- Daily , Weekly | |
| Add ADMA to Watchlist: View: Get Complete ADMA Trend Analysis ➞ | |
 | ZURA Zura Bio Limited |
| Sector: Health Care | |
| SubSector: Biotechnology | |
| MarketCap: 242 Millions | |
| Recent Price: 3.48 Market Intelligence Score: 81 | |
| Day Percent Change: -5.30% Day Change: -0.20 | |
| Week Change: 3.72% Year-to-date Change: -25.6% | |
| ZURA Links: Profile News Message Board | |
| Charts:- Daily , Weekly | |
| Add ZURA to Watchlist: View: Get Complete ZURA Trend Analysis ➞ | |
 | ANIK Anika Therapeutics, Inc. |
| Sector: Health Care | |
| SubSector: Biotechnology | |
| MarketCap: 438.385 Millions | |
| Recent Price: 25.84 Market Intelligence Score: 83 | |
| Day Percent Change: 1.61% Day Change: 0.41 | |
| Week Change: 3.36% Year-to-date Change: 14.0% | |
| ANIK Links: Profile News Message Board | |
| Charts:- Daily , Weekly | |
| Add ANIK to Watchlist: View: Get Complete ANIK Trend Analysis ➞ | |
 | SRRK Scholar Rock Holding Corporation |
| Sector: Health Care | |
| SubSector: Biotechnology | |
| MarketCap: 441.385 Millions | |
| Recent Price: 13.85 Market Intelligence Score: 30 | |
| Day Percent Change: -0.72% Day Change: -0.10 | |
| Week Change: 2.97% Year-to-date Change: -26.3% | |
| SRRK Links: Profile News Message Board | |
| Charts:- Daily , Weekly | |
| Add SRRK to Watchlist: View: Get Complete SRRK Trend Analysis ➞ | |
 | PSNL Personalis, Inc. |
| Sector: Health Care | |
| SubSector: Biotechnology | |
| MarketCap: 242.385 Millions | |
| Recent Price: 1.31 Market Intelligence Score: 37 | |
| Day Percent Change: 6.50% Day Change: 0.08 | |
| Week Change: 2.75% Year-to-date Change: -37.6% | |
| PSNL Links: Profile News Message Board | |
| Charts:- Daily , Weekly | |
| Add PSNL to Watchlist: View: Get Complete PSNL Trend Analysis ➞ | |
 | UTHR United Therapeutics Corporation |
| Sector: Health Care | |
| SubSector: Biotechnology | |
| MarketCap: 3980.75 Millions | |
| Recent Price: 237.93 Market Intelligence Score: 93 | |
| Day Percent Change: 0.42% Day Change: 1.00 | |
| Week Change: 2.3% Year-to-date Change: 8.2% | |
| UTHR Links: Profile News Message Board | |
| Charts:- Daily , Weekly | |
| Add UTHR to Watchlist: View: Get Complete UTHR Trend Analysis ➞ | |
| To view more stocks, click on Next / Previous arrows or select different range: 0 - 25 , 25 - 50 , 50 - 75 , 75 - 100 , 100 - 125 , 125 - 150 , 150 - 175 , 175 - 200 , 200 - 225 , 225 - 250 , 250 - 275 , 275 - 300 , 300 - 325 , 325 - 350 , 350 - 375 , 375 - 400 | ||
| Click To Change The Sort Order: By Market Cap or Company Size Performance: Year-to-date, Week and Day | |
| Select Chart Type: | ||
|
Best Stocks Today 12Stocks.com |
© 2024 12Stocks.com Terms & Conditions Privacy Contact Us
All Information Provided Only For Education And Not To Be Used For Investing or Trading. See Terms & Conditions


One More Thing ... Get Best Stocks Delivered Daily!
Never Ever Miss A Move With Our Top Ten Stocks Lists
Find Best Stocks In Any Market - Bull or Bear Market
Take A Peek At Our Top Ten Stocks Lists: Daily, Weekly, Year-to-Date & Top Trends
Find Best Stocks In Any Market - Bull or Bear Market
Take A Peek At Our Top Ten Stocks Lists: Daily, Weekly, Year-to-Date & Top Trends
Biotech Stocks With Best Up Trends [0-bearish to 100-bullish]: Vanda [100], Humacyte [95], ALX Oncology[95], United [93], Mesoblast [88], OPKO Health[88], Reneo [86], XOMA [83], Anika [83], Agios [83], Shattuck Labs[83]
Best Biotech Stocks Year-to-Date:
Precision [2571.23%], Inovio [1798.04%], Assembly [1535.17%], Adverum nologies[1406.38%], NuCana [1188.03%], Affimed N.V[724%], Corbus [549.67%], Agenus [541.38%], Mesoblast [373.64%], Janux [353.14%], Addex [244.17%] Best Biotech Stocks This Week:
NuCana [1601.65%], Humacyte [28.47%], Vanda [24.03%], ALX Oncology[22.49%], Rani [16.67%], ProKidney [16.57%], Galera [15.36%], ADC [10.93%], Intra-Cellular Therapies[9.85%], VBI Vaccines[9.26%], Day One[8.64%] Best Biotech Stocks Daily:
Genelux [14.25%], Humacyte [14.02%], Emergent Bio[9.68%], Adaptimmune [8.72%], BioXcel [8.63%], Corbus [7.42%], RedHill Biopharma[7.41%], bluebird bio[7.03%], ProQR [6.99%], Agenus [6.84%], InflaRx N.V[6.67%]