
 Login Sign Up


| |||||
 |  | ||||

| 12Stocks.com Market Intelligence |
Best Biotech Stocks
|
|
| Quick Read: Best Biotech Stocks List By Performances & Trends: Daily, Weekly, Year-to-Date, Market Cap (Size) & Technical Trends | |||
| Best Biotech Stocks Views: Quick Browse View, Summary & Slide Show View | |||
| 12Stocks.com Biotech Stocks Performances & Trends Daily | |||||||||
|
|  The overall market intelligence score is 49 (0-bearish to 100-bullish) which puts Biotech sector in short term neutral trend. The market intelligence score from previous trading session is 17 and hence an improvement of trend.
| ||||||||
Here are the market intelligence trend scores of the most requested Biotech stocks at 12Stocks.com (click stock name for detailed review):
|


| 12Stocks.com: Investing in Biotech sector with Stocks | |
|
The following table helps investors and traders sort through current performance and trends (as measured by market intelligence score) of various
stocks in the Biotech sector. Quick View: Move mouse or cursor over stock symbol (ticker) to view short-term Technical chart and over stock name to view long term chart. Click on  to add stock symbol to your watchlist and to add stock symbol to your watchlist and  to view watchlist. Click on any ticker or stock name for detailed market intelligence report for that stock. to view watchlist. Click on any ticker or stock name for detailed market intelligence report for that stock. |
12Stocks.com Performance of Stocks in Biotech Sector
| Ticker | Stock Name | Watchlist | Category | Recent Price | Market Intelligence Score | Change % | YTD Change% |
| IMRX | Immuneering |   | Biotechnology | 1.48 | 15 | 0.68% | -80.50% |
| OBIO | Orchestra BioMed | | Biotechnology | 4.39 | 15 | 0.00% | -51.81% |
| MOLN | Molecular Partners | | Biotechnology | 3.70 | 15 | -4.64% | -7.85% |
| AMRN | Amarin | | Biotechnology | 0.88 | 13 | 0.24% | 0.80% |
| ATHA | Athira Pharma | | Biotechnology | 1.97 | 10 | 2.60% | -19.26% |
| OMGA | Omega | | Biotechnology | 2.29 | 10 | 0.88% | -23.92% |
| IMNM | Immunome | | Biotechnology | 13.82 | 10 | 0.66% | 29.28% |
| DRTS | Alpha Tau | | Biotechnology | 2.41 | 10 | 0.42% | -19.40% |
| FBIO | Fortress | | Biotechnology | 1.72 | 10 | 0.00% | -42.86% |
| GTHX | G1 | | Biotechnology | 3.72 | 10 | -6.77% | 21.97% |
| GLYC | GlycoMimetics | | Biotechnology | 1.55 | 10 | -5.49% | -34.32% |
| QURE | uniQure N.V | | Biotechnology | 4.39 | 10 | -3.09% | -35.16% |
| MBIO | Mustang Bio | | Biotechnology | 0.24 | 10 | -25.02% | -82.44% |
| RIGL | Rigel | | Biotechnology | 1.07 | 10 | -2.73% | -26.21% |
| APLM | Apollomics | | Biotechnology | 0.44 | 10 | -2.22% | -52.64% |
| DERM | Dermira | | Biotechnology | 3.33 | 10 | -2.06% | -42.19% |
| MNOV | MediciNova | | Biotechnology | 1.29 | 10 | -1.53% | -14.00% |
| ACLX | Arcellx | | Biotechnology | 51.11 | 10 | -1.47% | -8.41% |
| NERV | Minerva Neuro | | Biotechnology | 2.41 | 10 | -1.11% | -60.81% |
| FULC | Fulcrum | | Biotechnology | 7.08 | 10 | -0.84% | 4.89% |
| RCKT | Rocket | | Biotechnology | 21.85 | 10 | -0.59% | -27.09% |
| IVA | Inventiva S.A | | Biotechnology | 3.24 | 10 | -0.31% | -28.16% |
| BMEA | Biomea Fusion | | Biotechnology | 10.75 | 10 | -0.19% | -26.57% |
| BMRN | BioMarin | | Biotechnology | 82.13 | 7 | 1.51% | -14.82% |
| SLN | Silence | | Biotechnology | 21.88 | 5 | 1.27% | 24.64% |
| To view more stocks, click on Next / Previous arrows or select different range: 0 - 25 , 25 - 50 , 50 - 75 , 75 - 100 , 100 - 125 , 125 - 150 , 150 - 175 , 175 - 200 , 200 - 225 , 225 - 250 , 250 - 275 , 275 - 300 , 300 - 325 , 325 - 350 , 350 - 375 , 375 - 400 | ||
 | Click To Change The Sort Order: By Market Cap or Company Size Performance: Year-to-date, Week and Day |  |
|
Get the most comprehensive stock market coverage daily at 12Stocks.com ➞ Best Stocks Today ➞ Best Stocks Weekly ➞ Best Stocks Year-to-Date ➞ Best Stocks Trends ➞  Best Stocks Today 12Stocks.com Best Nasdaq Stocks ➞ Best S&P 500 Stocks ➞ Best Tech Stocks ➞ Best Biotech Stocks ➞ |
| Detailed Overview of Biotech Stocks |
| Biotech Technical Overview, Leaders & Laggards, Top Biotech ETF Funds & Detailed Biotech Stocks List, Charts, Trends & More |
| Biotech Sector: Technical Analysis, Trends & YTD Performance | |
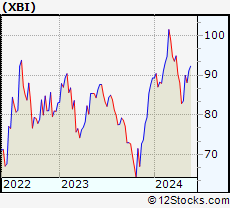
| Biotech sector, as represented by XBI, an exchange-traded fund [ETF] that holds basket of Biotech stocks (e.g, Amgen, Celgene) is down by -4.22% and is currently underperforming the overall market by -10.78% year-to-date. Below is a quick view of Technical charts and trends: | |
 XBI Weekly Chart |
|
| Long Term Trend: Not Good | |
| Medium Term Trend: Not Good | |
 XBI Daily Chart |
|
| Short Term Trend: Very Good | |
| Overall Trend Score: 49 | |
| YTD Performance: -4.22% | |
| **Trend Scores & Views Are Only For Educational Purposes And Not For Investing | |
| 12Stocks.com: Top Performing Biotech Sector Stocks | ||||||||||||||||||||||||||||||||||||||||||||||||
 The top performing Biotech sector stocks year to date are
Now, more recently, over last week, the top performing Biotech sector stocks on the move are


|
||||||||||||||||||||||||||||||||||||||||||||||||
| 12Stocks.com: Investing in Biotech Sector using Exchange Traded Funds | |
|
The following table shows list of key exchange traded funds (ETF) that
help investors track Biotech Index. For detailed view, check out our ETF Funds section of our website. Quick View: Move mouse or cursor over ETF symbol (ticker) to view short-term Technical chart and over ETF name to view long term chart. Click on ticker or stock name for detailed view. Click on to add stock symbol to your watchlist and to view watchlist. |
12Stocks.com List of ETFs that track Biotech Index
| Ticker | ETF Name | Watchlist | Recent Price | Market Intelligence Score | Change % | Week % | Year-to-date % |
| LABD | Biotech Bear 3X | | 9.69 | 30 | -7.89 | -7.89 | 0% |
| XBI | Biotech | | 85.52 | 49 | 2.43 | 2.43 | -4.22% |
| LABU | Biotech Bull 3X | | 94.11 | 42 | 7.54 | 7.54 | -22.84% |
| IBB | Biotechnology | | 128.37 | 42 | 1.49 | 1.49 | -5.51% |
| IYH | Healthcare | | 58.86 | 70 | 0.43 | 0.43 | 2.82% |
| IXJ | Global Healthcare | | 89.47 | 70 | 0.39 | 0.39 | 3.17% |
| BIB | Biotechnology | | 51.77 | 64 | 4.25 | 4.25 | -9.26% |
| IHF | Healthcare Providers | | 52.06 | 65 | 0.27 | 0.27 | -0.86% |
| CURE | Healthcare Bull 3X | | 106.25 | 39 | 0.90 | 0.9 | 4.43% |
| FBT | First NYSE | | 145.65 | 42 | 1.39 | 1.39 | -7.85% |
| BIS | Short Biotech | | 19.55 | 44 | -3.31 | -3.31 | 8.19% |
| PTH | DWA Healthcare Momentum | | 39.88 | 48 | -0.03 | -0.03 | 1.89% |
| PBE | Biotech & Genome | | 61.47 | 57 | 1.81 | 1.81 | -6.64% |
| BTEC | Principal Healthcare Innovators | | 34.84 | 42 | 1.72 | 1.72 | -4.1% |
| BBH | Biotech | | 157.37 | 49 | 1.10 | 1.1 | -4.81% |
| BBP | Bio Biotechnology Products | | 53.55 | 64 | 4.01 | 4.01 | -7.82% |
| BBC | Bio Biotechnology Clinical | | 26.25 | 65 | 2.82 | 2.82 | 7.35% |
| 12Stocks.com: Charts, Trends, Fundamental Data and Performances of Biotech Stocks | |
|
We now take in-depth look at all Biotech stocks including charts, multi-period performances and overall trends (as measured by market intelligence score). One can sort Biotech stocks (click link to choose) by Daily, Weekly and by Year-to-Date performances. Also, one can sort by size of the company or by market capitalization. |
| Select Your Default Chart Type: | |||||
| |||||
| Click on stock symbol or name for detailed view. Click on to add stock symbol to your watchlist and to view watchlist. Quick View: Move mouse or cursor over "Daily" to quickly view daily Technical stock chart and over "Weekly" to view weekly Technical stock chart. | |||||

 | IMRX Immuneering Corporation |
| Sector: Health Care | |
| SubSector: Biotechnology | |
| MarketCap: 303 Millions | |
| Recent Price: 1.48 Market Intelligence Score: 15 | |
| Day Percent Change: 0.68% Day Change: 0.01 | |
| Week Change: 0.68% Year-to-date Change: -80.5% | |
| IMRX Links: Profile News Message Board | |
| Charts:- Daily , Weekly | |
| Add IMRX to Watchlist: View: Get Complete IMRX Trend Analysis ➞ | |
 | OBIO Orchestra BioMed Holdings, Inc. |
| Sector: Health Care | |
| SubSector: Biotechnology | |
| MarketCap: 271 Millions | |
| Recent Price: 4.39 Market Intelligence Score: 15 | |
| Day Percent Change: 0.00% Day Change: 0.00 | |
| Week Change: 0% Year-to-date Change: -51.8% | |
| OBIO Links: Profile News Message Board | |
| Charts:- Daily , Weekly | |
| Add OBIO to Watchlist: View: Get Complete OBIO Trend Analysis ➞ | |
 | MOLN Molecular Partners AG |
| Sector: Health Care | |
| SubSector: Biotechnology | |
| MarketCap: 216 Millions | |
| Recent Price: 3.70 Market Intelligence Score: 15 | |
| Day Percent Change: -4.64% Day Change: -0.18 | |
| Week Change: -4.64% Year-to-date Change: -7.9% | |
| MOLN Links: Profile News Message Board | |
| Charts:- Daily , Weekly | |
| Add MOLN to Watchlist: View: Get Complete MOLN Trend Analysis ➞ | |
 | AMRN Amarin Corporation plc |
| Sector: Health Care | |
| SubSector: Biotechnology | |
| MarketCap: 4197.45 Millions | |
| Recent Price: 0.88 Market Intelligence Score: 13 | |
| Day Percent Change: 0.24% Day Change: 0.00 | |
| Week Change: 0.24% Year-to-date Change: 0.8% | |
| AMRN Links: Profile News Message Board | |
| Charts:- Daily , Weekly | |
| Add AMRN to Watchlist: View: Get Complete AMRN Trend Analysis ➞ | |
 | ATHA Athira Pharma, Inc. |
| Sector: Health Care | |
| SubSector: Biotechnology | |
| MarketCap: 92487 Millions | |
| Recent Price: 1.97 Market Intelligence Score: 10 | |
| Day Percent Change: 2.60% Day Change: 0.05 | |
| Week Change: 2.6% Year-to-date Change: -19.3% | |
| ATHA Links: Profile News Message Board | |
| Charts:- Daily , Weekly | |
| Add ATHA to Watchlist: View: Get Complete ATHA Trend Analysis ➞ | |
 | OMGA Omega Therapeutics, Inc. |
| Sector: Health Care | |
| SubSector: Biotechnology | |
| MarketCap: 304 Millions | |
| Recent Price: 2.29 Market Intelligence Score: 10 | |
| Day Percent Change: 0.88% Day Change: 0.02 | |
| Week Change: 0.88% Year-to-date Change: -23.9% | |
| OMGA Links: Profile News Message Board | |
| Charts:- Daily , Weekly | |
| Add OMGA to Watchlist: View: Get Complete OMGA Trend Analysis ➞ | |
 | IMNM Immunome, Inc. |
| Sector: Health Care | |
| SubSector: Biotechnology | |
| MarketCap: 12487 Millions | |
| Recent Price: 13.82 Market Intelligence Score: 10 | |
| Day Percent Change: 0.66% Day Change: 0.09 | |
| Week Change: 0.66% Year-to-date Change: 29.3% | |
| IMNM Links: Profile News Message Board | |
| Charts:- Daily , Weekly | |
| Add IMNM to Watchlist: View: Get Complete IMNM Trend Analysis ➞ | |
 | DRTS Alpha Tau Medical Ltd. |
| Sector: Health Care | |
| SubSector: Biotechnology | |
| MarketCap: 300 Millions | |
| Recent Price: 2.41 Market Intelligence Score: 10 | |
| Day Percent Change: 0.42% Day Change: 0.01 | |
| Week Change: 0.42% Year-to-date Change: -19.4% | |
| DRTS Links: Profile News Message Board | |
| Charts:- Daily , Weekly | |
| Add DRTS to Watchlist: View: Get Complete DRTS Trend Analysis ➞ | |
 | FBIO Fortress Biotech, Inc. |
| Sector: Health Care | |
| SubSector: Biotechnology | |
| MarketCap: 116.885 Millions | |
| Recent Price: 1.72 Market Intelligence Score: 10 | |
| Day Percent Change: 0.00% Day Change: 0.00 | |
| Week Change: 0% Year-to-date Change: -42.9% | |
| FBIO Links: Profile News Message Board | |
| Charts:- Daily , Weekly | |
| Add FBIO to Watchlist: View: Get Complete FBIO Trend Analysis ➞ | |
 | GTHX G1 Therapeutics, Inc. |
| Sector: Health Care | |
| SubSector: Biotechnology | |
| MarketCap: 484.085 Millions | |
| Recent Price: 3.72 Market Intelligence Score: 10 | |
| Day Percent Change: -6.77% Day Change: -0.27 | |
| Week Change: -6.77% Year-to-date Change: 22.0% | |
| GTHX Links: Profile News Message Board | |
| Charts:- Daily , Weekly | |
| Add GTHX to Watchlist: View: Get Complete GTHX Trend Analysis ➞ | |
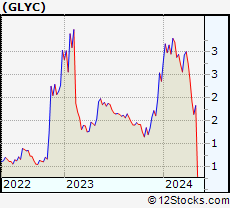 | GLYC GlycoMimetics, Inc. |
| Sector: Health Care | |
| SubSector: Biotechnology | |
| MarketCap: 100.785 Millions | |
| Recent Price: 1.55 Market Intelligence Score: 10 | |
| Day Percent Change: -5.49% Day Change: -0.09 | |
| Week Change: -5.49% Year-to-date Change: -34.3% | |
| GLYC Links: Profile News Message Board | |
| Charts:- Daily , Weekly | |
| Add GLYC to Watchlist: View: Get Complete GLYC Trend Analysis ➞ | |
 | QURE uniQure N.V. |
| Sector: Health Care | |
| SubSector: Biotechnology | |
| MarketCap: 2267.25 Millions | |
| Recent Price: 4.39 Market Intelligence Score: 10 | |
| Day Percent Change: -3.09% Day Change: -0.14 | |
| Week Change: -3.09% Year-to-date Change: -35.2% | |
| QURE Links: Profile News Message Board | |
| Charts:- Daily , Weekly | |
| Add QURE to Watchlist: View: Get Complete QURE Trend Analysis ➞ | |
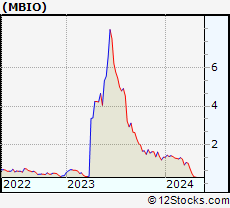 | MBIO Mustang Bio, Inc. |
| Sector: Health Care | |
| SubSector: Biotechnology | |
| MarketCap: 117.785 Millions | |
| Recent Price: 0.24 Market Intelligence Score: 10 | |
| Day Percent Change: -25.02% Day Change: -0.08 | |
| Week Change: -25.02% Year-to-date Change: -82.4% | |
| MBIO Links: Profile News Message Board | |
| Charts:- Daily , Weekly | |
| Add MBIO to Watchlist: View: Get Complete MBIO Trend Analysis ➞ | |
 | RIGL Rigel Pharmaceuticals, Inc. |
| Sector: Health Care | |
| SubSector: Biotechnology | |
| MarketCap: 256.585 Millions | |
| Recent Price: 1.07 Market Intelligence Score: 10 | |
| Day Percent Change: -2.73% Day Change: -0.03 | |
| Week Change: -2.73% Year-to-date Change: -26.2% | |
| RIGL Links: Profile News Message Board | |
| Charts:- Daily , Weekly | |
| Add RIGL to Watchlist: View: Get Complete RIGL Trend Analysis ➞ | |
 | APLM Apollomics, Inc. |
| Sector: Health Care | |
| SubSector: Biotechnology | |
| MarketCap: 481 Millions | |
| Recent Price: 0.44 Market Intelligence Score: 10 | |
| Day Percent Change: -2.22% Day Change: -0.01 | |
| Week Change: -2.22% Year-to-date Change: -52.6% | |
| APLM Links: Profile News Message Board | |
| Charts:- Daily , Weekly | |
| Add APLM to Watchlist: View: Get Complete APLM Trend Analysis ➞ | |
 | DERM Dermira, Inc. |
| Sector: Health Care | |
| SubSector: Biotechnology | |
| MarketCap: 1312.25 Millions | |
| Recent Price: 3.33 Market Intelligence Score: 10 | |
| Day Percent Change: -2.06% Day Change: -0.07 | |
| Week Change: -2.06% Year-to-date Change: -42.2% | |
| DERM Links: Profile News Message Board | |
| Charts:- Daily , Weekly | |
| Add DERM to Watchlist: View: Get Complete DERM Trend Analysis ➞ | |
 | MNOV MediciNova, Inc. |
| Sector: Health Care | |
| SubSector: Biotechnology | |
| MarketCap: 137.685 Millions | |
| Recent Price: 1.29 Market Intelligence Score: 10 | |
| Day Percent Change: -1.53% Day Change: -0.02 | |
| Week Change: -1.53% Year-to-date Change: -14.0% | |
| MNOV Links: Profile News Message Board | |
| Charts:- Daily , Weekly | |
| Add MNOV to Watchlist: View: Get Complete MNOV Trend Analysis ➞ | |
 | ACLX Arcellx, Inc. |
| Sector: Health Care | |
| SubSector: Biotechnology | |
| MarketCap: 1530 Millions | |
| Recent Price: 51.11 Market Intelligence Score: 10 | |
| Day Percent Change: -1.47% Day Change: -0.76 | |
| Week Change: -1.47% Year-to-date Change: -8.4% | |
| ACLX Links: Profile News Message Board | |
| Charts:- Daily , Weekly | |
| Add ACLX to Watchlist: View: Get Complete ACLX Trend Analysis ➞ | |
 | NERV Minerva Neurosciences, Inc. |
| Sector: Health Care | |
| SubSector: Biotechnology | |
| MarketCap: 223.385 Millions | |
| Recent Price: 2.41 Market Intelligence Score: 10 | |
| Day Percent Change: -1.11% Day Change: -0.03 | |
| Week Change: -1.11% Year-to-date Change: -60.8% | |
| NERV Links: Profile News Message Board | |
| Charts:- Daily , Weekly | |
| Add NERV to Watchlist: View: Get Complete NERV Trend Analysis ➞ | |
 | FULC Fulcrum Therapeutics, Inc. |
| Sector: Health Care | |
| SubSector: Biotechnology | |
| MarketCap: 274.785 Millions | |
| Recent Price: 7.08 Market Intelligence Score: 10 | |
| Day Percent Change: -0.84% Day Change: -0.06 | |
| Week Change: -0.84% Year-to-date Change: 4.9% | |
| FULC Links: Profile News Message Board | |
| Charts:- Daily , Weekly | |
| Add FULC to Watchlist: View: Get Complete FULC Trend Analysis ➞ | |
 | RCKT Rocket Pharmaceuticals, Inc. |
| Sector: Health Care | |
| SubSector: Biotechnology | |
| MarketCap: 899.585 Millions | |
| Recent Price: 21.85 Market Intelligence Score: 10 | |
| Day Percent Change: -0.59% Day Change: -0.13 | |
| Week Change: -0.59% Year-to-date Change: -27.1% | |
| RCKT Links: Profile News Message Board | |
| Charts:- Daily , Weekly | |
| Add RCKT to Watchlist: View: Get Complete RCKT Trend Analysis ➞ | |
 | IVA Inventiva S.A. |
| Sector: Health Care | |
| SubSector: Biotechnology | |
| MarketCap: 46487 Millions | |
| Recent Price: 3.24 Market Intelligence Score: 10 | |
| Day Percent Change: -0.31% Day Change: -0.01 | |
| Week Change: -0.31% Year-to-date Change: -28.2% | |
| IVA Links: Profile News Message Board | |
| Charts:- Daily , Weekly | |
| Add IVA to Watchlist: View: Get Complete IVA Trend Analysis ➞ | |
 | BMEA Biomea Fusion, Inc. |
| Sector: Health Care | |
| SubSector: Biotechnology | |
| MarketCap: 818 Millions | |
| Recent Price: 10.75 Market Intelligence Score: 10 | |
| Day Percent Change: -0.19% Day Change: -0.02 | |
| Week Change: -0.19% Year-to-date Change: -26.6% | |
| BMEA Links: Profile News Message Board | |
| Charts:- Daily , Weekly | |
| Add BMEA to Watchlist: View: Get Complete BMEA Trend Analysis ➞ | |
 | BMRN BioMarin Pharmaceutical Inc. |
| Sector: Health Care | |
| SubSector: Biotechnology | |
| MarketCap: 14887.5 Millions | |
| Recent Price: 82.13 Market Intelligence Score: 7 | |
| Day Percent Change: 1.51% Day Change: 1.22 | |
| Week Change: 1.51% Year-to-date Change: -14.8% | |
| BMRN Links: Profile News Message Board | |
| Charts:- Daily , Weekly | |
| Add BMRN to Watchlist: View: Get Complete BMRN Trend Analysis ➞ | |
 | SLN Silence Therapeutics plc |
| Sector: Health Care | |
| SubSector: Biotechnology | |
| MarketCap: 198 Millions | |
| Recent Price: 21.88 Market Intelligence Score: 5 | |
| Day Percent Change: 1.27% Day Change: 0.27 | |
| Week Change: 1.27% Year-to-date Change: 24.6% | |
| SLN Links: Profile News Message Board | |
| Charts:- Daily , Weekly | |
| Add SLN to Watchlist: View: Get Complete SLN Trend Analysis ➞ | |
| To view more stocks, click on Next / Previous arrows or select different range: 0 - 25 , 25 - 50 , 50 - 75 , 75 - 100 , 100 - 125 , 125 - 150 , 150 - 175 , 175 - 200 , 200 - 225 , 225 - 250 , 250 - 275 , 275 - 300 , 300 - 325 , 325 - 350 , 350 - 375 , 375 - 400 | ||
| Click To Change The Sort Order: By Market Cap or Company Size Performance: Year-to-date, Week and Day | |
| Select Chart Type: | ||
|
Best Stocks Today 12Stocks.com |
© 2024 12Stocks.com Terms & Conditions Privacy Contact Us
All Information Provided Only For Education And Not To Be Used For Investing or Trading. See Terms & Conditions


One More Thing ... Get Best Stocks Delivered Daily!
Never Ever Miss A Move With Our Top Ten Stocks Lists
Find Best Stocks In Any Market - Bull or Bear Market
Take A Peek At Our Top Ten Stocks Lists: Daily, Weekly, Year-to-Date & Top Trends
Find Best Stocks In Any Market - Bull or Bear Market
Take A Peek At Our Top Ten Stocks Lists: Daily, Weekly, Year-to-Date & Top Trends
Biotech Stocks With Best Up Trends [0-bearish to 100-bullish]: Deciphera [100], Mesoblast [100], PTC [100], Day One[100], Agenus [100], Cullinan Oncology[100], Xencor [100], Zura Bio[100], Verrica [100], Agios [100], Shattuck Labs[100]
Best Biotech Stocks Year-to-Date:
Pieris [6334.07%], Avenue [2707.45%], Precision [2595.89%], Inovio [2154.9%], Assembly [1472.98%], Agenus [1441.25%], NuCana [1252.27%], Adverum nologies[1165.94%], Affimed N.V[778.4%], Mesoblast [545.45%], Corbus [490.07%] Best Biotech Stocks This Week:
Deciphera [72.56%], Vaxxinity [31.65%], Acrivon [18.2%], Janux [18.18%], Ocean Biomedical[17.16%], Ginkgo Bioworks[15.08%], Codexis [14.66%], Exscientia [14.5%], Mesoblast [13.78%], PTC [12.5%], Nektar [10.61%] Best Biotech Stocks Daily:
Deciphera [72.56%], Vaxxinity [31.65%], Acrivon [18.20%], Janux [18.18%], Ocean Biomedical[17.16%], Ginkgo Bioworks[15.08%], Codexis [14.66%], Exscientia [14.50%], Mesoblast [13.78%], PTC [12.50%], Nektar [10.61%]