
 Login Sign Up


| |||||
 |  | ||||

| 12Stocks.com Market Intelligence |
Best Biotech Stocks
|
|
| Quick Read: Best Biotech Stocks List By Performances & Trends: Daily, Weekly, Year-to-Date, Market Cap (Size) & Technical Trends | |||
| Best Biotech Stocks Views: Quick Browse View, Summary & Slide Show View | |||
| 12Stocks.com Biotech Stocks Performances & Trends Daily | |||||||||
|
|  The overall market intelligence score is 25 (0-bearish to 100-bullish) which puts Biotech sector in short term bearish to neutral trend. The market intelligence score from previous trading session is 32 and hence a deterioration of trend.
| ||||||||
Here are the market intelligence trend scores of the most requested Biotech stocks at 12Stocks.com (click stock name for detailed review):
|


| 12Stocks.com: Investing in Biotech sector with Stocks | |
|
The following table helps investors and traders sort through current performance and trends (as measured by market intelligence score) of various
stocks in the Biotech sector. Quick View: Move mouse or cursor over stock symbol (ticker) to view short-term Technical chart and over stock name to view long term chart. Click on  to add stock symbol to your watchlist and to add stock symbol to your watchlist and  to view watchlist. Click on any ticker or stock name for detailed market intelligence report for that stock. to view watchlist. Click on any ticker or stock name for detailed market intelligence report for that stock. |
12Stocks.com Performance of Stocks in Biotech Sector
| Ticker | Stock Name | Watchlist | Category | Recent Price | Market Intelligence Score | Change % | YTD Change% |
| SPRY | ARS |   | Biotechnology | 8.29 | 46 | -2.24% | 45.82% |
| ENTA | Enanta | | Biotechnology | 12.92 | 46 | -1.75% | 37.30% |
| CMPX | Compass | | Biotechnology | 1.49 | 46 | -1.32% | -2.93% |
| GMAB | Genmab A/S | | Biotechnology | 28.47 | 46 | -0.32% | -10.58% |
| SLN | Silence | | Biotechnology | 22.33 | 46 | -0.58% | 27.20% |
| VALN | Valneva SE | | Biotechnology | 7.74 | 45 | -2.24% | -25.34% |
| SRPT | Sarepta | | Biotechnology | 124.25 | 44 | 6.09% | 28.85% |
| SMMT | Summit | | Biotechnology | 3.59 | 44 | -3.75% | 37.55% |
| SGMO | Sangamo | | Biotechnology | 0.49 | 44 | -5.36% | -9.26% |
| CTMX | CytomX | | Biotechnology | 1.63 | 44 | -2.98% | 5.16% |
| ANIP | ANI | | Biotechnology | 65.43 | 44 | -1.07% | 18.66% |
| ABUS | Arbutus Biopharma | | Biotechnology | 2.75 | 43 | 2.23% | 10.00% |
| RGNX | REGENXBIO | | Biotechnology | 16.04 | 43 | 0.88% | -10.64% |
| ATAI | Atai Life | | Biotechnology | 1.87 | 43 | -5.08% | 32.62% |
| ADCT | ADC | | Biotechnology | 4.78 | 43 | -3.82% | 187.95% |
| VNDA | Vanda | | Biotechnology | 4.56 | 43 | -1.51% | 8.06% |
| AURA | Aura | | Biotechnology | 7.12 | 43 | -1.66% | -19.55% |
| INSM | Insmed | | Biotechnology | 25.81 | 42 | 2.14% | -16.72% |
| KMDA | Kamada | | Biotechnology | 5.18 | 42 | 1.77% | -15.36% |
| OLMA | Olema | | Biotechnology | 10.15 | 42 | 1.50% | -27.81% |
| VCYT | Veracyte | | Biotechnology | 19.90 | 42 | 0.35% | -27.66% |
| CHRS | Coherus | | Biotechnology | 2.02 | 42 | -7.34% | -39.34% |
| ARWR | Arrowhead | | Biotechnology | 23.29 | 42 | -4.00% | -23.89% |
| XENE | Xenon | | Biotechnology | 39.50 | 42 | -3.87% | -14.24% |
| CASI | CASI | | Biotechnology | 2.44 | 42 | -2.79% | -65.92% |
| To view more stocks, click on Next / Previous arrows or select different range: 0 - 25 , 25 - 50 , 50 - 75 , 75 - 100 , 100 - 125 , 125 - 150 , 150 - 175 , 175 - 200 , 200 - 225 , 225 - 250 , 250 - 275 , 275 - 300 , 300 - 325 , 325 - 350 , 350 - 375 , 375 - 400 | ||
 | Click To Change The Sort Order: By Market Cap or Company Size Performance: Year-to-date, Week and Day |  |
|
Get the most comprehensive stock market coverage daily at 12Stocks.com ➞ Best Stocks Today ➞ Best Stocks Weekly ➞ Best Stocks Year-to-Date ➞ Best Stocks Trends ➞  Best Stocks Today 12Stocks.com Best Nasdaq Stocks ➞ Best S&P 500 Stocks ➞ Best Tech Stocks ➞ Best Biotech Stocks ➞ |
| Detailed Overview of Biotech Stocks |
| Biotech Technical Overview, Leaders & Laggards, Top Biotech ETF Funds & Detailed Biotech Stocks List, Charts, Trends & More |
| Biotech Sector: Technical Analysis, Trends & YTD Performance | |
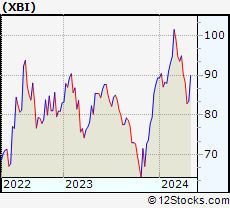
| Biotech sector, as represented by XBI, an exchange-traded fund [ETF] that holds basket of Biotech stocks (e.g, Amgen, Celgene) is down by -5.99% and is currently underperforming the overall market by -11.65% year-to-date. Below is a quick view of Technical charts and trends: | |
 XBI Weekly Chart |
|
| Long Term Trend: Not Good | |
| Medium Term Trend: Not Good | |
 XBI Daily Chart |
|
| Short Term Trend: Very Good | |
| Overall Trend Score: 25 | |
| YTD Performance: -5.99% | |
| **Trend Scores & Views Are Only For Educational Purposes And Not For Investing | |
| 12Stocks.com: Top Performing Biotech Sector Stocks | ||||||||||||||||||||||||||||||||||||||||||||||||
 The top performing Biotech sector stocks year to date are
Now, more recently, over last week, the top performing Biotech sector stocks on the move are


|
||||||||||||||||||||||||||||||||||||||||||||||||
| 12Stocks.com: Investing in Biotech Sector using Exchange Traded Funds | |
|
The following table shows list of key exchange traded funds (ETF) that
help investors track Biotech Index. For detailed view, check out our ETF Funds section of our website. Quick View: Move mouse or cursor over ETF symbol (ticker) to view short-term Technical chart and over ETF name to view long term chart. Click on ticker or stock name for detailed view. Click on to add stock symbol to your watchlist and to view watchlist. |
12Stocks.com List of ETFs that track Biotech Index
| Ticker | ETF Name | Watchlist | Recent Price | Market Intelligence Score | Change % | Week % | Year-to-date % |
| LABD | Biotech Bear 3X | | 10.37 | 62 | 2.98 | -3.98 | 7.02% |
| XBI | Biotech | | 83.94 | 25 | -0.89 | 1.34 | -5.99% |
| LABU | Biotech Bull 3X | | 89.40 | 25 | -2.80 | 3.89 | -26.7% |
| IBB | Biotechnology | | 127.76 | 32 | -0.20 | 2.44 | -5.96% |
| IYH | Healthcare | | 59.09 | 30 | -0.20 | 1.6 | 3.22% |
| IXJ | Global Healthcare | | 89.31 | 45 | -0.35 | 1.78 | 2.99% |
| IHF | Healthcare Providers | | 52.26 | 48 | -0.11 | 0.1 | -0.48% |
| CURE | Healthcare Bull 3X | | 107.85 | 32 | -0.25 | 4.37 | 6.01% |
| FBT | First NYSE | | 145.40 | 18 | 0.05 | 2.62 | -8.01% |
| BIB | Biotechnology | | 50.18 | 32 | -0.30 | 4.11 | -12.04% |
| BIS | Short Biotech | | 20.09 | 61 | 0.75 | -3.85 | 11.18% |
| BBH | Biotech | | 157.33 | 49 | 0.03 | 3.26 | -4.83% |
| PBE | Biotech & Genome | | 60.88 | 17 | -0.43 | 1.72 | -7.53% |
| PTH | DWA Healthcare Momentum | | 39.63 | 46 | -1.34 | 0.25 | 1.25% |
| BTEC | Principal Healthcare Innovators | | 34.20 | 18 | -1.73 | 1.02 | -5.85% |
| BBP | Bio Biotechnology Products | | 52.40 | 20 | 0.02 | 3.91 | -9.8% |
| BBC | Bio Biotechnology Clinical | | 25.63 | 36 | -0.17 | 3.71 | 4.81% |
| 12Stocks.com: Charts, Trends, Fundamental Data and Performances of Biotech Stocks | |
|
We now take in-depth look at all Biotech stocks including charts, multi-period performances and overall trends (as measured by market intelligence score). One can sort Biotech stocks (click link to choose) by Daily, Weekly and by Year-to-Date performances. Also, one can sort by size of the company or by market capitalization. |
| Select Your Default Chart Type: | |||||
| |||||
| Click on stock symbol or name for detailed view. Click on to add stock symbol to your watchlist and to view watchlist. Quick View: Move mouse or cursor over "Daily" to quickly view daily Technical stock chart and over "Weekly" to view weekly Technical stock chart. | |||||

 | SPRY ARS Pharmaceuticals, Inc. |
| Sector: Health Care | |
| SubSector: Biotechnology | |
| MarketCap: 632 Millions | |
| Recent Price: 8.29 Market Intelligence Score: 46 | |
| Day Percent Change: -2.24% Day Change: -0.19 | |
| Week Change: -2.13% Year-to-date Change: 45.8% | |
| SPRY Links: Profile News Message Board | |
| Charts:- Daily , Weekly | |
| Add SPRY to Watchlist: View: Get Complete SPRY Trend Analysis ➞ | |
 | ENTA Enanta Pharmaceuticals, Inc. |
| Sector: Health Care | |
| SubSector: Biotechnology | |
| MarketCap: 998.385 Millions | |
| Recent Price: 12.92 Market Intelligence Score: 46 | |
| Day Percent Change: -1.75% Day Change: -0.23 | |
| Week Change: -3% Year-to-date Change: 37.3% | |
| ENTA Links: Profile News Message Board | |
| Charts:- Daily , Weekly | |
| Add ENTA to Watchlist: View: Get Complete ENTA Trend Analysis ➞ | |
 | CMPX Compass Therapeutics, Inc. |
| Sector: Health Care | |
| SubSector: Biotechnology | |
| MarketCap: 406 Millions | |
| Recent Price: 1.49 Market Intelligence Score: 46 | |
| Day Percent Change: -1.32% Day Change: -0.02 | |
| Week Change: 1.36% Year-to-date Change: -2.9% | |
| CMPX Links: Profile News Message Board | |
| Charts:- Daily , Weekly | |
| Add CMPX to Watchlist: View: Get Complete CMPX Trend Analysis ➞ | |
 | GMAB Genmab A/S |
| Sector: Health Care | |
| SubSector: Biotechnology | |
| MarketCap: 12482.3 Millions | |
| Recent Price: 28.47 Market Intelligence Score: 46 | |
| Day Percent Change: -0.32% Day Change: -0.09 | |
| Week Change: -0.87% Year-to-date Change: -10.6% | |
| GMAB Links: Profile News Message Board | |
| Charts:- Daily , Weekly | |
| Add GMAB to Watchlist: View: Get Complete GMAB Trend Analysis ➞ | |
 | SLN Silence Therapeutics plc |
| Sector: Health Care | |
| SubSector: Biotechnology | |
| MarketCap: 198 Millions | |
| Recent Price: 22.33 Market Intelligence Score: 46 | |
| Day Percent Change: -0.58% Day Change: -0.13 | |
| Week Change: -1.37% Year-to-date Change: 27.2% | |
| SLN Links: Profile News Message Board | |
| Charts:- Daily , Weekly | |
| Add SLN to Watchlist: View: Get Complete SLN Trend Analysis ➞ | |
 | VALN Valneva SE |
| Sector: Health Care | |
| SubSector: Biotechnology | |
| MarketCap: 1010 Millions | |
| Recent Price: 7.74 Market Intelligence Score: 45 | |
| Day Percent Change: -2.24% Day Change: -0.18 | |
| Week Change: 2.1% Year-to-date Change: -25.3% | |
| VALN Links: Profile News Message Board | |
| Charts:- Daily , Weekly | |
| Add VALN to Watchlist: View: Get Complete VALN Trend Analysis ➞ | |
 | SRPT Sarepta Therapeutics, Inc. |
| Sector: Health Care | |
| SubSector: Biotechnology | |
| MarketCap: 7388.05 Millions | |
| Recent Price: 124.25 Market Intelligence Score: 44 | |
| Day Percent Change: 6.09% Day Change: 7.13 | |
| Week Change: 7.46% Year-to-date Change: 28.9% | |
| SRPT Links: Profile News Message Board | |
| Charts:- Daily , Weekly | |
| Add SRPT to Watchlist: View: Get Complete SRPT Trend Analysis ➞ | |
 | SMMT Summit Therapeutics plc |
| Sector: Health Care | |
| SubSector: Biotechnology | |
| MarketCap: 156.985 Millions | |
| Recent Price: 3.59 Market Intelligence Score: 44 | |
| Day Percent Change: -3.75% Day Change: -0.14 | |
| Week Change: 2.57% Year-to-date Change: 37.6% | |
| SMMT Links: Profile News Message Board | |
| Charts:- Daily , Weekly | |
| Add SMMT to Watchlist: View: Get Complete SMMT Trend Analysis ➞ | |
 | SGMO Sangamo Therapeutics, Inc. |
| Sector: Health Care | |
| SubSector: Biotechnology | |
| MarketCap: 779.285 Millions | |
| Recent Price: 0.49 Market Intelligence Score: 44 | |
| Day Percent Change: -5.36% Day Change: -0.03 | |
| Week Change: -3.62% Year-to-date Change: -9.3% | |
| SGMO Links: Profile News Message Board | |
| Charts:- Daily , Weekly | |
| Add SGMO to Watchlist: View: Get Complete SGMO Trend Analysis ➞ | |
 | CTMX CytomX Therapeutics, Inc. |
| Sector: Health Care | |
| SubSector: Biotechnology | |
| MarketCap: 264.885 Millions | |
| Recent Price: 1.63 Market Intelligence Score: 44 | |
| Day Percent Change: -2.98% Day Change: -0.05 | |
| Week Change: -2.4% Year-to-date Change: 5.2% | |
| CTMX Links: Profile News Message Board | |
| Charts:- Daily , Weekly | |
| Add CTMX to Watchlist: View: Get Complete CTMX Trend Analysis ➞ | |
 | ANIP ANI Pharmaceuticals, Inc. |
| Sector: Health Care | |
| SubSector: Biotechnology | |
| MarketCap: 489.285 Millions | |
| Recent Price: 65.43 Market Intelligence Score: 44 | |
| Day Percent Change: -1.07% Day Change: -0.71 | |
| Week Change: -0.08% Year-to-date Change: 18.7% | |
| ANIP Links: Profile News Message Board | |
| Charts:- Daily , Weekly | |
| Add ANIP to Watchlist: View: Get Complete ANIP Trend Analysis ➞ | |
 | ABUS Arbutus Biopharma Corporation |
| Sector: Health Care | |
| SubSector: Biotechnology | |
| MarketCap: 110.885 Millions | |
| Recent Price: 2.75 Market Intelligence Score: 43 | |
| Day Percent Change: 2.23% Day Change: 0.06 | |
| Week Change: 1.1% Year-to-date Change: 10.0% | |
| ABUS Links: Profile News Message Board | |
| Charts:- Daily , Weekly | |
| Add ABUS to Watchlist: View: Get Complete ABUS Trend Analysis ➞ | |
 | RGNX REGENXBIO Inc. |
| Sector: Health Care | |
| SubSector: Biotechnology | |
| MarketCap: 1232.85 Millions | |
| Recent Price: 16.04 Market Intelligence Score: 43 | |
| Day Percent Change: 0.88% Day Change: 0.14 | |
| Week Change: 2.23% Year-to-date Change: -10.6% | |
| RGNX Links: Profile News Message Board | |
| Charts:- Daily , Weekly | |
| Add RGNX to Watchlist: View: Get Complete RGNX Trend Analysis ➞ | |
 | ATAI Atai Life Sciences N.V. |
| Sector: Health Care | |
| SubSector: Biotechnology | |
| MarketCap: 287 Millions | |
| Recent Price: 1.87 Market Intelligence Score: 43 | |
| Day Percent Change: -5.08% Day Change: -0.10 | |
| Week Change: 1.08% Year-to-date Change: 32.6% | |
| ATAI Links: Profile News Message Board | |
| Charts:- Daily , Weekly | |
| Add ATAI to Watchlist: View: Get Complete ATAI Trend Analysis ➞ | |
 | ADCT ADC Therapeutics SA |
| Sector: Health Care | |
| SubSector: Biotechnology | |
| MarketCap: 26087 Millions | |
| Recent Price: 4.78 Market Intelligence Score: 43 | |
| Day Percent Change: -3.82% Day Change: -0.19 | |
| Week Change: -1.85% Year-to-date Change: 188.0% | |
| ADCT Links: Profile News Message Board | |
| Charts:- Daily , Weekly | |
| Add ADCT to Watchlist: View: Get Complete ADCT Trend Analysis ➞ | |
 | VNDA Vanda Pharmaceuticals Inc. |
| Sector: Health Care | |
| SubSector: Biotechnology | |
| MarketCap: 464.585 Millions | |
| Recent Price: 4.56 Market Intelligence Score: 43 | |
| Day Percent Change: -1.51% Day Change: -0.07 | |
| Week Change: -10.76% Year-to-date Change: 8.1% | |
| VNDA Links: Profile News Message Board | |
| Charts:- Daily , Weekly | |
| Add VNDA to Watchlist: View: Get Complete VNDA Trend Analysis ➞ | |
 | AURA Aura Biosciences, Inc. |
| Sector: Health Care | |
| SubSector: Biotechnology | |
| MarketCap: 469 Millions | |
| Recent Price: 7.12 Market Intelligence Score: 43 | |
| Day Percent Change: -1.66% Day Change: -0.12 | |
| Week Change: -0.97% Year-to-date Change: -19.6% | |
| AURA Links: Profile News Message Board | |
| Charts:- Daily , Weekly | |
| Add AURA to Watchlist: View: Get Complete AURA Trend Analysis ➞ | |
 | INSM Insmed Incorporated |
| Sector: Health Care | |
| SubSector: Biotechnology | |
| MarketCap: 1452.45 Millions | |
| Recent Price: 25.81 Market Intelligence Score: 42 | |
| Day Percent Change: 2.14% Day Change: 0.54 | |
| Week Change: 6.13% Year-to-date Change: -16.7% | |
| INSM Links: Profile News Message Board | |
| Charts:- Daily , Weekly | |
| Add INSM to Watchlist: View: Get Complete INSM Trend Analysis ➞ | |
 | KMDA Kamada Ltd. |
| Sector: Health Care | |
| SubSector: Biotechnology | |
| MarketCap: 238.685 Millions | |
| Recent Price: 5.18 Market Intelligence Score: 42 | |
| Day Percent Change: 1.77% Day Change: 0.09 | |
| Week Change: 2.57% Year-to-date Change: -15.4% | |
| KMDA Links: Profile News Message Board | |
| Charts:- Daily , Weekly | |
| Add KMDA to Watchlist: View: Get Complete KMDA Trend Analysis ➞ | |
 | OLMA Olema Pharmaceuticals, Inc. |
| Sector: Health Care | |
| SubSector: Biotechnology | |
| MarketCap: 17687 Millions | |
| Recent Price: 10.15 Market Intelligence Score: 42 | |
| Day Percent Change: 1.50% Day Change: 0.15 | |
| Week Change: 2.94% Year-to-date Change: -27.8% | |
| OLMA Links: Profile News Message Board | |
| Charts:- Daily , Weekly | |
| Add OLMA to Watchlist: View: Get Complete OLMA Trend Analysis ➞ | |
 | VCYT Veracyte, Inc. |
| Sector: Health Care | |
| SubSector: Biotechnology | |
| MarketCap: 1089.05 Millions | |
| Recent Price: 19.90 Market Intelligence Score: 42 | |
| Day Percent Change: 0.35% Day Change: 0.07 | |
| Week Change: 2.31% Year-to-date Change: -27.7% | |
| VCYT Links: Profile News Message Board | |
| Charts:- Daily , Weekly | |
| Add VCYT to Watchlist: View: Get Complete VCYT Trend Analysis ➞ | |
 | CHRS Coherus BioSciences, Inc. |
| Sector: Health Care | |
| SubSector: Biotechnology | |
| MarketCap: 1073.45 Millions | |
| Recent Price: 2.02 Market Intelligence Score: 42 | |
| Day Percent Change: -7.34% Day Change: -0.16 | |
| Week Change: -2.42% Year-to-date Change: -39.3% | |
| CHRS Links: Profile News Message Board | |
| Charts:- Daily , Weekly | |
| Add CHRS to Watchlist: View: Get Complete CHRS Trend Analysis ➞ | |
 | ARWR Arrowhead Pharmaceuticals, Inc. |
| Sector: Health Care | |
| SubSector: Biotechnology | |
| MarketCap: 3226.15 Millions | |
| Recent Price: 23.29 Market Intelligence Score: 42 | |
| Day Percent Change: -4.00% Day Change: -0.97 | |
| Week Change: 4.3% Year-to-date Change: -23.9% | |
| ARWR Links: Profile News Message Board | |
| Charts:- Daily , Weekly | |
| Add ARWR to Watchlist: View: Get Complete ARWR Trend Analysis ➞ | |
 | XENE Xenon Pharmaceuticals Inc. |
| Sector: Health Care | |
| SubSector: Biotechnology | |
| MarketCap: 388.585 Millions | |
| Recent Price: 39.50 Market Intelligence Score: 42 | |
| Day Percent Change: -3.87% Day Change: -1.59 | |
| Week Change: -0.95% Year-to-date Change: -14.2% | |
| XENE Links: Profile News Message Board | |
| Charts:- Daily , Weekly | |
| Add XENE to Watchlist: View: Get Complete XENE Trend Analysis ➞ | |
 | CASI CASI Pharmaceuticals, Inc. |
| Sector: Health Care | |
| SubSector: Biotechnology | |
| MarketCap: 210.085 Millions | |
| Recent Price: 2.44 Market Intelligence Score: 42 | |
| Day Percent Change: -2.79% Day Change: -0.07 | |
| Week Change: 8.44% Year-to-date Change: -65.9% | |
| CASI Links: Profile News Message Board | |
| Charts:- Daily , Weekly | |
| Add CASI to Watchlist: View: Get Complete CASI Trend Analysis ➞ | |
| To view more stocks, click on Next / Previous arrows or select different range: 0 - 25 , 25 - 50 , 50 - 75 , 75 - 100 , 100 - 125 , 125 - 150 , 150 - 175 , 175 - 200 , 200 - 225 , 225 - 250 , 250 - 275 , 275 - 300 , 300 - 325 , 325 - 350 , 350 - 375 , 375 - 400 | ||
| Click To Change The Sort Order: By Market Cap or Company Size Performance: Year-to-date, Week and Day | |
| Select Chart Type: | ||
|
Best Stocks Today 12Stocks.com |
© 2024 12Stocks.com Terms & Conditions Privacy Contact Us
All Information Provided Only For Education And Not To Be Used For Investing or Trading. See Terms & Conditions


One More Thing ... Get Best Stocks Delivered Daily!
Never Ever Miss A Move With Our Top Ten Stocks Lists
Find Best Stocks In Any Market - Bull or Bear Market
Take A Peek At Our Top Ten Stocks Lists: Daily, Weekly, Year-to-Date & Top Trends
Find Best Stocks In Any Market - Bull or Bear Market
Take A Peek At Our Top Ten Stocks Lists: Daily, Weekly, Year-to-Date & Top Trends
Biotech Stocks With Best Up Trends [0-bearish to 100-bullish]: Annovis Bio[100], PureTech Health[100], Agios [100], Pieris [100], Avadel [100], Agenus [95], Mesoblast [95], Exelixis [95], Blueprint Medicines[95], BioMarin [95], AlloVir [95]
Best Biotech Stocks Year-to-Date:
Pieris [6427.47%], Precision [2590.41%], Inovio [1892.16%], Assembly [1543.7%], Adverum nologies[1253.61%], NuCana [1198.17%], Agenus [796.24%], Affimed N.V[680.8%], Corbus [488.41%], Mesoblast [465.45%], Janux [352.07%] Best Biotech Stocks This Week:
Pieris [8093.1%], Agenus [39.74%], BeyondSpring [35%], Seres [30.29%], Annovis Bio[27.4%], ProKidney [23.28%], Cullinan Oncology[20.69%], Mesoblast [19.39%], Molecular Partners[16.87%], HOOKIPA Pharma[16.17%], Longboard [13.3%] Best Biotech Stocks Daily:
Agenus [14.86%], Cullinan Oncology[13.55%], HOOKIPA Pharma[11.11%], Gritstone Oncology[10.06%], Sage [8.11%], Relay [7.46%], Annovis Bio[7.24%], BeyondSpring [6.11%], Sarepta [6.09%], Molecular Templates[5.81%], Vigil Neuroscience[5.66%]