
 Login Sign Up


| |||||
 |  | ||||

| 12Stocks.com Market Intelligence |
Best Biotech Stocks
|
|
| Quick Read: Best Biotech Stocks List By Performances & Trends: Daily, Weekly, Year-to-Date, Market Cap (Size) & Technical Trends | |||
| Best Biotech Stocks Views: Quick Browse View, Summary & Slide Show View | |||
| 12Stocks.com Biotech Stocks Performances & Trends Daily | |||||||||
|
|  The overall market intelligence score is 0 (0-bearish to 100-bullish) which puts Biotech sector in short term bearish trend. The market intelligence score from previous trading session is 26 and a deterioration of trend continues.
| ||||||||
Here are the market intelligence trend scores of the most requested Biotech stocks at 12Stocks.com (click stock name for detailed review):
|


| 12Stocks.com: Investing in Biotech sector with Stocks | |
|
The following table helps investors and traders sort through current performance and trends (as measured by market intelligence score) of various
stocks in the Biotech sector. Quick View: Move mouse or cursor over stock symbol (ticker) to view short-term Technical chart and over stock name to view long term chart. Click on  to add stock symbol to your watchlist and to add stock symbol to your watchlist and  to view watchlist. Click on any ticker or stock name for detailed market intelligence report for that stock. to view watchlist. Click on any ticker or stock name for detailed market intelligence report for that stock. |
12Stocks.com Performance of Stocks in Biotech Sector
| Ticker | Stock Name | Watchlist | Category | Recent Price | Market Intelligence Score | Change % | YTD Change% |
| ASND | Ascendis Pharma |   | Biotechnology | 142.12 | 31 | 0.44% | 12.84% |
| QSI | Quantum-Si | | Biotechnology | 1.52 | 31 | -7.32% | -24.38% |
| VERA | Vera | | Biotechnology | 40.01 | 31 | -6.01% | 158.46% |
| TSHA | Taysha Gene | | Biotechnology | 2.44 | 31 | -5.24% | 37.08% |
| ALGS | Aligos | | Biotechnology | 0.81 | 31 | -3.23% | 24.06% |
| PRLD | Prelude | | Biotechnology | 4.16 | 31 | -15.27% | -4.37% |
| ANNX | Annexon | | Biotechnology | 4.58 | 31 | -10.46% | 0.44% |
| VCEL | Vericel | | Biotechnology | 46.57 | 31 | -1.98% | 30.78% |
| CNTA | Centessa | | Biotechnology | 10.82 | 31 | -1.90% | 33.91% |
| EYPT | EyePoint | | Biotechnology | 20.94 | 30 | -4.12% | -9.39% |
| VXRT | Vaxart | | Biotechnology | 0.87 | 30 | -3.01% | 51.45% |
| NAUT | Nautilus nology | | Biotechnology | 2.47 | 30 | -1.98% | -24.92% |
| OCS | Oculis Holding | | Biotechnology | 11.99 | 30 | -0.08% | 8.01% |
| ACAD | ACADIA | | Biotechnology | 17.20 | 30 | 0.70% | -45.07% |
| GOSS | Gossamer Bio | | Biotechnology | 0.83 | 28 | 0.55% | -9.56% |
| MLTX | MoonLake Immuno | | Biotechnology | 43.52 | 28 | 0.06% | -30.67% |
| AMGN | Amgen | | Biotechnology | 264.07 | 28 | -0.59% | -8.32% |
| APTO | Aptose | | Biotechnology | 1.27 | 27 | 5.83% | -50.00% |
| REPL | Replimune | | Biotechnology | 7.22 | 27 | 0.98% | -14.35% |
| FGEN | FibroGen | | Biotechnology | 1.26 | 27 | -2.69% | 42.73% |
| AVXL | Anavex Life | | Biotechnology | 4.07 | 27 | -1.33% | -56.34% |
| BCRX | BioCryst | | Biotechnology | 4.59 | 27 | -0.43% | -23.37% |
| WVE | Wave Life | | Biotechnology | 4.79 | 26 | -8.94% | -5.15% |
| CTMX | CytomX | | Biotechnology | 1.76 | 26 | -5.11% | 13.87% |
| PRAX | Praxis Precision | | Biotechnology | 50.59 | 26 | -3.47% | 125.40% |
| To view more stocks, click on Next / Previous arrows or select different range: 0 - 25 , 25 - 50 , 50 - 75 , 75 - 100 , 100 - 125 , 125 - 150 , 150 - 175 , 175 - 200 , 200 - 225 , 225 - 250 , 250 - 275 , 275 - 300 , 300 - 325 , 325 - 350 , 350 - 375 , 375 - 400 | ||
 | Click To Change The Sort Order: By Market Cap or Company Size Performance: Year-to-date, Week and Day |  |
|
Get the most comprehensive stock market coverage daily at 12Stocks.com ➞ Best Stocks Today ➞ Best Stocks Weekly ➞ Best Stocks Year-to-Date ➞ Best Stocks Trends ➞  Best Stocks Today 12Stocks.com Best Nasdaq Stocks ➞ Best S&P 500 Stocks ➞ Best Tech Stocks ➞ Best Biotech Stocks ➞ |
| Detailed Overview of Biotech Stocks |
| Biotech Technical Overview, Leaders & Laggards, Top Biotech ETF Funds & Detailed Biotech Stocks List, Charts, Trends & More |
| Biotech Sector: Technical Analysis, Trends & YTD Performance | |
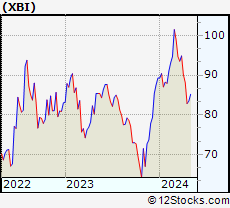
| Biotech sector, as represented by XBI, an exchange-traded fund [ETF] that holds basket of Biotech stocks (e.g, Amgen, Celgene) is down by -4.59% and is currently underperforming the overall market by -9% year-to-date. Below is a quick view of Technical charts and trends: | |
 XBI Weekly Chart |
|
| Long Term Trend: Not Good | |
| Medium Term Trend: Not Good | |
 XBI Daily Chart |
|
| Short Term Trend: Not Good | |
| Overall Trend Score: 0 | |
| YTD Performance: -4.59% | |
| **Trend Scores & Views Are Only For Educational Purposes And Not For Investing | |
| 12Stocks.com: Top Performing Biotech Sector Stocks | ||||||||||||||||||||||||||||||||||||||||||||||||
 The top performing Biotech sector stocks year to date are
Now, more recently, over last week, the top performing Biotech sector stocks on the move are


|
||||||||||||||||||||||||||||||||||||||||||||||||
| 12Stocks.com: Investing in Biotech Sector using Exchange Traded Funds | |
|
The following table shows list of key exchange traded funds (ETF) that
help investors track Biotech Index. For detailed view, check out our ETF Funds section of our website. Quick View: Move mouse or cursor over ETF symbol (ticker) to view short-term Technical chart and over ETF name to view long term chart. Click on ticker or stock name for detailed view. Click on to add stock symbol to your watchlist and to view watchlist. |
12Stocks.com List of ETFs that track Biotech Index
| Ticker | ETF Name | Watchlist | Recent Price | Market Intelligence Score | Change % | Week % | Year-to-date % |
| LABD | Biotech Bear 3X | | 9.83 | 74 | 2.50 | 9.47 | 1.44% |
| XBI | Biotech | | 85.19 | 0 | -1.17 | -3.36 | -4.59% |
| IBB | Biotechnology | | 125.93 | 0 | -0.82 | -2.82 | -7.3% |
| LABU | Biotech Bull 3X | | 94.04 | 0 | -3.35 | -9.88 | -22.9% |
| IYH | Healthcare | | 58.13 | 18 | -0.01 | -0.47 | 1.53% |
| IHF | Healthcare Providers | | 51.07 | 32 | 0.29 | 1.05 | -2.74% |
| IXJ | Global Healthcare | | 87.64 | 25 | 0.00 | -0.39 | 1.06% |
| CURE | Healthcare Bull 3X | | 103.38 | 10 | 0.01 | -0.01 | 1.61% |
| FBT | First NYSE | | 144.59 | 10 | -0.10 | -1.85 | -8.52% |
| BIB | Biotechnology | | 49.55 | 10 | -1.38 | -3.59 | -13.16% |
| PTH | DWA Healthcare Momentum | | 40.57 | 46 | -0.51 | -3.01 | 3.65% |
| BIS | Short Biotech | | 20.39 | 100 | 1.19 | 4.03 | 12.84% |
| BBH | Biotech | | 152.97 | 10 | -0.55 | -2.93 | -7.46% |
| BTEC | Principal Healthcare Innovators | | 34.62 | 18 | -0.67 | -3.81 | -4.71% |
| PBE | Biotech & Genome | | 60.82 | 18 | 0.14 | -0.7 | -7.62% |
| BBC | Bio Biotechnology Clinical | | 25.82 | 36 | -1.00 | -4.81 | 5.59% |
| BBP | Bio Biotechnology Products | | 52.03 | 10 | -1.25 | -2 | -10.43% |
| 12Stocks.com: Charts, Trends, Fundamental Data and Performances of Biotech Stocks | |
|
We now take in-depth look at all Biotech stocks including charts, multi-period performances and overall trends (as measured by market intelligence score). One can sort Biotech stocks (click link to choose) by Daily, Weekly and by Year-to-Date performances. Also, one can sort by size of the company or by market capitalization. |
| Select Your Default Chart Type: | |||||
| |||||
| Click on stock symbol or name for detailed view. Click on to add stock symbol to your watchlist and to view watchlist. Quick View: Move mouse or cursor over "Daily" to quickly view daily Technical stock chart and over "Weekly" to view weekly Technical stock chart. | |||||

 | ASND Ascendis Pharma A/S |
| Sector: Health Care | |
| SubSector: Biotechnology | |
| MarketCap: 5470.35 Millions | |
| Recent Price: 142.12 Market Intelligence Score: 31 | |
| Day Percent Change: 0.44% Day Change: 0.62 | |
| Week Change: -2.68% Year-to-date Change: 12.8% | |
| ASND Links: Profile News Message Board | |
| Charts:- Daily , Weekly | |
| Add ASND to Watchlist: View: Get Complete ASND Trend Analysis ➞ | |
 | QSI Quantum-Si incorporated |
| Sector: Health Care | |
| SubSector: Biotechnology | |
| MarketCap: 256 Millions | |
| Recent Price: 1.52 Market Intelligence Score: 31 | |
| Day Percent Change: -7.32% Day Change: -0.12 | |
| Week Change: -10.06% Year-to-date Change: -24.4% | |
| QSI Links: Profile News Message Board | |
| Charts:- Daily , Weekly | |
| Add QSI to Watchlist: View: Get Complete QSI Trend Analysis ➞ | |
 | VERA Vera Therapeutics, Inc. |
| Sector: Health Care | |
| SubSector: Biotechnology | |
| MarketCap: 746 Millions | |
| Recent Price: 40.01 Market Intelligence Score: 31 | |
| Day Percent Change: -6.01% Day Change: -2.56 | |
| Week Change: -16.59% Year-to-date Change: 158.5% | |
| VERA Links: Profile News Message Board | |
| Charts:- Daily , Weekly | |
| Add VERA to Watchlist: View: Get Complete VERA Trend Analysis ➞ | |
 | TSHA Taysha Gene Therapies, Inc. |
| Sector: Health Care | |
| SubSector: Biotechnology | |
| MarketCap: 76487 Millions | |
| Recent Price: 2.44 Market Intelligence Score: 31 | |
| Day Percent Change: -5.24% Day Change: -0.14 | |
| Week Change: -17.01% Year-to-date Change: 37.1% | |
| TSHA Links: Profile News Message Board | |
| Charts:- Daily , Weekly | |
| Add TSHA to Watchlist: View: Get Complete TSHA Trend Analysis ➞ | |
 | ALGS Aligos Therapeutics, Inc. |
| Sector: Health Care | |
| SubSector: Biotechnology | |
| MarketCap: 76487 Millions | |
| Recent Price: 0.81 Market Intelligence Score: 31 | |
| Day Percent Change: -3.23% Day Change: -0.03 | |
| Week Change: -19.2% Year-to-date Change: 24.1% | |
| ALGS Links: Profile News Message Board | |
| Charts:- Daily , Weekly | |
| Add ALGS to Watchlist: View: Get Complete ALGS Trend Analysis ➞ | |
 | PRLD Prelude Therapeutics Incorporated |
| Sector: Health Care | |
| SubSector: Biotechnology | |
| MarketCap: 26087 Millions | |
| Recent Price: 4.16 Market Intelligence Score: 31 | |
| Day Percent Change: -15.27% Day Change: -0.75 | |
| Week Change: -25.98% Year-to-date Change: -4.4% | |
| PRLD Links: Profile News Message Board | |
| Charts:- Daily , Weekly | |
| Add PRLD to Watchlist: View: Get Complete PRLD Trend Analysis ➞ | |
 | ANNX Annexon, Inc. |
| Sector: Health Care | |
| SubSector: Biotechnology | |
| MarketCap: 94487 Millions | |
| Recent Price: 4.58 Market Intelligence Score: 31 | |
| Day Percent Change: -10.46% Day Change: -0.54 | |
| Week Change: -23.41% Year-to-date Change: 0.4% | |
| ANNX Links: Profile News Message Board | |
| Charts:- Daily , Weekly | |
| Add ANNX to Watchlist: View: Get Complete ANNX Trend Analysis ➞ | |
 | VCEL Vericel Corporation |
| Sector: Health Care | |
| SubSector: Biotechnology | |
| MarketCap: 391.885 Millions | |
| Recent Price: 46.57 Market Intelligence Score: 31 | |
| Day Percent Change: -1.98% Day Change: -0.94 | |
| Week Change: -2.78% Year-to-date Change: 30.8% | |
| VCEL Links: Profile News Message Board | |
| Charts:- Daily , Weekly | |
| Add VCEL to Watchlist: View: Get Complete VCEL Trend Analysis ➞ | |
 | CNTA Centessa Pharmaceuticals plc |
| Sector: Health Care | |
| SubSector: Biotechnology | |
| MarketCap: 616 Millions | |
| Recent Price: 10.82 Market Intelligence Score: 31 | |
| Day Percent Change: -1.90% Day Change: -0.21 | |
| Week Change: -4.42% Year-to-date Change: 33.9% | |
| CNTA Links: Profile News Message Board | |
| Charts:- Daily , Weekly | |
| Add CNTA to Watchlist: View: Get Complete CNTA Trend Analysis ➞ | |
 | EYPT EyePoint Pharmaceuticals, Inc. |
| Sector: Health Care | |
| SubSector: Biotechnology | |
| MarketCap: 125.085 Millions | |
| Recent Price: 20.94 Market Intelligence Score: 30 | |
| Day Percent Change: -4.12% Day Change: -0.90 | |
| Week Change: -8.52% Year-to-date Change: -9.4% | |
| EYPT Links: Profile News Message Board | |
| Charts:- Daily , Weekly | |
| Add EYPT to Watchlist: View: Get Complete EYPT Trend Analysis ➞ | |
 | VXRT Vaxart, Inc. |
| Sector: Health Care | |
| SubSector: Biotechnology | |
| MarketCap: 129.785 Millions | |
| Recent Price: 0.87 Market Intelligence Score: 30 | |
| Day Percent Change: -3.01% Day Change: -0.03 | |
| Week Change: -4.68% Year-to-date Change: 51.5% | |
| VXRT Links: Profile News Message Board | |
| Charts:- Daily , Weekly | |
| Add VXRT to Watchlist: View: Get Complete VXRT Trend Analysis ➞ | |
 | NAUT Nautilus Biotechnology, Inc. |
| Sector: Health Care | |
| SubSector: Biotechnology | |
| MarketCap: 458 Millions | |
| Recent Price: 2.47 Market Intelligence Score: 30 | |
| Day Percent Change: -1.98% Day Change: -0.05 | |
| Week Change: 0% Year-to-date Change: -24.9% | |
| NAUT Links: Profile News Message Board | |
| Charts:- Daily , Weekly | |
| Add NAUT to Watchlist: View: Get Complete NAUT Trend Analysis ➞ | |
 | OCS Oculis Holding AG |
| Sector: Health Care | |
| SubSector: Biotechnology | |
| MarketCap: 460 Millions | |
| Recent Price: 11.99 Market Intelligence Score: 30 | |
| Day Percent Change: -0.08% Day Change: -0.01 | |
| Week Change: 0.29% Year-to-date Change: 8.0% | |
| OCS Links: Profile News Message Board | |
| Charts:- Daily , Weekly | |
| Add OCS to Watchlist: View: Get Complete OCS Trend Analysis ➞ | |
 | ACAD ACADIA Pharmaceuticals Inc. |
| Sector: Health Care | |
| SubSector: Biotechnology | |
| MarketCap: 5400.35 Millions | |
| Recent Price: 17.20 Market Intelligence Score: 30 | |
| Day Percent Change: 0.70% Day Change: 0.12 | |
| Week Change: 0.35% Year-to-date Change: -45.1% | |
| ACAD Links: Profile News Message Board | |
| Charts:- Daily , Weekly | |
| Add ACAD to Watchlist: View: Get Complete ACAD Trend Analysis ➞ | |
 | GOSS Gossamer Bio, Inc. |
| Sector: Health Care | |
| SubSector: Biotechnology | |
| MarketCap: 653.285 Millions | |
| Recent Price: 0.83 Market Intelligence Score: 28 | |
| Day Percent Change: 0.55% Day Change: 0.00 | |
| Week Change: -7.81% Year-to-date Change: -9.6% | |
| GOSS Links: Profile News Message Board | |
| Charts:- Daily , Weekly | |
| Add GOSS to Watchlist: View: Get Complete GOSS Trend Analysis ➞ | |
 | MLTX MoonLake Immunotherapeutics |
| Sector: Health Care | |
| SubSector: Biotechnology | |
| MarketCap: 2670 Millions | |
| Recent Price: 43.52 Market Intelligence Score: 28 | |
| Day Percent Change: 0.06% Day Change: 0.02 | |
| Week Change: -0.88% Year-to-date Change: -30.7% | |
| MLTX Links: Profile News Message Board | |
| Charts:- Daily , Weekly | |
| Add MLTX to Watchlist: View: Get Complete MLTX Trend Analysis ➞ | |
 | AMGN Amgen Inc. |
| Sector: Health Care | |
| SubSector: Biotechnology | |
| MarketCap: 121030 Millions | |
| Recent Price: 264.07 Market Intelligence Score: 28 | |
| Day Percent Change: -0.59% Day Change: -1.57 | |
| Week Change: -1.2% Year-to-date Change: -8.3% | |
| AMGN Links: Profile News Message Board | |
| Charts:- Daily , Weekly | |
| Add AMGN to Watchlist: View: Get Complete AMGN Trend Analysis ➞ | |
 | APTO Aptose Biosciences Inc. |
| Sector: Health Care | |
| SubSector: Biotechnology | |
| MarketCap: 484.585 Millions | |
| Recent Price: 1.27 Market Intelligence Score: 27 | |
| Day Percent Change: 5.83% Day Change: 0.07 | |
| Week Change: -6.62% Year-to-date Change: -50.0% | |
| APTO Links: Profile News Message Board | |
| Charts:- Daily , Weekly | |
| Add APTO to Watchlist: View: Get Complete APTO Trend Analysis ➞ | |
 | REPL Replimune Group, Inc. |
| Sector: Health Care | |
| SubSector: Biotechnology | |
| MarketCap: 367.885 Millions | |
| Recent Price: 7.22 Market Intelligence Score: 27 | |
| Day Percent Change: 0.98% Day Change: 0.07 | |
| Week Change: 1.12% Year-to-date Change: -14.4% | |
| REPL Links: Profile News Message Board | |
| Charts:- Daily , Weekly | |
| Add REPL to Watchlist: View: Get Complete REPL Trend Analysis ➞ | |
 | FGEN FibroGen, Inc. |
| Sector: Health Care | |
| SubSector: Biotechnology | |
| MarketCap: 2502.95 Millions | |
| Recent Price: 1.26 Market Intelligence Score: 27 | |
| Day Percent Change: -2.69% Day Change: -0.04 | |
| Week Change: -6.99% Year-to-date Change: 42.7% | |
| FGEN Links: Profile News Message Board | |
| Charts:- Daily , Weekly | |
| Add FGEN to Watchlist: View: Get Complete FGEN Trend Analysis ➞ | |
 | AVXL Anavex Life Sciences Corp. |
| Sector: Health Care | |
| SubSector: Biotechnology | |
| MarketCap: 175.985 Millions | |
| Recent Price: 4.07 Market Intelligence Score: 27 | |
| Day Percent Change: -1.33% Day Change: -0.05 | |
| Week Change: -5.36% Year-to-date Change: -56.3% | |
| AVXL Links: Profile News Message Board | |
| Charts:- Daily , Weekly | |
| Add AVXL to Watchlist: View: Get Complete AVXL Trend Analysis ➞ | |
 | BCRX BioCryst Pharmaceuticals, Inc. |
| Sector: Health Care | |
| SubSector: Biotechnology | |
| MarketCap: 369.385 Millions | |
| Recent Price: 4.59 Market Intelligence Score: 27 | |
| Day Percent Change: -0.43% Day Change: -0.02 | |
| Week Change: -3.77% Year-to-date Change: -23.4% | |
| BCRX Links: Profile News Message Board | |
| Charts:- Daily , Weekly | |
| Add BCRX to Watchlist: View: Get Complete BCRX Trend Analysis ➞ | |
 | WVE Wave Life Sciences Ltd. |
| Sector: Health Care | |
| SubSector: Biotechnology | |
| MarketCap: 452.785 Millions | |
| Recent Price: 4.79 Market Intelligence Score: 26 | |
| Day Percent Change: -8.94% Day Change: -0.47 | |
| Week Change: -17.41% Year-to-date Change: -5.2% | |
| WVE Links: Profile News Message Board | |
| Charts:- Daily , Weekly | |
| Add WVE to Watchlist: View: Get Complete WVE Trend Analysis ➞ | |
 | CTMX CytomX Therapeutics, Inc. |
| Sector: Health Care | |
| SubSector: Biotechnology | |
| MarketCap: 264.885 Millions | |
| Recent Price: 1.76 Market Intelligence Score: 26 | |
| Day Percent Change: -5.11% Day Change: -0.10 | |
| Week Change: -17.91% Year-to-date Change: 13.9% | |
| CTMX Links: Profile News Message Board | |
| Charts:- Daily , Weekly | |
| Add CTMX to Watchlist: View: Get Complete CTMX Trend Analysis ➞ | |
 | PRAX Praxis Precision Medicines, Inc. |
| Sector: Health Care | |
| SubSector: Biotechnology | |
| MarketCap: 16587 Millions | |
| Recent Price: 50.59 Market Intelligence Score: 26 | |
| Day Percent Change: -3.47% Day Change: -1.82 | |
| Week Change: -8.28% Year-to-date Change: 125.4% | |
| PRAX Links: Profile News Message Board | |
| Charts:- Daily , Weekly | |
| Add PRAX to Watchlist: View: Get Complete PRAX Trend Analysis ➞ | |
| To view more stocks, click on Next / Previous arrows or select different range: 0 - 25 , 25 - 50 , 50 - 75 , 75 - 100 , 100 - 125 , 125 - 150 , 150 - 175 , 175 - 200 , 200 - 225 , 225 - 250 , 250 - 275 , 275 - 300 , 300 - 325 , 325 - 350 , 350 - 375 , 375 - 400 | ||
| Click To Change The Sort Order: By Market Cap or Company Size Performance: Year-to-date, Week and Day | |
| Select Chart Type: | ||
|
Best Stocks Today 12Stocks.com |
© 2024 12Stocks.com Terms & Conditions Privacy Contact Us
All Information Provided Only For Education And Not To Be Used For Investing or Trading. See Terms & Conditions


One More Thing ... Get Best Stocks Delivered Daily!
Never Ever Miss A Move With Our Top Ten Stocks Lists
Find Best Stocks In Any Market - Bull or Bear Market
Take A Peek At Our Top Ten Stocks Lists: Daily, Weekly, Year-to-Date & Top Trends
Find Best Stocks In Any Market - Bull or Bear Market
Take A Peek At Our Top Ten Stocks Lists: Daily, Weekly, Year-to-Date & Top Trends
Biotech Stocks With Best Up Trends [0-bearish to 100-bullish]: Vanda [100], Rani [100], ALX Oncology[100], Reneo [100], ProKidney [100], Cullinan Oncology[100], Abeona [100], Avadel [100], Intra-Cellular Therapies[100], United [93], Theravance Biopharma[90]
Best Biotech Stocks Year-to-Date:
Precision [3050.68%], Inovio [2066.67%], Assembly [1475.42%], Adverum nologies[1443.57%], NuCana [1302.97%], Affimed N.V[732%], Agenus [550.44%], Corbus [516.06%], Mesoblast [357.27%], Janux [346.07%], Addex [274.38%] Best Biotech Stocks This Week:
NuCana [1753.51%], ProKidney [61.71%], Rani [43.89%], Vanda [26.94%], Galera [25.24%], ALX Oncology[23.41%], Intra-Cellular Therapies[16.39%], ADC [12.98%], Karyopharm [12.7%], Avadel [12.45%], Black Diamond[8.78%] Best Biotech Stocks Daily:
Vanda [29.14%], Karyopharm [25.00%], Galera [17.06%], Inovio [14.69%], Rani [13.10%], Lineage Cell[12.17%], ADC [11.71%], Shattuck Labs[11.47%], ALX Oncology[10.97%], Acrivon [9.19%], Cue Biopharma[9.03%]