
 Login Sign Up


| |||||
 |  | ||||

| 12Stocks.com Market Intelligence |
Best Biotech Stocks
|
|
| Quick Read: Best Biotech Stocks List By Performances & Trends: Daily, Weekly, Year-to-Date, Market Cap (Size) & Technical Trends | |||
| Best Biotech Stocks Views: Quick Browse View, Summary & Slide Show View | |||
| 12Stocks.com Biotech Stocks Performances & Trends Daily | |||||||||
|
|  The overall market intelligence score is 49 (0-bearish to 100-bullish) which puts Biotech sector in short term neutral trend. The market intelligence score from previous trading session is 17 and hence an improvement of trend.
| ||||||||
Here are the market intelligence trend scores of the most requested Biotech stocks at 12Stocks.com (click stock name for detailed review):
|


| 12Stocks.com: Investing in Biotech sector with Stocks | |
|
The following table helps investors and traders sort through current performance and trends (as measured by market intelligence score) of various
stocks in the Biotech sector. Quick View: Move mouse or cursor over stock symbol (ticker) to view short-term Technical chart and over stock name to view long term chart. Click on  to add stock symbol to your watchlist and to add stock symbol to your watchlist and  to view watchlist. Click on any ticker or stock name for detailed market intelligence report for that stock. to view watchlist. Click on any ticker or stock name for detailed market intelligence report for that stock. |
12Stocks.com Performance of Stocks in Biotech Sector
| Ticker | Stock Name | Watchlist | Category | Recent Price | Market Intelligence Score | Change % | YTD Change% |
| MORF | Morphic Holding |   | Biotechnology | 27.97 | 32 | -0.36% | -3.15% |
| INBX | Inhibrx | | Biotechnology | 34.16 | 32 | 0.29% | -10.13% |
| RAPT | RAPT | | Biotechnology | 7.88 | 32 | -2.72% | -68.29% |
| MOR | MorphoSys AG | | Biotechnology | 17.36 | 31 | -3.77% | 75.35% |
| SPRB | Spruce | | Biotechnology | 0.71 | 30 | 1.43% | -75.68% |
| KRON | Kronos Bio | | Biotechnology | 1.00 | 30 | 0.00% | -20.00% |
| HRMY | Harmony | | Biotechnology | 29.25 | 28 | -0.24% | -9.41% |
| ARWR | Arrowhead | | Biotechnology | 23.13 | 27 | 4.57% | -24.41% |
| CUE | Cue Biopharma | | Biotechnology | 1.42 | 27 | 4.03% | -46.21% |
| ZNTL | Zentalis | | Biotechnology | 11.42 | 27 | 3.25% | -24.67% |
| DYN | Dyne | | Biotechnology | 25.46 | 27 | 2.95% | 91.43% |
| ABCL | AbCellera Biologics | | Biotechnology | 3.84 | 27 | 2.13% | -32.04% |
| MIST | Milestone | | Biotechnology | 1.57 | 27 | 1.95% | -5.99% |
| VERV | Verve | | Biotechnology | 6.26 | 27 | 1.95% | -55.14% |
| CRSP | CRISPR | | Biotechnology | 54.83 | 27 | 1.71% | -12.41% |
| OABI | OmniAb | | Biotechnology | 4.54 | 27 | 1.57% | -25.08% |
| DVAX | Dynavax Technologies | | Biotechnology | 11.34 | 27 | 1.16% | -18.88% |
| EDIT | Editas Medicine | | Biotechnology | 5.37 | 27 | 0.94% | -46.99% |
| INSM | Insmed | | Biotechnology | 25.00 | 27 | 0.81% | -19.33% |
| GILD | Gilead | | Biotechnology | 65.94 | 27 | 0.79% | -18.60% |
| SVA | Sinovac | | Biotechnology | 6.47 | 27 | 0.00% | 0.00% |
| APTO | Aptose | | Biotechnology | 1.22 | 27 | 0.00% | -51.97% |
| RPTX | Repare | | Biotechnology | 3.20 | 27 | 0.00% | -56.16% |
| VIGL | Vigil Neuroscience | | Biotechnology | 2.60 | 27 | -4.06% | -24.20% |
| CASI | CASI | | Biotechnology | 2.34 | 27 | -3.31% | -67.32% |
| To view more stocks, click on Next / Previous arrows or select different range: 0 - 25 , 25 - 50 , 50 - 75 , 75 - 100 , 100 - 125 , 125 - 150 , 150 - 175 , 175 - 200 , 200 - 225 , 225 - 250 , 250 - 275 , 275 - 300 , 300 - 325 , 325 - 350 , 350 - 375 , 375 - 400 | ||
 | Click To Change The Sort Order: By Market Cap or Company Size Performance: Year-to-date, Week and Day |  |
|
Get the most comprehensive stock market coverage daily at 12Stocks.com ➞ Best Stocks Today ➞ Best Stocks Weekly ➞ Best Stocks Year-to-Date ➞ Best Stocks Trends ➞  Best Stocks Today 12Stocks.com Best Nasdaq Stocks ➞ Best S&P 500 Stocks ➞ Best Tech Stocks ➞ Best Biotech Stocks ➞ |
| Detailed Overview of Biotech Stocks |
| Biotech Technical Overview, Leaders & Laggards, Top Biotech ETF Funds & Detailed Biotech Stocks List, Charts, Trends & More |
| Biotech Sector: Technical Analysis, Trends & YTD Performance | |
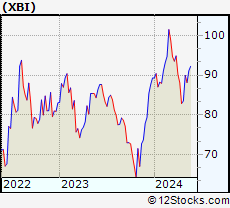
| Biotech sector, as represented by XBI, an exchange-traded fund [ETF] that holds basket of Biotech stocks (e.g, Amgen, Celgene) is down by -4.22% and is currently underperforming the overall market by -10.78% year-to-date. Below is a quick view of Technical charts and trends: | |
 XBI Weekly Chart |
|
| Long Term Trend: Not Good | |
| Medium Term Trend: Not Good | |
 XBI Daily Chart |
|
| Short Term Trend: Very Good | |
| Overall Trend Score: 49 | |
| YTD Performance: -4.22% | |
| **Trend Scores & Views Are Only For Educational Purposes And Not For Investing | |
| 12Stocks.com: Top Performing Biotech Sector Stocks | ||||||||||||||||||||||||||||||||||||||||||||||||
 The top performing Biotech sector stocks year to date are
Now, more recently, over last week, the top performing Biotech sector stocks on the move are


|
||||||||||||||||||||||||||||||||||||||||||||||||
| 12Stocks.com: Investing in Biotech Sector using Exchange Traded Funds | |
|
The following table shows list of key exchange traded funds (ETF) that
help investors track Biotech Index. For detailed view, check out our ETF Funds section of our website. Quick View: Move mouse or cursor over ETF symbol (ticker) to view short-term Technical chart and over ETF name to view long term chart. Click on ticker or stock name for detailed view. Click on to add stock symbol to your watchlist and to view watchlist. |
12Stocks.com List of ETFs that track Biotech Index
| Ticker | ETF Name | Watchlist | Recent Price | Market Intelligence Score | Change % | Week % | Year-to-date % |
| LABD | Biotech Bear 3X | | 9.69 | 30 | -7.89 | -7.89 | 0% |
| XBI | Biotech | | 85.52 | 49 | 2.43 | 2.43 | -4.22% |
| LABU | Biotech Bull 3X | | 94.11 | 42 | 7.54 | 7.54 | -22.84% |
| IBB | Biotechnology | | 128.37 | 42 | 1.49 | 1.49 | -5.51% |
| IYH | Healthcare | | 58.86 | 70 | 0.43 | 0.43 | 2.82% |
| IXJ | Global Healthcare | | 89.47 | 70 | 0.39 | 0.39 | 3.17% |
| BIB | Biotechnology | | 51.77 | 64 | 4.25 | 4.25 | -9.26% |
| IHF | Healthcare Providers | | 52.06 | 65 | 0.27 | 0.27 | -0.86% |
| CURE | Healthcare Bull 3X | | 106.25 | 39 | 0.90 | 0.9 | 4.43% |
| FBT | First NYSE | | 145.65 | 42 | 1.39 | 1.39 | -7.85% |
| BIS | Short Biotech | | 19.55 | 44 | -3.31 | -3.31 | 8.19% |
| PTH | DWA Healthcare Momentum | | 39.88 | 48 | -0.03 | -0.03 | 1.89% |
| PBE | Biotech & Genome | | 61.47 | 57 | 1.81 | 1.81 | -6.64% |
| BTEC | Principal Healthcare Innovators | | 34.84 | 42 | 1.72 | 1.72 | -4.1% |
| BBH | Biotech | | 157.37 | 49 | 1.10 | 1.1 | -4.81% |
| BBP | Bio Biotechnology Products | | 53.55 | 64 | 4.01 | 4.01 | -7.82% |
| BBC | Bio Biotechnology Clinical | | 26.25 | 65 | 2.82 | 2.82 | 7.35% |
| 12Stocks.com: Charts, Trends, Fundamental Data and Performances of Biotech Stocks | |
|
We now take in-depth look at all Biotech stocks including charts, multi-period performances and overall trends (as measured by market intelligence score). One can sort Biotech stocks (click link to choose) by Daily, Weekly and by Year-to-Date performances. Also, one can sort by size of the company or by market capitalization. |
| Select Your Default Chart Type: | |||||
| |||||
| Click on stock symbol or name for detailed view. Click on to add stock symbol to your watchlist and to view watchlist. Quick View: Move mouse or cursor over "Daily" to quickly view daily Technical stock chart and over "Weekly" to view weekly Technical stock chart. | |||||

 | MORF Morphic Holding, Inc. |
| Sector: Health Care | |
| SubSector: Biotechnology | |
| MarketCap: 484.885 Millions | |
| Recent Price: 27.97 Market Intelligence Score: 32 | |
| Day Percent Change: -0.36% Day Change: -0.10 | |
| Week Change: -0.36% Year-to-date Change: -3.2% | |
| MORF Links: Profile News Message Board | |
| Charts:- Daily , Weekly | |
| Add MORF to Watchlist: View: Get Complete MORF Trend Analysis ➞ | |
 | INBX Inhibrx, Inc. |
| Sector: Health Care | |
| SubSector: Biotechnology | |
| MarketCap: 14187 Millions | |
| Recent Price: 34.16 Market Intelligence Score: 32 | |
| Day Percent Change: 0.29% Day Change: 0.10 | |
| Week Change: 0.29% Year-to-date Change: -10.1% | |
| INBX Links: Profile News Message Board | |
| Charts:- Daily , Weekly | |
| Add INBX to Watchlist: View: Get Complete INBX Trend Analysis ➞ | |
 | RAPT RAPT Therapeutics, Inc. |
| Sector: Health Care | |
| SubSector: Biotechnology | |
| MarketCap: 368.785 Millions | |
| Recent Price: 7.88 Market Intelligence Score: 32 | |
| Day Percent Change: -2.72% Day Change: -0.22 | |
| Week Change: -2.72% Year-to-date Change: -68.3% | |
| RAPT Links: Profile News Message Board | |
| Charts:- Daily , Weekly | |
| Add RAPT to Watchlist: View: Get Complete RAPT Trend Analysis ➞ | |
 | MOR MorphoSys AG |
| Sector: Health Care | |
| SubSector: Biotechnology | |
| MarketCap: 2636.85 Millions | |
| Recent Price: 17.36 Market Intelligence Score: 31 | |
| Day Percent Change: -3.77% Day Change: -0.68 | |
| Week Change: -3.77% Year-to-date Change: 75.4% | |
| MOR Links: Profile News Message Board | |
| Charts:- Daily , Weekly | |
| Add MOR to Watchlist: View: Get Complete MOR Trend Analysis ➞ | |
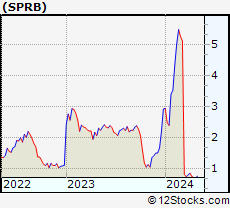 | SPRB Spruce Biosciences, Inc. |
| Sector: Health Care | |
| SubSector: Biotechnology | |
| MarketCap: 49487 Millions | |
| Recent Price: 0.71 Market Intelligence Score: 30 | |
| Day Percent Change: 1.43% Day Change: 0.01 | |
| Week Change: 1.43% Year-to-date Change: -75.7% | |
| SPRB Links: Profile News Message Board | |
| Charts:- Daily , Weekly | |
| Add SPRB to Watchlist: View: Get Complete SPRB Trend Analysis ➞ | |
 | KRON Kronos Bio, Inc. |
| Sector: Health Care | |
| SubSector: Biotechnology | |
| MarketCap: 17287 Millions | |
| Recent Price: 1.00 Market Intelligence Score: 30 | |
| Day Percent Change: 0.00% Day Change: 0.00 | |
| Week Change: 0% Year-to-date Change: -20.0% | |
| KRON Links: Profile News Message Board | |
| Charts:- Daily , Weekly | |
| Add KRON to Watchlist: View: Get Complete KRON Trend Analysis ➞ | |
 | HRMY Harmony Biosciences Holdings, Inc. |
| Sector: Health Care | |
| SubSector: Biotechnology | |
| MarketCap: 24487 Millions | |
| Recent Price: 29.25 Market Intelligence Score: 28 | |
| Day Percent Change: -0.24% Day Change: -0.07 | |
| Week Change: -0.24% Year-to-date Change: -9.4% | |
| HRMY Links: Profile News Message Board | |
| Charts:- Daily , Weekly | |
| Add HRMY to Watchlist: View: Get Complete HRMY Trend Analysis ➞ | |
 | ARWR Arrowhead Pharmaceuticals, Inc. |
| Sector: Health Care | |
| SubSector: Biotechnology | |
| MarketCap: 3226.15 Millions | |
| Recent Price: 23.13 Market Intelligence Score: 27 | |
| Day Percent Change: 4.57% Day Change: 1.01 | |
| Week Change: 4.57% Year-to-date Change: -24.4% | |
| ARWR Links: Profile News Message Board | |
| Charts:- Daily , Weekly | |
| Add ARWR to Watchlist: View: Get Complete ARWR Trend Analysis ➞ | |
 | CUE Cue Biopharma, Inc. |
| Sector: Health Care | |
| SubSector: Biotechnology | |
| MarketCap: 352.785 Millions | |
| Recent Price: 1.42 Market Intelligence Score: 27 | |
| Day Percent Change: 4.03% Day Change: 0.05 | |
| Week Change: 4.03% Year-to-date Change: -46.2% | |
| CUE Links: Profile News Message Board | |
| Charts:- Daily , Weekly | |
| Add CUE to Watchlist: View: Get Complete CUE Trend Analysis ➞ | |
 | ZNTL Zentalis Pharmaceuticals, Inc. |
| Sector: Health Care | |
| SubSector: Biotechnology | |
| MarketCap: 22187 Millions | |
| Recent Price: 11.42 Market Intelligence Score: 27 | |
| Day Percent Change: 3.25% Day Change: 0.36 | |
| Week Change: 3.25% Year-to-date Change: -24.7% | |
| ZNTL Links: Profile News Message Board | |
| Charts:- Daily , Weekly | |
| Add ZNTL to Watchlist: View: Get Complete ZNTL Trend Analysis ➞ | |
 | DYN Dyne Therapeutics, Inc. |
| Sector: Health Care | |
| SubSector: Biotechnology | |
| MarketCap: 88487 Millions | |
| Recent Price: 25.46 Market Intelligence Score: 27 | |
| Day Percent Change: 2.95% Day Change: 0.73 | |
| Week Change: 2.95% Year-to-date Change: 91.4% | |
| DYN Links: Profile News Message Board | |
| Charts:- Daily , Weekly | |
| Add DYN to Watchlist: View: Get Complete DYN Trend Analysis ➞ | |
 | ABCL AbCellera Biologics Inc. |
| Sector: Health Care | |
| SubSector: Biotechnology | |
| MarketCap: 1870 Millions | |
| Recent Price: 3.84 Market Intelligence Score: 27 | |
| Day Percent Change: 2.13% Day Change: 0.08 | |
| Week Change: 2.13% Year-to-date Change: -32.0% | |
| ABCL Links: Profile News Message Board | |
| Charts:- Daily , Weekly | |
| Add ABCL to Watchlist: View: Get Complete ABCL Trend Analysis ➞ | |
 | MIST Milestone Pharmaceuticals Inc. |
| Sector: Health Care | |
| SubSector: Biotechnology | |
| MarketCap: 342.685 Millions | |
| Recent Price: 1.57 Market Intelligence Score: 27 | |
| Day Percent Change: 1.95% Day Change: 0.03 | |
| Week Change: 1.95% Year-to-date Change: -6.0% | |
| MIST Links: Profile News Message Board | |
| Charts:- Daily , Weekly | |
| Add MIST to Watchlist: View: Get Complete MIST Trend Analysis ➞ | |
 | VERV Verve Therapeutics, Inc. |
| Sector: Health Care | |
| SubSector: Biotechnology | |
| MarketCap: 1200 Millions | |
| Recent Price: 6.26 Market Intelligence Score: 27 | |
| Day Percent Change: 1.95% Day Change: 0.12 | |
| Week Change: 1.95% Year-to-date Change: -55.1% | |
| VERV Links: Profile News Message Board | |
| Charts:- Daily , Weekly | |
| Add VERV to Watchlist: View: Get Complete VERV Trend Analysis ➞ | |
 | CRSP CRISPR Therapeutics AG |
| Sector: Health Care | |
| SubSector: Biotechnology | |
| MarketCap: 2691.35 Millions | |
| Recent Price: 54.83 Market Intelligence Score: 27 | |
| Day Percent Change: 1.71% Day Change: 0.92 | |
| Week Change: 1.71% Year-to-date Change: -12.4% | |
| CRSP Links: Profile News Message Board | |
| Charts:- Daily , Weekly | |
| Add CRSP to Watchlist: View: Get Complete CRSP Trend Analysis ➞ | |
 | OABI OmniAb, Inc. |
| Sector: Health Care | |
| SubSector: Biotechnology | |
| MarketCap: 570 Millions | |
| Recent Price: 4.54 Market Intelligence Score: 27 | |
| Day Percent Change: 1.57% Day Change: 0.07 | |
| Week Change: 1.57% Year-to-date Change: -25.1% | |
| OABI Links: Profile News Message Board | |
| Charts:- Daily , Weekly | |
| Add OABI to Watchlist: View: Get Complete OABI Trend Analysis ➞ | |
 | DVAX Dynavax Technologies Corporation |
| Sector: Health Care | |
| SubSector: Biotechnology | |
| MarketCap: 276.885 Millions | |
| Recent Price: 11.34 Market Intelligence Score: 27 | |
| Day Percent Change: 1.16% Day Change: 0.13 | |
| Week Change: 1.16% Year-to-date Change: -18.9% | |
| DVAX Links: Profile News Message Board | |
| Charts:- Daily , Weekly | |
| Add DVAX to Watchlist: View: Get Complete DVAX Trend Analysis ➞ | |
 | EDIT Editas Medicine, Inc. |
| Sector: Health Care | |
| SubSector: Biotechnology | |
| MarketCap: 1194.95 Millions | |
| Recent Price: 5.37 Market Intelligence Score: 27 | |
| Day Percent Change: 0.94% Day Change: 0.05 | |
| Week Change: 0.94% Year-to-date Change: -47.0% | |
| EDIT Links: Profile News Message Board | |
| Charts:- Daily , Weekly | |
| Add EDIT to Watchlist: View: Get Complete EDIT Trend Analysis ➞ | |
 | INSM Insmed Incorporated |
| Sector: Health Care | |
| SubSector: Biotechnology | |
| MarketCap: 1452.45 Millions | |
| Recent Price: 25.00 Market Intelligence Score: 27 | |
| Day Percent Change: 0.81% Day Change: 0.20 | |
| Week Change: 0.81% Year-to-date Change: -19.3% | |
| INSM Links: Profile News Message Board | |
| Charts:- Daily , Weekly | |
| Add INSM to Watchlist: View: Get Complete INSM Trend Analysis ➞ | |
 | GILD Gilead Sciences, Inc. |
| Sector: Health Care | |
| SubSector: Biotechnology | |
| MarketCap: 99485.6 Millions | |
| Recent Price: 65.94 Market Intelligence Score: 27 | |
| Day Percent Change: 0.79% Day Change: 0.52 | |
| Week Change: 0.79% Year-to-date Change: -18.6% | |
| GILD Links: Profile News Message Board | |
| Charts:- Daily , Weekly | |
| Add GILD to Watchlist: View: Get Complete GILD Trend Analysis ➞ | |
 | SVA Sinovac Biotech Ltd. |
| Sector: Health Care | |
| SubSector: Biotechnology | |
| MarketCap: 336.88 Millions | |
| Recent Price: 6.47 Market Intelligence Score: 27 | |
| Day Percent Change: 0.00% Day Change: 0.00 | |
| Week Change: 0% Year-to-date Change: 0.0% | |
| SVA Links: Profile News Message Board | |
| Charts:- Daily , Weekly | |
| Add SVA to Watchlist: View: Get Complete SVA Trend Analysis ➞ | |
 | APTO Aptose Biosciences Inc. |
| Sector: Health Care | |
| SubSector: Biotechnology | |
| MarketCap: 484.585 Millions | |
| Recent Price: 1.22 Market Intelligence Score: 27 | |
| Day Percent Change: 0.00% Day Change: 0.00 | |
| Week Change: 0% Year-to-date Change: -52.0% | |
| APTO Links: Profile News Message Board | |
| Charts:- Daily , Weekly | |
| Add APTO to Watchlist: View: Get Complete APTO Trend Analysis ➞ | |
 | RPTX Repare Therapeutics Inc. |
| Sector: Health Care | |
| SubSector: Biotechnology | |
| MarketCap: 13687 Millions | |
| Recent Price: 3.20 Market Intelligence Score: 27 | |
| Day Percent Change: 0.00% Day Change: 0.00 | |
| Week Change: 0% Year-to-date Change: -56.2% | |
| RPTX Links: Profile News Message Board | |
| Charts:- Daily , Weekly | |
| Add RPTX to Watchlist: View: Get Complete RPTX Trend Analysis ➞ | |
 | VIGL Vigil Neuroscience, Inc. |
| Sector: Health Care | |
| SubSector: Biotechnology | |
| MarketCap: 339 Millions | |
| Recent Price: 2.60 Market Intelligence Score: 27 | |
| Day Percent Change: -4.06% Day Change: -0.11 | |
| Week Change: -4.06% Year-to-date Change: -24.2% | |
| VIGL Links: Profile News Message Board | |
| Charts:- Daily , Weekly | |
| Add VIGL to Watchlist: View: Get Complete VIGL Trend Analysis ➞ | |
 | CASI CASI Pharmaceuticals, Inc. |
| Sector: Health Care | |
| SubSector: Biotechnology | |
| MarketCap: 210.085 Millions | |
| Recent Price: 2.34 Market Intelligence Score: 27 | |
| Day Percent Change: -3.31% Day Change: -0.08 | |
| Week Change: -3.31% Year-to-date Change: -67.3% | |
| CASI Links: Profile News Message Board | |
| Charts:- Daily , Weekly | |
| Add CASI to Watchlist: View: Get Complete CASI Trend Analysis ➞ | |
| To view more stocks, click on Next / Previous arrows or select different range: 0 - 25 , 25 - 50 , 50 - 75 , 75 - 100 , 100 - 125 , 125 - 150 , 150 - 175 , 175 - 200 , 200 - 225 , 225 - 250 , 250 - 275 , 275 - 300 , 300 - 325 , 325 - 350 , 350 - 375 , 375 - 400 | ||
| Click To Change The Sort Order: By Market Cap or Company Size Performance: Year-to-date, Week and Day | |
| Select Chart Type: | ||
|
Best Stocks Today 12Stocks.com |
© 2024 12Stocks.com Terms & Conditions Privacy Contact Us
All Information Provided Only For Education And Not To Be Used For Investing or Trading. See Terms & Conditions


One More Thing ... Get Best Stocks Delivered Daily!
Never Ever Miss A Move With Our Top Ten Stocks Lists
Find Best Stocks In Any Market - Bull or Bear Market
Take A Peek At Our Top Ten Stocks Lists: Daily, Weekly, Year-to-Date & Top Trends
Find Best Stocks In Any Market - Bull or Bear Market
Take A Peek At Our Top Ten Stocks Lists: Daily, Weekly, Year-to-Date & Top Trends
Biotech Stocks With Best Up Trends [0-bearish to 100-bullish]: Deciphera [100], Mesoblast [100], PTC [100], Day One[100], Agenus [100], Cullinan Oncology[100], Xencor [100], Zura Bio[100], Verrica [100], Agios [100], Shattuck Labs[100]
Best Biotech Stocks Year-to-Date:
Pieris [6334.07%], Avenue [2707.45%], Precision [2595.89%], Inovio [2154.9%], Assembly [1472.98%], Agenus [1441.25%], NuCana [1252.27%], Adverum nologies[1165.94%], Affimed N.V[778.4%], Mesoblast [545.45%], Corbus [490.07%] Best Biotech Stocks This Week:
Deciphera [72.56%], Vaxxinity [31.65%], Acrivon [18.2%], Janux [18.18%], Ocean Biomedical[17.16%], Ginkgo Bioworks[15.08%], Codexis [14.66%], Exscientia [14.5%], Mesoblast [13.78%], PTC [12.5%], Nektar [10.61%] Best Biotech Stocks Daily:
Deciphera [72.56%], Vaxxinity [31.65%], Acrivon [18.20%], Janux [18.18%], Ocean Biomedical[17.16%], Ginkgo Bioworks[15.08%], Codexis [14.66%], Exscientia [14.50%], Mesoblast [13.78%], PTC [12.50%], Nektar [10.61%]