12Stocks.com
Market
Intelligence

Stock Charts, Performance & Trend Analysis for PSL
PowerShares Dyn Consumer Staples

PSL
Year-to-Date: 8.5%
This Week: 2.3%
PSL Stock Charts
See Daily ➞
See Weekly ➞
See Monthly ➞

PSL
Year-to-Date (YTD) Return: 8.53%
 
All about FANG Stocks ➞
Popular Trends!AAPL ➞ MSFT ➞ TSLA ➞
S&P 500 ➞ AMZN ➞ GOOGL ➞ FB ➞
Long Term Trend: Good
Medium Term Trend: Very Good
Short Term Trend: Not Good
Dyn
Overall Trend Score:
70 Out Of 100
Bottomline: Neutral to Bullish Trend


Get YOUR Stock Review:

September 2, 2025 - The year-to-date (YTD) performance of Dyn Consumer Staples (PSL) ETF is up 8.53% and is outperforming the overall stock market by 2.01%.

Recently, the weekly returns of Dyn Consumer Staples (PSL) is up 2.29% and is outperforming the overall market by 2.98%.

New! 12Stocks.com introduces Big Monthly, Weekly & Daily Charts
View PSL Stock Charts      Daily    Weekly    Monthly

Although long and mid term trends for PowerShares Dyn Consumer Staples looks good, the short term trends are deteriorating.

The overall 12Stocks.com Smart Investing & Trading Score is 70 (measures stock trend from 0-bearish to 100-bullish) which puts PSL in short term neutral to bullish trend.

The Smart Investing & Trading Score from previous trading session is 80 and hence a deterioration of trend. Scroll down for key technical charts, support & resistance levels and analysis for Dyn.

Stock Analysis for PSL
Name: PowerShares Dyn Consumer Staples
Sector:
SubSector:
In A Glance
PSL Technical Trend Chart View

Daily PSL Technical Chart
Add PSL To Watch List   View List
12Stocks.com
Short Term Trend Analysis for
70 / 100
The current technical trend score is 70 in a scale where 0 is bearish and 100 is bullish.
The technical trend score from previous session is 80.
Trend score updated daily. Not to be used for investing.
Recent Price: 111.97    
MarketCap: Millions
Day Percent Change: 0.04%
Day Change: 0.05
Week Change: 2.29%
Year-to-date Change: 8.53%

Technical Levels: For the trading inclined, the following are the key levels of resistance (ceiling) and support (floor) for PSL. Ceiling and floor levels are stock prices at which the stock trend gets resistance or support respectively and traders have an eye on them. Long term levels are more important. Stocks that have broken thru their resistance or supports convincingly tend to have stronger trends (confirm with charts above visually).
Key Levels for PSL
 Short TermWeeklyLong Term
Resistance (Ceiling)113.33112.15111.38
Support (Floor)113.08110.56108.1

The table below shows stocks similar to PowerShares Dyn Consumer Staples, i.e, from same subsector or sector along with year-to-date (YTD), weekly & daily performaces for comparison. Usually, stocks from similar sector tend to move together but companies that have innovative products, services or good management tend to outperform. Quick View: Move mouse or cursor over stock symbol (ticker) to view short-term technical chart and over stock name to view long term chart. Click on ticker or stock name for detailed view. Click on to add stock symbol to your watchlist and to view watchlist.
TickerStock NameWatchlistCategoryRecent PriceChange %Weekly Change%YTD Change%
PGThe Procter & Gamble Company Staples157.990.60.6-3.55%
TMToyota Motor Corporation Auto194.57-0.962.493.36%
KOThe Coca-Cola Company Food69.060.10.110.37%
PEPPepsiCo, Inc. Food150.281.11.11.71%
ULThe Unilever Group Staples63.20-0.462.5813.47%
NKENIKE, Inc. Retail74.29-3.98-3.98-2.26%
PMPhilip Morris International Inc. Tobacco167.40.160.1630.68%
AVOMission Produce, Inc. Agriculture12.510.963.28-12.25%
TSLATesla, Inc. Auto329.36-1.35-1.35-18.6%
BUDAnheuser-Busch InBev SA/NV Food62.67-0.053.9227.97%
BTIBritish American Tobacco p.l.c. Tobacco56.890.443.2268.84%
ACIAlbertsons Companies, Inc. Retail19.46-1.272.11.25%
MOAltria Group, Inc. Tobacco67.13-0.12-0.1233.11%
MDLZMondelez International, Inc. Food61.790.570.578.05%
DEODiageo plc Food111.83-0.743.33-8.65%
ELThe Estee Lauder Companies Inc. Staples90.36-1.49-1.499.39%
CLColgate-Palmolive Company Staples84.390.380.38-1.53%
KVUEKenvue Inc. Household & Personal Products20.740.140.14-0.76%
KMBKimberly-Clark Corporation Staples128.36-0.6-0.60.58%
HMCHonda Motor Co., Ltd. Auto33.40-1.742.0221.75%
NWSNEWS CORP INC Consumer Staples33.26-1.8-1.85.43%
ABEVAmbev S.A. Food2.2400.4621.88%
LSFLaird Superfood, Inc. Consumer Goods5.79-3.95-6.82-28.93%
KDPKeurig Dr Pepper Inc. Food28.86-0.79-0.79-8.85%
GISGeneral Mills, Inc. Food48.97-0.73-0.73-16.73%
You can find complete coverage in the following
Related Pages: 2025 Best Performing Stocks, 2025 Best Performing ETF Funds

Technical Levels: For the trading inclined, the following are the key levels of resistance (ceiling) and support (floor) for PSL. Ceiling and floor levels are stock prices at which the stock trend gets resistance or support respectively. Stocks & their trends tend to pause at these levels and hence traders have an eye on them.

Long term levels are more important. Stocks that have broken thru their resistance or support levels convincingly tend to have stronger trends (confirm with charts above visually).
Key Technical Levels for PSL
 Short TermWeeklyLong Term
Resistance (Ceiling)113.33112.15111.38
Support (Floor)113.08110.56108.1

        
RELATIVE PERFORMANCE OF
PowerShares Dyn Consumer Staples
Vs
THE MARKET
Relative performance of PowerShares Dyn Consumer Staples
How is PSL faring versus the market [S&P 500] ? Is it lagging or leading ? How is its relative performance ?
Symbol Day Change Week Change Year-to-Date Change
VTI -0.69% -0.69% 6.52%
PSL 0.04% 2.29% 8.53%

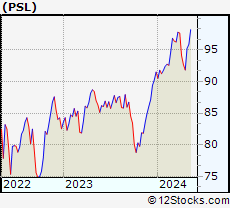
PSL Daily Chart

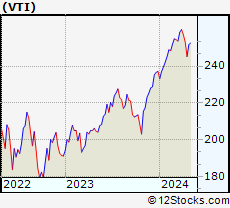
Total Market Daily Chart
Year to date returns, PSL is outperforming the market by 2.01%
This week, PSL is outperforming the market by 2.98%


List Of ETF Funds Similar To PowerShares Dyn Consumer Staples

The table below shows ETFs (Exchange Traded Funds) similar to PowerShares Dyn Consumer Staples, i.e, from same sector along with year-to-date (YTD), weekly & daily performaces for comparison. Usually, ETFs and associated stocks from similar sector tend to move together but companies that have innovative products, services or good management tend to outperform. Move mouse or cursor over ETF symbol to view short-term technical chart and over ETF name to view long term chart. Click on to add ETF symbol to your watchlist and to view watchlist.
TickerStock NameWatchlistCategoryRecent PriceChange %Weekly Change%YTD Change%
IWOiShares Russell 2000 Growth  General307.700.51-1.113.5%
IWPiShares Russell Midcap Growth Index General142.91-0.27-0.3810.06%
XLPConsumer Staples SPDR Consumer Staples80.78-0.10.455.59%
KXIiShares Global Consumer Staples  Consumer Staples65.67-1.161.2511.78%
IYKiShares US Cons Goods Consumer Staples70.34-0.082.4210.27%
PBJPowerShares Food Consumer Staples47.43-0.21.364.64%
KXIiShares Global Consumer Staples  Consumer Staples65.67-1.161.2511.78%
VDCVanguard Consumer Staples VIPERs Consumer Staples219.09-1.140.596.53%
Get the most comprehensive stock market coverage daily at 12Stocks.com ➞
Best Stocks Today ➞
Best Stocks Weekly ➞
Best Stocks Year-to-Date ➞
Best Stocks Trends ➞


Best Stocks Today
12Stocks.com


Best Nasdaq Stocks ➞
Best S&P 500 Stocks ➞
Best Tech Stocks ➞
Best Biotech Stocks ➞
 

© 2025 12Stocks.com       Terms & Conditions   Privacy   Contact Us
All Information Provided Only For Education And Not To Be Used For Investing or Trading. See Terms & Conditions

 WatchListmy12Stocks
Best Stocks Today