
![]()
Stocks with best trends & most momentum Starts at $49.99/Mo Subscribe ➞
| Terms & Conditions | Follow @DozenStocks | 12Stocks.com - Best Performing Stocks |
|
 Login Sign Up


| |||||
 |  | ||||
| 12Stocks.com Market Intelligence |
Best United Kingdom Stocks
 | "Discover best U.K stocks with 12Stocks.com" |
| - Subu Vdaygiri, Founder, 12Stocks.com |
|
|
| Quick Read: Top United Kingdom Stocks By Performances & Trends: Daily, Weekly, Year-to-Date, Market Cap (Size) & Technical Trends | |||
| Best United Kingdom Views: Quick Browse View, Summary & Slide Show | |||
| 12Stocks.com United Kingdom Stocks Performances & Trends Daily | |||||||||
|
|  The overall market intelligence score is 100 (0-bearish to 100-bullish) which puts United Kingdom index in short term bullish trend. The market intelligence score from previous trading session is 93 and an improvement of trend continues.
| ||||||||
Here are the market intelligence trend scores of the most requested United Kingdom stocks at 12Stocks.com (click stock name for detailed review):
| ||||||||||||||||||
| Scroll down this page for most comprehensive review of United Kingdom stocks by performance, trends, technical analysis, charts, fund plays & more | ||||||||||||||||||


| 12Stocks.com: Top Performing United Kingdom Index Stocks | ||||||||||||||||||||||||||||||||||||||||||||||||
 The top performing United Kingdom Index stocks year to date are
Now, more recently, over last week, the top performing United Kingdom Index stocks on the move are


|
||||||||||||||||||||||||||||||||||||||||||||||||
| 12Stocks.com: Investing in United Kingdom Index with Stocks | |
|
The following table helps investors and traders sort through current performance and trends (as measured by market intelligence score) of various
stocks in the United Kingdom Index. Quick View: Move mouse or cursor over stock symbol (ticker) to view short-term technical chart and over stock name to view long term chart. Click on  to add stock symbol to your watchlist and to add stock symbol to your watchlist and  to view watchlist. Click on any ticker or stock name for detailed market intelligence report for that stock. to view watchlist. Click on any ticker or stock name for detailed market intelligence report for that stock. |
12Stocks.com Performance of Stocks in United Kingdom Index
| Ticker | Stock Name | Watchlist | Category | Recent Price | Market Intelligence Score | Change % | YTD Change% |
| EXAI | Exscientia |   | Health Care | 4.62 | 39 | 14.50 | -28.59% |
| RNLX | Renalytix AI | | Health Care | 0.67 | 63 | 7.30 | 72.56% |
| KNOP | KNOT Offshore | | Transports | 5.35 | 67 | 7.21 | -7.12% |
| AKTX | Akari | | Health Care | 1.27 | 34 | 7.17 | -59.29% |
| VVPR | VivoPower | | Technology | 3.89 | 88 | 6.87 | 103.66% |
| ADAP | Adaptimmune | | Health Care | 1.15 | 80 | 6.51 | 44.39% |
| SGHC | Super | | Services & Goods | 3.15 | 39 | 4.65 | -1.41% |
| CNTA | Centessa | | Health Care | 9.30 | 68 | 4.09 | 15.10% |
| BCYC | Bicycle | | Health Care | 23.62 | 83 | 3.92 | 30.64% |
| RNW | ReNew Energy | | Utilities | 5.72 | 42 | 3.91 | -25.52% |
| CNHI | CNH Industrial | | Industrials | 11.73 | 42 | 2.80 | -3.69% |
| PUK | Prudential | | Financials | 18.80 | 67 | 2.68 | -16.26% |
| MANU | Manchester United | | Services & Goods | 16.44 | 69 | 2.30 | -19.33% |
| IHS | IHS Holding | | Services & Goods | 3.61 | 69 | 2.27 | -21.52% |
| LXFR | Luxfer | | Industrials | 9.94 | 68 | 2.16 | 11.19% |
| CMPS | COMPASS Pathways | | Health Care | 8.10 | 17 | 2.02 | -7.32% |
| SLN | Silence | | Health Care | 21.92 | 5 | 1.46 | 24.86% |
| PSFE | Paysafe | | Technology | 14.65 | 25 | 1.31 | 13.57% |
| LIVN | LivaNova | | Health Care | 56.24 | 93 | 1.28 | 8.70% |
| GSK | GlaxoSmithKline | | Health Care | 41.61 | 95 | 1.22 | 12.28% |
| NGG | National Grid | | Utilities | 67.12 | 80 | 1.22 | -1.28% |
| VOD | Vodafone | | Technology | 8.72 | 93 | 1.16 | 0.23% |
| RIO | Rio Tinto | | Materials | 69.01 | 74 | 1.13 | -7.32% |
| NCNA | NuCana | | Health Care | 4.04 | 83 | 1.00 | NA |
| BTI | British American | | Consumer Staples | 29.53 | 73 | 0.96 | 0.82% |
| To view more stocks, click on Next / Previous arrows or select different range: 0 - 25 , 25 - 50 , 50 - 75 | ||
 | Click To Change The Sort Order: By Market Cap or Company Size Performance: Year-to-date, Week and Day |  |
| Detailed Overview Of United Kingdom Stocks |
| United Kingdom Technical Overview, Leaders & Laggards, Top United Kingdom ETF Funds & Detailed United Kingdom Stocks List, Charts, Trends & More |
| United Kingdom: Technical Analysis, Trends & YTD Performance | |
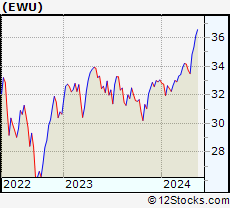
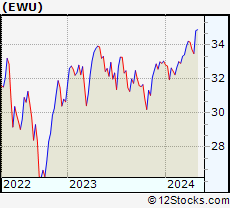
 EWU Weekly Chart |
|
| Long Term Trend: Very Good | |
| Medium Term Trend: Very Good | |
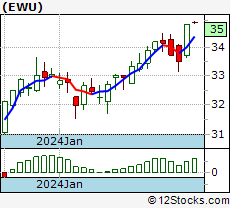
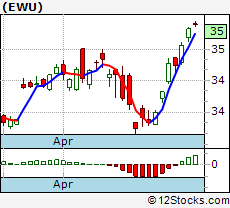 EWU Daily Chart |
|
| Short Term Trend: Very Good | |
| Overall Trend Score: 100 | |
| YTD Performance: 5.84% | |
| **Trend Scores & Views Are Only For Educational Purposes And Not For Investing | |
| 12Stocks.com: Investing in United Kingdom Index using Exchange Traded Funds | |
|
The following table shows list of key exchange traded funds (ETF) that
help investors play United Kingdom stock market. For detailed view, check out our ETF Funds section of our website. Quick View: Move mouse or cursor over ETF symbol (ticker) to view short-term technical chart and over ETF name to view long term chart. Click on ticker or stock name for detailed view. Click on to add stock symbol to your watchlist and to view watchlist. |
12Stocks.com List of ETFs that track United Kingdom Index
| Ticker | ETF Name | Watchlist | Recent Price | Market Intelligence Score | Change % | Week % | Year-to-date % |
| EWU | United Kingdom | | 34.98 | 100 | 0.43 | 0.43 | 5.84% |
| EWUS | United Kingdom Small-Cap | | 34.84 | 93 | 1.40 | 1.4 | 0.36% |
| FKU | United Kingdom AlphaDEX | | 37.17 | 93 | 0.97 | 0.97 | 1.39% |
| FXB | British Pound Ster | | 120.99 | 64 | 0.57 | 0.57 | -1.47% |
| IEV | Europe | | 55.14 | 100 | 0.16 | 0.16 | 4.31% |
| EURL | Europe Bull 3X | | 25.03 | 95 | 0.79 | 0.79 | 5.57% |
| EPV | Short Europe | | 8.02 | 5 | -0.43 | -0.43 | -6.64% |
| 12Stocks.com: Charts, Trends, Fundamental Data and Performances of United Kingdom Stocks | |
|
We now take in-depth look at all United Kingdom stocks including charts, multi-period performances and overall trends (as measured by market intelligence score). One can sort United Kingdom stocks (click link to choose) by Daily, Weekly and by Year-to-Date performances. Also, one can sort by size of the company or by market capitalization. |
| Select Your Default Chart Type: | |||||
| |||||
| Click on stock symbol or name for detailed view. Click on to add stock symbol to your watchlist and to view watchlist. Quick View: Move mouse or cursor over "Daily" to quickly view daily technical stock chart and over "Weekly" to view weekly technical stock chart. | |||||
 | EXAI Exscientia plc |
| Sector: Health Care | |
| SubSector: Biotechnology | |
| MarketCap: 796 Millions | |
| Recent Price: 4.62 Market Intelligence Score: 39 | |
| Day Percent Change: 14.50% Day Change: 0.58 | |
| Week Change: 14.5% Year-to-date Change: -28.6% | |
| EXAI Links: Profile News Message Board | |
| Charts:- Daily , Weekly | |
| Add EXAI to Watchlist: View: Get Complete EXAI Trend Analysis ➞ | |
 | RNLX Renalytix AI plc |
| Sector: Health Care | |
| SubSector: Diagnostics & Research | |
| MarketCap: 45487 Millions | |
| Recent Price: 0.67 Market Intelligence Score: 63 | |
| Day Percent Change: 7.30% Day Change: 0.05 | |
| Week Change: 7.3% Year-to-date Change: 72.6% | |
| RNLX Links: Profile News Message Board | |
| Charts:- Daily , Weekly | |
| Add RNLX to Watchlist: View: Get Complete RNLX Trend Analysis ➞ | |
 | KNOP KNOT Offshore Partners LP |
| Sector: Transports | |
| SubSector: Shipping | |
| MarketCap: 349.214 Millions | |
| Recent Price: 5.35 Market Intelligence Score: 67 | |
| Day Percent Change: 7.21% Day Change: 0.36 | |
| Week Change: 7.21% Year-to-date Change: -7.1% | |
| KNOP Links: Profile News Message Board | |
| Charts:- Daily , Weekly | |
| Add KNOP to Watchlist: View: Get Complete KNOP Trend Analysis ➞ | |
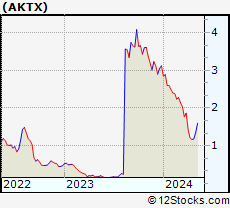 | AKTX Akari Therapeutics, Plc |
| Sector: Health Care | |
| SubSector: Biotechnology | |
| MarketCap: 38.8785 Millions | |
| Recent Price: 1.27 Market Intelligence Score: 34 | |
| Day Percent Change: 7.17% Day Change: 0.08 | |
| Week Change: 7.17% Year-to-date Change: -59.3% | |
| AKTX Links: Profile News Message Board | |
| Charts:- Daily , Weekly | |
| Add AKTX to Watchlist: View: Get Complete AKTX Trend Analysis ➞ | |
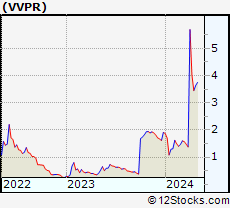 | VVPR VivoPower International PLC |
| Sector: Technology | |
| SubSector: Semiconductor - Specialized | |
| MarketCap: 9.6066 Millions | |
| Recent Price: 3.89 Market Intelligence Score: 88 | |
| Day Percent Change: 6.87% Day Change: 0.25 | |
| Week Change: 6.87% Year-to-date Change: 103.7% | |
| VVPR Links: Profile News Message Board | |
| Charts:- Daily , Weekly | |
| Add VVPR to Watchlist: View: Get Complete VVPR Trend Analysis ➞ | |
 | ADAP Adaptimmune Therapeutics plc |
| Sector: Health Care | |
| SubSector: Biotechnology | |
| MarketCap: 380.985 Millions | |
| Recent Price: 1.15 Market Intelligence Score: 80 | |
| Day Percent Change: 6.51% Day Change: 0.07 | |
| Week Change: 6.51% Year-to-date Change: 44.4% | |
| ADAP Links: Profile News Message Board | |
| Charts:- Daily , Weekly | |
| Add ADAP to Watchlist: View: Get Complete ADAP Trend Analysis ➞ | |
 | SGHC Super Group (SGHC) Limited |
| Sector: Services & Goods | |
| SubSector: Gambling | |
| MarketCap: 1390 Millions | |
| Recent Price: 3.15 Market Intelligence Score: 39 | |
| Day Percent Change: 4.65% Day Change: 0.14 | |
| Week Change: 4.65% Year-to-date Change: -1.4% | |
| SGHC Links: Profile News Message Board | |
| Charts:- Daily , Weekly | |
| Add SGHC to Watchlist: View: Get Complete SGHC Trend Analysis ➞ | |
 | CNTA Centessa Pharmaceuticals plc |
| Sector: Health Care | |
| SubSector: Biotechnology | |
| MarketCap: 616 Millions | |
| Recent Price: 9.30 Market Intelligence Score: 68 | |
| Day Percent Change: 4.09% Day Change: 0.37 | |
| Week Change: 4.09% Year-to-date Change: 15.1% | |
| CNTA Links: Profile News Message Board | |
| Charts:- Daily , Weekly | |
| Add CNTA to Watchlist: View: Get Complete CNTA Trend Analysis ➞ | |
 | BCYC Bicycle Therapeutics plc |
| Sector: Health Care | |
| SubSector: Biotechnology | |
| MarketCap: 214.485 Millions | |
| Recent Price: 23.62 Market Intelligence Score: 83 | |
| Day Percent Change: 3.92% Day Change: 0.89 | |
| Week Change: 3.92% Year-to-date Change: 30.6% | |
| BCYC Links: Profile News Message Board | |
| Charts:- Daily , Weekly | |
| Add BCYC to Watchlist: View: Get Complete BCYC Trend Analysis ➞ | |
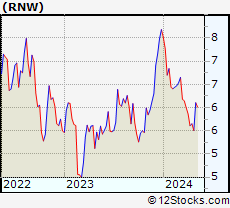 | RNW ReNew Energy Global Plc |
| Sector: Utilities | |
| SubSector: Utilities - Renewable | |
| MarketCap: 1500 Millions | |
| Recent Price: 5.72 Market Intelligence Score: 42 | |
| Day Percent Change: 3.91% Day Change: 0.21 | |
| Week Change: 3.91% Year-to-date Change: -25.5% | |
| RNW Links: Profile News Message Board | |
| Charts:- Daily , Weekly | |
| Add RNW to Watchlist: View: Get Complete RNW Trend Analysis ➞ | |
 | CNHI CNH Industrial N.V. |
| Sector: Industrials | |
| SubSector: Farm & Construction Machinery | |
| MarketCap: 9366.57 Millions | |
| Recent Price: 11.73 Market Intelligence Score: 42 | |
| Day Percent Change: 2.80% Day Change: 0.32 | |
| Week Change: 2.8% Year-to-date Change: -3.7% | |
| CNHI Links: Profile News Message Board | |
| Charts:- Daily , Weekly | |
| Add CNHI to Watchlist: View: Get Complete CNHI Trend Analysis ➞ | |
 | PUK Prudential plc |
| Sector: Financials | |
| SubSector: Life Insurance | |
| MarketCap: 28247.4 Millions | |
| Recent Price: 18.80 Market Intelligence Score: 67 | |
| Day Percent Change: 2.68% Day Change: 0.49 | |
| Week Change: 2.68% Year-to-date Change: -16.3% | |
| PUK Links: Profile News Message Board | |
| Charts:- Daily , Weekly | |
| Add PUK to Watchlist: View: Get Complete PUK Trend Analysis ➞ | |
 | MANU Manchester United plc |
| Sector: Services & Goods | |
| SubSector: Sporting Activities | |
| MarketCap: 2537.74 Millions | |
| Recent Price: 16.44 Market Intelligence Score: 69 | |
| Day Percent Change: 2.30% Day Change: 0.37 | |
| Week Change: 2.3% Year-to-date Change: -19.3% | |
| MANU Links: Profile News Message Board | |
| Charts:- Daily , Weekly | |
| Add MANU to Watchlist: View: Get Complete MANU Trend Analysis ➞ | |
 | IHS IHS Holding Limited |
| Sector: Services & Goods | |
| SubSector: Telecom Services | |
| MarketCap: 3310 Millions | |
| Recent Price: 3.61 Market Intelligence Score: 69 | |
| Day Percent Change: 2.27% Day Change: 0.08 | |
| Week Change: 2.27% Year-to-date Change: -21.5% | |
| IHS Links: Profile News Message Board | |
| Charts:- Daily , Weekly | |
| Add IHS to Watchlist: View: Get Complete IHS Trend Analysis ➞ | |
 | LXFR Luxfer Holdings PLC |
| Sector: Industrials | |
| SubSector: Diversified Machinery | |
| MarketCap: 406.716 Millions | |
| Recent Price: 9.94 Market Intelligence Score: 68 | |
| Day Percent Change: 2.16% Day Change: 0.21 | |
| Week Change: 2.16% Year-to-date Change: 11.2% | |
| LXFR Links: Profile News Message Board | |
| Charts:- Daily , Weekly | |
| Add LXFR to Watchlist: View: Get Complete LXFR Trend Analysis ➞ | |
 | CMPS COMPASS Pathways plc |
| Sector: Health Care | |
| SubSector: Medical Care Facilities | |
| MarketCap: 19587 Millions | |
| Recent Price: 8.10 Market Intelligence Score: 17 | |
| Day Percent Change: 2.02% Day Change: 0.16 | |
| Week Change: 2.02% Year-to-date Change: -7.3% | |
| CMPS Links: Profile News Message Board | |
| Charts:- Daily , Weekly | |
| Add CMPS to Watchlist: View: Get Complete CMPS Trend Analysis ➞ | |
 | SLN Silence Therapeutics plc |
| Sector: Health Care | |
| SubSector: Biotechnology | |
| MarketCap: 198 Millions | |
| Recent Price: 21.92 Market Intelligence Score: 5 | |
| Day Percent Change: 1.46% Day Change: 0.32 | |
| Week Change: 1.46% Year-to-date Change: 24.9% | |
| SLN Links: Profile News Message Board | |
| Charts:- Daily , Weekly | |
| Add SLN to Watchlist: View: Get Complete SLN Trend Analysis ➞ | |
 | PSFE Paysafe Limited |
| Sector: Technology | |
| SubSector: Software - Infrastructure | |
| MarketCap: 605 Millions | |
| Recent Price: 14.65 Market Intelligence Score: 25 | |
| Day Percent Change: 1.31% Day Change: 0.19 | |
| Week Change: 1.31% Year-to-date Change: 13.6% | |
| PSFE Links: Profile News Message Board | |
| Charts:- Daily , Weekly | |
| Add PSFE to Watchlist: View: Get Complete PSFE Trend Analysis ➞ | |
 | LIVN LivaNova PLC |
| Sector: Health Care | |
| SubSector: Medical Appliances & Equipment | |
| MarketCap: 2060.5 Millions | |
| Recent Price: 56.24 Market Intelligence Score: 93 | |
| Day Percent Change: 1.28% Day Change: 0.71 | |
| Week Change: 1.28% Year-to-date Change: 8.7% | |
| LIVN Links: Profile News Message Board | |
| Charts:- Daily , Weekly | |
| Add LIVN to Watchlist: View: Get Complete LIVN Trend Analysis ➞ | |
 | GSK GlaxoSmithKline plc |
| Sector: Health Care | |
| SubSector: Drug Manufacturers - Major | |
| MarketCap: 89428.2 Millions | |
| Recent Price: 41.61 Market Intelligence Score: 95 | |
| Day Percent Change: 1.22% Day Change: 0.50 | |
| Week Change: 1.22% Year-to-date Change: 12.3% | |
| GSK Links: Profile News Message Board | |
| Charts:- Daily , Weekly | |
| Add GSK to Watchlist: View: Get Complete GSK Trend Analysis ➞ | |
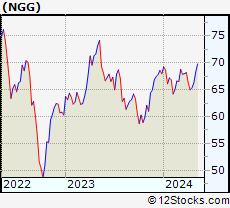 | NGG National Grid plc |
| Sector: Utilities | |
| SubSector: Gas Utilities | |
| MarketCap: 38366.5 Millions | |
| Recent Price: 67.12 Market Intelligence Score: 80 | |
| Day Percent Change: 1.22% Day Change: 0.81 | |
| Week Change: 1.22% Year-to-date Change: -1.3% | |
| NGG Links: Profile News Message Board | |
| Charts:- Daily , Weekly | |
| Add NGG to Watchlist: View: Get Complete NGG Trend Analysis ➞ | |
 | VOD Vodafone Group Plc |
| Sector: Technology | |
| SubSector: Wireless Communications | |
| MarketCap: 38154.7 Millions | |
| Recent Price: 8.72 Market Intelligence Score: 93 | |
| Day Percent Change: 1.16% Day Change: 0.10 | |
| Week Change: 1.16% Year-to-date Change: 0.2% | |
| VOD Links: Profile News Message Board | |
| Charts:- Daily , Weekly | |
| Add VOD to Watchlist: View: Get Complete VOD Trend Analysis ➞ | |
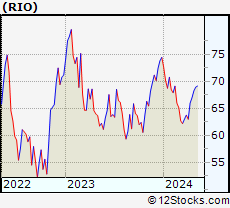 | RIO Rio Tinto Group |
| Sector: Materials | |
| SubSector: Industrial Metals & Minerals | |
| MarketCap: 69399.7 Millions | |
| Recent Price: 69.01 Market Intelligence Score: 74 | |
| Day Percent Change: 1.13% Day Change: 0.77 | |
| Week Change: 1.13% Year-to-date Change: -7.3% | |
| RIO Links: Profile News Message Board | |
| Charts:- Daily , Weekly | |
| Add RIO to Watchlist: View: Get Complete RIO Trend Analysis ➞ | |
 | NCNA NuCana plc |
| Sector: Health Care | |
| SubSector: Biotechnology | |
| MarketCap: 185.785 Millions | |
| Recent Price: 4.04 Market Intelligence Score: 83 | |
| Day Percent Change: 1.00% Day Change: 0.04 | |
| Week Change: 1% Year-to-date Change: 1,265.8% | |
| NCNA Links: Profile News Message Board | |
| Charts:- Daily , Weekly | |
| Add NCNA to Watchlist: View: Get Complete NCNA Trend Analysis ➞ | |
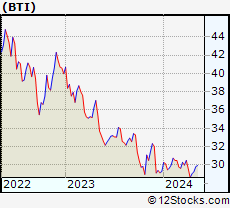 | BTI British American Tobacco p.l.c. |
| Sector: Consumer Staples | |
| SubSector: Cigarettes | |
| MarketCap: 74290.3 Millions | |
| Recent Price: 29.53 Market Intelligence Score: 73 | |
| Day Percent Change: 0.96% Day Change: 0.28 | |
| Week Change: 0.96% Year-to-date Change: 0.8% | |
| BTI Links: Profile News Message Board | |
| Charts:- Daily , Weekly | |
| Add BTI to Watchlist: View: Get Complete BTI Trend Analysis ➞ | |
| To view more stocks, click on Next / Previous arrows or select different range: 0 - 25 , 25 - 50 , 50 - 75 | ||
| Click To Change The Sort Order: By Market Cap or Company Size Performance: Year-to-date, Week and Day | |
| Select Chart Type: | ||
 Best Stocks Today 12Stocks.com |
© 2024 12Stocks.com Terms & Conditions Privacy Contact Us
All Information Provided Only For Education And Not To Be Used For Investing or Trading. See Terms & Conditions


One More Thing ... Get Best Stocks Delivered Daily!
Never Ever Miss A Move With Our Top Ten Stocks Lists
Find Best Stocks In Any Market - Bull or Bear Market
Take A Peek At Our Top Ten Stocks Lists: Daily, Weekly, Year-to-Date & Top Trends
Find Best Stocks In Any Market - Bull or Bear Market
Take A Peek At Our Top Ten Stocks Lists: Daily, Weekly, Year-to-Date & Top Trends
United Kingdom Stocks With Best Up Trends [0-bearish to 100-bullish]: Aberdeen Emerging[100], WPP [100], HSBC [100], Unilever [100], AstraZeneca [100], GlaxoSmithKline [95], Coca-Cola European[95], LivaNova [93], Vodafone [93], Roivant Sciences[90], Barclays [88]
Best United Kingdom Stocks Year-to-Date:
NuCana [1265.79%], Renalytix AI[72.56%], Summit [49.23%], Adaptimmune [44.39%], Bicycle [30.64%], Barclays [30.58%], nVent Electric[27.31%], Silence [24.86%], Metals Acquisition[20.47%], Centessa [15.1%], Vertical Aerospace[14.17%] Best United Kingdom Stocks This Week:
Exscientia [14.5%], Renalytix AI[7.3%], KNOT Offshore[7.21%], Adaptimmune [6.51%], Super [4.65%], Centessa [4.09%], Bicycle [3.92%], ReNew Energy[3.91%], CNH Industrial[2.8%], Prudential [2.68%], Manchester United[2.3%] Best United Kingdom Stocks Daily:
Exscientia [14.50%], Renalytix AI[7.30%], KNOT Offshore[7.21%], Adaptimmune [6.51%], Super [4.65%], Centessa [4.09%], Bicycle [3.92%], ReNew Energy[3.91%], CNH Industrial[2.80%], Prudential [2.68%], Manchester United[2.30%]