
 Login Sign Up


| |||||
 |  | ||||

| 12Stocks.com Market Intelligence |
Best Tech Stocks
| In a hurry? Tech Stocks Lists: Performance & Trends, Stock Charts, FANG Stocks
Sort Tech stocks: Daily, Weekly, Year-to-Date, Market Cap & Trends. Filter Tech stocks list by size:All Tech Large Mid-Range Small and MicroCap |
| 12Stocks.com Tech Stocks Performances & Trends Daily | |||||||||
|
|  The overall Smart Investing & Trading Score is 100 (0-bearish to 100-bullish) which puts Technology sector in short term bullish trend. The Smart Investing & Trading Score from previous trading session is 90 and an improvement of trend continues.
| ||||||||
Here are the Smart Investing & Trading Scores of the most requested Technology stocks at 12Stocks.com (click stock name for detailed review):
|


| 12Stocks.com: Investing in Technology sector with Stocks | |
|
The following table helps investors and traders sort through current performance and trends (as measured by Smart Investing & Trading Score) of various
stocks in the Tech sector. Quick View: Move mouse or cursor over stock symbol (ticker) to view short-term technical chart and over stock name to view long term chart. Click on  to add stock symbol to your watchlist and to add stock symbol to your watchlist and  to view watchlist. Click on any ticker or stock name for detailed market intelligence report for that stock. to view watchlist. Click on any ticker or stock name for detailed market intelligence report for that stock. |
12Stocks.com Performance of Stocks in Tech Sector
| Ticker | Stock Name | Watchlist | Category | Recent Price | Smart Investing & Trading Score | Change % | YTD Change% |
| YGE | Yingli Green |   | Semiconductor | 1.51 | 70 | 0.67 | 0.00% |
| TESS | TESSCO | | Communication | 1.52 | 0 | 0.66 | 0.00% |
| WBX | Wallbox N.V | | Electronic Components | 4.58 | 40 | 0.66 | -65.56% |
| CMTL | Comtech Tele | | Communication | 2.67 | 90 | 0.64 | -34.79% |
| DLPN | Dolphin Entertainment | | Advertising Agencies | 1.32 | 90 | 0.61 | 23.76% |
| DTSS | Datasea | | Software - Infrastructure | 2.05 | 40 | 0.49 | -10.09% |
| WYY | Widepoint Corp | | IT | 5.06 | 50 | 0.40 | 7.66% |
| WATT | Energous Corp | | Instruments | 7.83 | 50 | 0.38 | -73.15% |
| DCAR | DropCar | | Software | 3.61 | 20 | 0.28 | 0.00% |
| KRKR | 36Kr | | Advertising Agencies | 7.27 | 50 | 0.28 | 142.33% |
| MDSY | ModSys | | Software | 7.70 | 10 | 0.13 | 0.00% |
| QADB | QAD | | Software | 9.26 | 0 | 0.11 | 0.00% |
| AWRE | Aware | | Software - | 2.36 | 40 | 0.04 | 41.38% |
| TSRI | TSR | | Software | 13.38 | 60 | 0.04 | 0.00% |
| CTV | Qwest | | Communication | 3.14 | 30 | 0.00 | 3.63% |
| CCUR | Concurrent Computer | | Computer Based | 2500.00 | 50 | 0.00 | 11.11% |
| OIIM | O2Micro | | Electronics | 5.41 | 60 | 0.00 | 0.00% |
| JRJC | China Finance | | Internet | 2.71 | 60 | 0.00 | 0.00% |
| CBAK | CBAK Energy | | Electronics | 0.65 | 20 | 0.00 | 0.00% |
| RWC | RELM Wireless | | Communication | 3.65 | 10 | 0.00 | 0.00% |
| GVP | GSE Systems | | Software | 4.59 | 30 | 0.00 | 0.00% |
| WTT | Wireless Telecom | | Communication | 2.13 | 30 | 0.00 | 0.00% |
| SCKT | Socket Mobile | | Computer Hardware | 1.02 | 50 | 0.00 | -22.73% |
| BNSO | Bonso Electronics | | Instruments | 2.59 | 40 | 0.00 | 0.00% |
| MTSL | Mer Telemanagement | | Communication | 5.80 | 10 | 0.00 | 0.00% |
| For chart view version of above stock list: Chart View ➞ 0 - 25 , 25 - 50 , 50 - 75 , 75 - 100 , 100 - 125 , 125 - 150 , 150 - 175 , 175 - 200 | ||
 | Click To Change The Sort Order: By Market Cap or Company Size Performance: Year-to-date, Week and Day |  |
|
Get the most comprehensive stock market coverage daily at 12Stocks.com ➞ Best Stocks Today ➞ Best Stocks Weekly ➞ Best Stocks Year-to-Date ➞ Best Stocks Trends ➞  Best Stocks Today 12Stocks.com Best Nasdaq Stocks ➞ Best S&P 500 Stocks ➞ Best Tech Stocks ➞ Best Biotech Stocks ➞ |
| Detailed Overview of Tech Stocks |
| Tech Technical Overview, Leaders & Laggards, Top Tech ETF Funds & Detailed Tech Stocks List, Charts, Trends & More |
| Tech Sector: Technical Analysis, Trends & YTD Performance | |
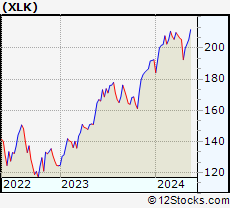
| Technology sector is composed of stocks
from semiconductors, software, web, social media
and services subsectors. Technology sector, as represented by XLK, an exchange-traded fund [ETF] that holds basket of tech stocks (e.g, Intel, Google) is up by 23.7823% and is currently outperforming the overall market by 9.0244% year-to-date. Below is a quick view of technical charts and trends: |
|
 XLK Weekly Chart |
|
| Long Term Trend: Very Good | |
| Medium Term Trend: Good | |
 XLK Daily Chart |
|
| Short Term Trend: Very Good | |
| Overall Trend Score: 100 | |
| YTD Performance: 23.7823% | |
| **Trend Scores & Views Are Only For Educational Purposes And Not For Investing | |
| 12Stocks.com: Top Performing Technology Sector Stocks | ||||||||||||||||||||||||||||||||||||||||||||||||
 The top performing Technology sector stocks year to date are
Now, more recently, over last week, the top performing Technology sector stocks on the move are


|
||||||||||||||||||||||||||||||||||||||||||||||||
| 12Stocks.com: Investing in Tech Sector using Exchange Traded Funds | |
|
The following table shows list of key exchange traded funds (ETF) that
help investors track Tech Index. For detailed view, check out our ETF Funds section of our website. Quick View: Move mouse or cursor over ETF symbol (ticker) to view short-term technical chart and over ETF name to view long term chart. Click on ticker or stock name for detailed view. Click on to add stock symbol to your watchlist and to view watchlist. |
12Stocks.com List of ETFs that track Tech Index
| Ticker | ETF Name | Watchlist | Recent Price | Smart Investing & Trading Score | Change % | Week % | Year-to-date % |
| IGN | Tech-Multimd Ntwk | | 53.86 | 40 | 0.918119 | -20.6435 | 0% |
| 12Stocks.com: Charts, Trends, Fundamental Data and Performances of Tech Stocks | |
|
We now take in-depth look at all Tech stocks including charts, multi-period performances and overall trends (as measured by Smart Investing & Trading Score). One can sort Tech stocks (click link to choose) by Daily, Weekly and by Year-to-Date performances. Also, one can sort by size of the company or by market capitalization. |
| Select Your Default Chart Type: | |||||
| |||||
| Click on stock symbol or name for detailed view. Click on to add stock symbol to your watchlist and to view watchlist. Quick View: Move mouse or cursor over "Daily" to quickly view daily technical stock chart and over "Weekly" to view weekly technical stock chart. | |||||


 | YGE Yingli Green Energy Holding Company Limited |
| Sector: Technology | |
| SubSector: Semiconductor - Specialized | |
| MarketCap: 40.75 Millions | |
| Recent Price: 1.51 Smart Investing & Trading Score: 70 | |
| Day Percent Change: 0.666667% Day Change: -9999 | |
| Week Change: -92.5579% Year-to-date Change: 0.0% | |
| YGE Links: Profile News Message Board | |
| Charts:- Daily , Weekly | |
| Add YGE to Watchlist: View: Get Complete YGE Trend Analysis ➞ | |
 | TESS TESSCO Technologies Incorporated |
| Sector: Technology | |
| SubSector: Communication Equipment | |
| MarketCap: 48.8539 Millions | |
| Recent Price: 1.52 Smart Investing & Trading Score: 0 | |
| Day Percent Change: 0.662252% Day Change: -9999 | |
| Week Change: -83.0923% Year-to-date Change: 0.0% | |
| TESS Links: Profile News Message Board | |
| Charts:- Daily , Weekly | |
| Add TESS to Watchlist: View: Get Complete TESS Trend Analysis ➞ | |
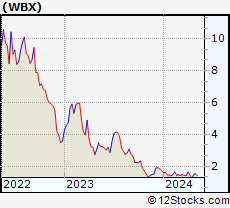 | WBX Wallbox N.V |
| Sector: Technology | |
| SubSector: Electronic Components | |
| MarketCap: 57.02 Millions | |
| Recent Price: 4.58 Smart Investing & Trading Score: 40 | |
| Day Percent Change: 0.659341% Day Change: -0.13 | |
| Week Change: -5.56701% Year-to-date Change: -65.6% | |
| WBX Links: Profile News Message Board | |
| Charts:- Daily , Weekly | |
| Add WBX to Watchlist: View: Get Complete WBX Trend Analysis ➞ | |
 | CMTL Comtech Telecommunications Corp |
| Sector: Technology | |
| SubSector: Communication Equipment | |
| MarketCap: 65.26 Millions | |
| Recent Price: 2.67 Smart Investing & Trading Score: 90 | |
| Day Percent Change: 0.641509% Day Change: -0.02 | |
| Week Change: 13.0085% Year-to-date Change: -34.8% | |
| CMTL Links: Profile News Message Board | |
| Charts:- Daily , Weekly | |
| Add CMTL to Watchlist: View: Get Complete CMTL Trend Analysis ➞ | |
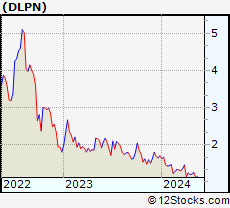 | DLPN Dolphin Entertainment Inc |
| Sector: Technology | |
| SubSector: Advertising Agencies | |
| MarketCap: 14.09 Millions | |
| Recent Price: 1.32 Smart Investing & Trading Score: 90 | |
| Day Percent Change: 0.610687% Day Change: -0.01 | |
| Week Change: -0.0833902% Year-to-date Change: 23.8% | |
| DLPN Links: Profile News Message Board | |
| Charts:- Daily , Weekly | |
| Add DLPN to Watchlist: View: Get Complete DLPN Trend Analysis ➞ | |
 | DTSS Datasea Inc |
| Sector: Technology | |
| SubSector: Software - Infrastructure | |
| MarketCap: 15.58 Millions | |
| Recent Price: 2.05 Smart Investing & Trading Score: 40 | |
| Day Percent Change: 0.490196% Day Change: -0.05 | |
| Week Change: -10.8696% Year-to-date Change: -10.1% | |
| DTSS Links: Profile News Message Board | |
| Charts:- Daily , Weekly | |
| Add DTSS to Watchlist: View: Get Complete DTSS Trend Analysis ➞ | |
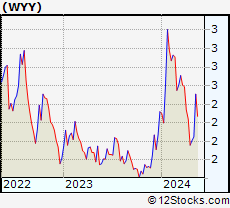 | WYY Widepoint Corp |
| Sector: Technology | |
| SubSector: Information Technology Services | |
| MarketCap: 49.18 Millions | |
| Recent Price: 5.06 Smart Investing & Trading Score: 50 | |
| Day Percent Change: 0.396825% Day Change: -0.19 | |
| Week Change: 0.796813% Year-to-date Change: 7.7% | |
| WYY Links: Profile News Message Board | |
| Charts:- Daily , Weekly | |
| Add WYY to Watchlist: View: Get Complete WYY Trend Analysis ➞ | |
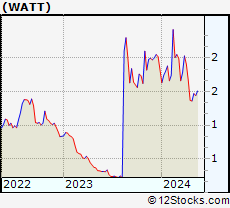 | WATT Energous Corp |
| Sector: Technology | |
| SubSector: Scientific & Technical Instruments | |
| MarketCap: 9.88 Millions | |
| Recent Price: 7.83 Smart Investing & Trading Score: 50 | |
| Day Percent Change: 0.384615% Day Change: 0.4 | |
| Week Change: -3.21384% Year-to-date Change: -73.2% | |
| WATT Links: Profile News Message Board | |
| Charts:- Daily , Weekly | |
| Add WATT to Watchlist: View: Get Complete WATT Trend Analysis ➞ | |
 | DCAR DropCar, Inc. |
| Sector: Technology | |
| SubSector: Application Software | |
| MarketCap: 2.57662 Millions | |
| Recent Price: 3.61 Smart Investing & Trading Score: 20 | |
| Day Percent Change: 0.277778% Day Change: -9999 | |
| Week Change: -36.9983% Year-to-date Change: 0.0% | |
| DCAR Links: Profile News Message Board | |
| Charts:- Daily , Weekly | |
| Add DCAR to Watchlist: View: Get Complete DCAR Trend Analysis ➞ | |
 | KRKR 36Kr Holdings Inc ADR |
| Sector: Technology | |
| SubSector: Advertising Agencies | |
| MarketCap: 9.33 Millions | |
| Recent Price: 7.27 Smart Investing & Trading Score: 50 | |
| Day Percent Change: 0.275862% Day Change: -0.24 | |
| Week Change: -10.136% Year-to-date Change: 142.3% | |
| KRKR Links: Profile News Message Board | |
| Charts:- Daily , Weekly | |
| Add KRKR to Watchlist: View: Get Complete KRKR Trend Analysis ➞ | |
 | MDSY ModSys International Ltd. |
| Sector: Technology | |
| SubSector: Application Software | |
| MarketCap: 12.66 Millions | |
| Recent Price: 7.70 Smart Investing & Trading Score: 10 | |
| Day Percent Change: 0.130039% Day Change: -9999 | |
| Week Change: -62.1249% Year-to-date Change: 0.0% | |
| MDSY Links: Profile News Message Board | |
| Charts:- Daily , Weekly | |
| Add MDSY to Watchlist: View: Get Complete MDSY Trend Analysis ➞ | |
 | QADB QAD Inc. |
| Sector: Technology | |
| SubSector: Application Software | |
| MarketCap: 69.7662 Millions | |
| Recent Price: 9.26 Smart Investing & Trading Score: 0 | |
| Day Percent Change: 0.108108% Day Change: -9999 | |
| Week Change: -89.422% Year-to-date Change: 0.0% | |
| QADB Links: Profile News Message Board | |
| Charts:- Daily , Weekly | |
| Add QADB to Watchlist: View: Get Complete QADB Trend Analysis ➞ | |
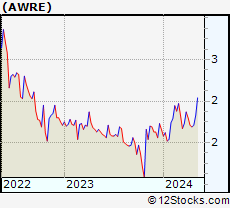 | AWRE Aware Inc |
| Sector: Technology | |
| SubSector: Software - Application | |
| MarketCap: 48.38 Millions | |
| Recent Price: 2.36 Smart Investing & Trading Score: 40 | |
| Day Percent Change: 0.0423729% Day Change: 0.05 | |
| Week Change: -9.8855% Year-to-date Change: 41.4% | |
| AWRE Links: Profile News Message Board | |
| Charts:- Daily , Weekly | |
| Add AWRE to Watchlist: View: Get Complete AWRE Trend Analysis ➞ | |
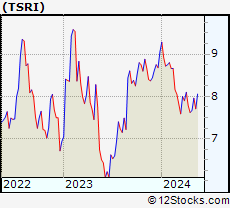 | TSRI TSR, Inc. |
| Sector: Technology | |
| SubSector: Business Software & Services | |
| MarketCap: 6.01758 Millions | |
| Recent Price: 13.38 Smart Investing & Trading Score: 60 | |
| Day Percent Change: 0.041123% Day Change: -9999 | |
| Week Change: 0.15195% Year-to-date Change: 0.0% | |
| TSRI Links: Profile News Message Board | |
| Charts:- Daily , Weekly | |
| Add TSRI to Watchlist: View: Get Complete TSRI Trend Analysis ➞ | |
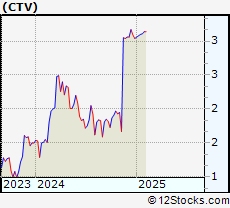 | CTV Qwest Corp. |
| Sector: Technology | |
| SubSector: Communication Equipment | |
| MarketCap: 0 Millions | |
| Recent Price: 3.14 Smart Investing & Trading Score: 30 | |
| Day Percent Change: 0% Day Change: -9999 | |
| Week Change: 0.641026% Year-to-date Change: 3.6% | |
| CTV Links: Profile News Message Board | |
| Charts:- Daily , Weekly | |
| Add CTV to Watchlist: View: Get Complete CTV Trend Analysis ➞ | |
 | CCUR Concurrent Computer Corporation |
| Sector: Technology | |
| SubSector: Computer Based Systems | |
| MarketCap: 48.02 Millions | |
| Recent Price: 2500.00 Smart Investing & Trading Score: 50 | |
| Day Percent Change: 0% Day Change: -9999 | |
| Week Change: 0% Year-to-date Change: 11.1% | |
| CCUR Links: Profile News Message Board | |
| Charts:- Daily , Weekly | |
| Add CCUR to Watchlist: View: Get Complete CCUR Trend Analysis ➞ | |
 | OIIM O2Micro International Limited |
| Sector: Technology | |
| SubSector: Diversified Electronics | |
| MarketCap: 30.3396 Millions | |
| Recent Price: 5.41 Smart Investing & Trading Score: 60 | |
| Day Percent Change: 0% Day Change: -9999 | |
| Week Change: 10.4082% Year-to-date Change: 0.0% | |
| OIIM Links: Profile News Message Board | |
| Charts:- Daily , Weekly | |
| Add OIIM to Watchlist: View: Get Complete OIIM Trend Analysis ➞ | |
 | JRJC China Finance Online Co. Limited |
| Sector: Technology | |
| SubSector: Internet Information Providers | |
| MarketCap: 11.808 Millions | |
| Recent Price: 2.71 Smart Investing & Trading Score: 60 | |
| Day Percent Change: 0% Day Change: -9999 | |
| Week Change: 115.079% Year-to-date Change: 0.0% | |
| JRJC Links: Profile News Message Board | |
| Charts:- Daily , Weekly | |
| Add JRJC to Watchlist: View: Get Complete JRJC Trend Analysis ➞ | |
 | CBAK CBAK Energy Technology, Inc. |
| Sector: Technology | |
| SubSector: Diversified Electronics | |
| MarketCap: 26.49 Millions | |
| Recent Price: 0.65 Smart Investing & Trading Score: 20 | |
| Day Percent Change: 0% Day Change: -9999 | |
| Week Change: 0% Year-to-date Change: 0.0% | |
| CBAK Links: Profile News Message Board | |
| Charts:- Daily , Weekly | |
| Add CBAK to Watchlist: View: Get Complete CBAK Trend Analysis ➞ | |
 | RWC RELM Wireless Corporation |
| Sector: Technology | |
| SubSector: Communication Equipment | |
| MarketCap: 66.65 Millions | |
| Recent Price: 3.65 Smart Investing & Trading Score: 10 | |
| Day Percent Change: 0% Day Change: -9999 | |
| Week Change: 0% Year-to-date Change: 0.0% | |
| RWC Links: Profile News Message Board | |
| Charts:- Daily , Weekly | |
| Add RWC to Watchlist: View: Get Complete RWC Trend Analysis ➞ | |
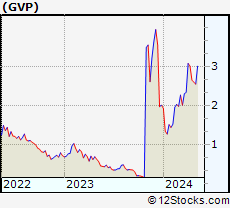 | GVP GSE Systems, Inc. |
| Sector: Technology | |
| SubSector: Business Software & Services | |
| MarketCap: 20.1758 Millions | |
| Recent Price: 4.59 Smart Investing & Trading Score: 30 | |
| Day Percent Change: 0% Day Change: -9999 | |
| Week Change: -0.649351% Year-to-date Change: 0.0% | |
| GVP Links: Profile News Message Board | |
| Charts:- Daily , Weekly | |
| Add GVP to Watchlist: View: Get Complete GVP Trend Analysis ➞ | |
 | WTT Wireless Telecom Group, Inc. |
| Sector: Technology | |
| SubSector: Communication Equipment | |
| MarketCap: 19.9539 Millions | |
| Recent Price: 2.13 Smart Investing & Trading Score: 30 | |
| Day Percent Change: 0% Day Change: -9999 | |
| Week Change: 0% Year-to-date Change: 0.0% | |
| WTT Links: Profile News Message Board | |
| Charts:- Daily , Weekly | |
| Add WTT to Watchlist: View: Get Complete WTT Trend Analysis ➞ | |
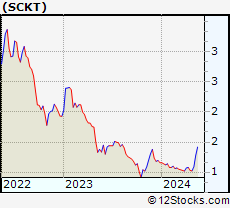 | SCKT Socket Mobile Inc |
| Sector: Technology | |
| SubSector: Computer Hardware | |
| MarketCap: 8.29 Millions | |
| Recent Price: 1.02 Smart Investing & Trading Score: 50 | |
| Day Percent Change: 0% Day Change: 0 | |
| Week Change: -1.92308% Year-to-date Change: -22.7% | |
| SCKT Links: Profile News Message Board | |
| Charts:- Daily , Weekly | |
| Add SCKT to Watchlist: View: Get Complete SCKT Trend Analysis ➞ | |
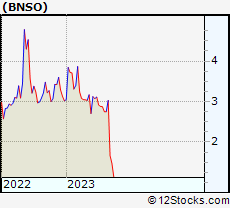 | BNSO Bonso Electronics International Inc. |
| Sector: Technology | |
| SubSector: Scientific & Technical Instruments | |
| MarketCap: 11.7553 Millions | |
| Recent Price: 2.59 Smart Investing & Trading Score: 40 | |
| Day Percent Change: 0% Day Change: -9999 | |
| Week Change: -1.89394% Year-to-date Change: 0.0% | |
| BNSO Links: Profile News Message Board | |
| Charts:- Daily , Weekly | |
| Add BNSO to Watchlist: View: Get Complete BNSO Trend Analysis ➞ | |
 | MTSL Mer Telemanagement Solutions Ltd. |
| Sector: Technology | |
| SubSector: Diversified Communication Services | |
| MarketCap: 3.09964 Millions | |
| Recent Price: 5.80 Smart Investing & Trading Score: 10 | |
| Day Percent Change: 0% Day Change: -9999 | |
| Week Change: 0% Year-to-date Change: 0.0% | |
| MTSL Links: Profile News Message Board | |
| Charts:- Daily , Weekly | |
| Add MTSL to Watchlist: View: Get Complete MTSL Trend Analysis ➞ | |
| For tabular summary view of above stock list: Summary View ➞ 0 - 25 , 25 - 50 , 50 - 75 , 75 - 100 , 100 - 125 , 125 - 150 , 150 - 175 , 175 - 200 | ||
| Click To Change The Sort Order: By Market Cap or Company Size Performance: Year-to-date, Week and Day | |
| Select Chart Type: | ||
|
Best Stocks Today 12Stocks.com |
© 2025 12Stocks.com Terms & Conditions Privacy Contact Us
All Information Provided Only For Education And Not To Be Used For Investing or Trading. See Terms & Conditions


One More Thing ... Get Best Stocks Delivered Daily!
Never Ever Miss A Move With Our Top Ten Stocks Lists
Find Best Stocks In Any Market - Bull or Bear Market
Take A Peek At Our Top Ten Stocks Lists: Daily, Weekly, Year-to-Date & Top Trends
Find Best Stocks In Any Market - Bull or Bear Market
Take A Peek At Our Top Ten Stocks Lists: Daily, Weekly, Year-to-Date & Top Trends
Technology Stocks With Best Up Trends [0-bearish to 100-bullish]: Sony [100], Bakkt [100], Rigetti Computing[100], Fair Isaac[100], Arqit Quantum[100], D-Wave Quantum[100], Navitas Semiconductor[100], Shoals [100], Vuzix [100], Arteris [100], Lantronix [100]
Best Technology Stocks Year-to-Date:
Xunlei [370.476%], Sify [315.033%], Wolfspeed [307.01%], Digital Turbine[265.057%], EchoStar Corp[247.253%], CuriosityStream [241.605%], Viasat [224.029%], Pagaya [222.638%], Oneconnect Financial[209.053%], D-Wave Quantum[203.954%], CommScope Holding[203.101%] Best Technology Stocks This Week:
GTT [443626%], Barracuda Networks[71050%], Mobile TeleSystems[10483.5%], Nam Tai[5033.33%], Ebix [4200.85%], Fang [4150%], NantHealth [3114.02%], Hemisphere Media[2981.82%], Yandex N.V[2935.27%], Wolfspeed [1961.98%], Castlight Health[1751.96%] Best Technology Stocks Daily:
Sony [194.565%], Bakkt [28.6091%], Rigetti Computing[18.4925%], Fair Isaac[17.979%], Arqit Quantum[17.9369%], Marti [17%], Latch [16.6667%], Oclaro [14.734%], D-Wave Quantum[13.968%], Arbe Robotics[13.0178%], Navitas Semiconductor[12.3288%]