
 Login Sign Up


| |||||
 |  | ||||

| 12Stocks.com Market Intelligence |
Best Tech Stocks
| In a hurry? Tech Stocks Lists: Performance & Trends, Stock Charts, FANG Stocks
Sort Tech stocks: Daily, Weekly, Year-to-Date, Market Cap & Trends. Filter Tech stocks list by size:All Tech Large Mid-Range Small and MicroCap |
| 12Stocks.com Tech Stocks Performances & Trends Daily | |||||||||
|
|  The overall Smart Investing & Trading Score is 100 (0-bearish to 100-bullish) which puts Technology sector in short term bullish trend. The Smart Investing & Trading Score from previous trading session is 90 and an improvement of trend continues.
| ||||||||
Here are the Smart Investing & Trading Scores of the most requested Technology stocks at 12Stocks.com (click stock name for detailed review):
|


| 12Stocks.com: Investing in Technology sector with Stocks | |
|
The following table helps investors and traders sort through current performance and trends (as measured by Smart Investing & Trading Score) of various
stocks in the Tech sector. Quick View: Move mouse or cursor over stock symbol (ticker) to view short-term technical chart and over stock name to view long term chart. Click on  to add stock symbol to your watchlist and to add stock symbol to your watchlist and  to view watchlist. Click on any ticker or stock name for detailed market intelligence report for that stock. to view watchlist. Click on any ticker or stock name for detailed market intelligence report for that stock. |
12Stocks.com Performance of Stocks in Tech Sector
| Ticker | Stock Name | Watchlist | Category | Recent Price | Smart Investing & Trading Score | Change % | Weekly Change% |
| VERB | Verb |   | Software | 6.82 | 30 | -1.73% | -3.81% |
| COOL | PolarityTE | | Software | 11.10 | 10 | -1.14% | -3.90% |
| ELSE | Electro-Sensors | | Instruments | 4.80 | 80 | 0.00% | -3.91% |
| EVOL | Evolving Systems | | Software | 0.45 | 20 | -8.16% | -4.26% |
| CMCM | Cheetah Mobile | | Internet Content & Information | 8.30 | 60 | 2.98% | -4.27% |
| RENN | Renren | | Internet | 1.17 | 20 | -3.70% | -4.49% |
| ZDGE | Zedge | | Internet Content & Information | 2.95 | 10 | 0.68% | -4.53% |
| BHAT | Blue Hat | | Electronic Gaming & Multimedia | 1.83 | 60 | -3.17% | -4.69% |
| KOSS | Koss Corp | | Consumer Electronics | 5.18 | 10 | -0.77% | -4.87% |
| MNDO | Mind C.T.I | | Software - | 1.12 | 20 | 0.90% | -4.93% |
| EDUC | Educational Development | | Publishing | 1.30 | 30 | -2.26% | -5.11% |
| ISNS | Image Sensing | | Instruments | 7.59 | 20 | 5.12% | -5.24% |
| AMST | Amesite | | Software - | 3.07 | 40 | 0.99% | -5.54% |
| WBX | Wallbox N.V | | Electronic Components | 4.58 | 40 | 0.66% | -5.57% |
| SLGG | Super League | | Software | 1.16 | 20 | -9.37% | -5.68% |
| AIXI | Xiao-I Corp | | Software - | 1.23 | 43 | 1.47% | -6.39% |
| GIGM | Gigamedia | | Electronic Gaming & Multimedia | 1.65 | 30 | -1.79% | -7.82% |
| DGLY | Digital Ally | | Internet Content & Information | 2.04 | 90 | 3.03% | -8.52% |
| RDI | Reading | | Entertainment | 1.44 | 20 | -0.69% | -8.86% |
| CREX | Creative Realities | | Software - | 2.26 | 40 | -2.16% | -8.87% |
| CPSH | CPS | | Electronic Components | 3.68 | 80 | 3.08% | -9.36% |
| JG | Aurora Mobile | | Software - Infrastructure | 8.10 | 10 | -0.30% | -9.46% |
| CDLX | Cardlytics | | Advertising Agencies | 2.38 | 80 | 1.06% | -9.66% |
| AWRE | Aware | | Software - | 2.36 | 40 | 0.04% | -9.89% |
| KRKR | 36Kr | | Advertising Agencies | 7.27 | 50 | 0.28% | -10.14% |
| For chart view version of above stock list: Chart View ➞ 0 - 25 , 25 - 50 , 50 - 75 , 75 - 100 , 100 - 125 , 125 - 150 , 150 - 175 , 175 - 200 | ||
 | Click To Change The Sort Order: By Market Cap or Company Size Performance: Year-to-date, Week and Day |  |
|
Get the most comprehensive stock market coverage daily at 12Stocks.com ➞ Best Stocks Today ➞ Best Stocks Weekly ➞ Best Stocks Year-to-Date ➞ Best Stocks Trends ➞  Best Stocks Today 12Stocks.com Best Nasdaq Stocks ➞ Best S&P 500 Stocks ➞ Best Tech Stocks ➞ Best Biotech Stocks ➞ |
| Detailed Overview of Tech Stocks |
| Tech Technical Overview, Leaders & Laggards, Top Tech ETF Funds & Detailed Tech Stocks List, Charts, Trends & More |
| Tech Sector: Technical Analysis, Trends & YTD Performance | |
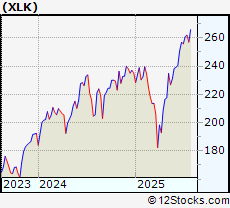
| Technology sector is composed of stocks
from semiconductors, software, web, social media
and services subsectors. Technology sector, as represented by XLK, an exchange-traded fund [ETF] that holds basket of tech stocks (e.g, Intel, Google) is up by 23.7823% and is currently outperforming the overall market by 9.0244% year-to-date. Below is a quick view of technical charts and trends: |
|
 XLK Weekly Chart |
|
| Long Term Trend: Very Good | |
| Medium Term Trend: Good | |
 XLK Daily Chart |
|
| Short Term Trend: Very Good | |
| Overall Trend Score: 100 | |
| YTD Performance: 23.7823% | |
| **Trend Scores & Views Are Only For Educational Purposes And Not For Investing | |
| 12Stocks.com: Top Performing Technology Sector Stocks | ||||||||||||||||||||||||||||||||||||||||||||||||
 The top performing Technology sector stocks year to date are
Now, more recently, over last week, the top performing Technology sector stocks on the move are


|
||||||||||||||||||||||||||||||||||||||||||||||||
| 12Stocks.com: Investing in Tech Sector using Exchange Traded Funds | |
|
The following table shows list of key exchange traded funds (ETF) that
help investors track Tech Index. For detailed view, check out our ETF Funds section of our website. Quick View: Move mouse or cursor over ETF symbol (ticker) to view short-term technical chart and over ETF name to view long term chart. Click on ticker or stock name for detailed view. Click on to add stock symbol to your watchlist and to view watchlist. |
12Stocks.com List of ETFs that track Tech Index
| Ticker | ETF Name | Watchlist | Recent Price | Smart Investing & Trading Score | Change % | Week % | Year-to-date % |
| IGN | Tech-Multimd Ntwk | | 53.86 | 40 | 0.918119 | -20.6435 | 0% |
| 12Stocks.com: Charts, Trends, Fundamental Data and Performances of Tech Stocks | |
|
We now take in-depth look at all Tech stocks including charts, multi-period performances and overall trends (as measured by Smart Investing & Trading Score). One can sort Tech stocks (click link to choose) by Daily, Weekly and by Year-to-Date performances. Also, one can sort by size of the company or by market capitalization. |
| Select Your Default Chart Type: | |||||
| |||||
| Click on stock symbol or name for detailed view. Click on to add stock symbol to your watchlist and to view watchlist. Quick View: Move mouse or cursor over "Daily" to quickly view daily technical stock chart and over "Weekly" to view weekly technical stock chart. | |||||


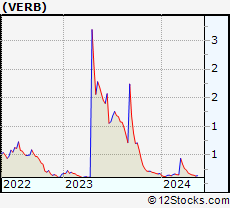 | VERB Verb Technology Company, Inc. |
| Sector: Technology | |
| SubSector: Application Software | |
| MarketCap: 30.6662 Millions | |
| Recent Price: 6.82 Smart Investing & Trading Score: 30 | |
| Day Percent Change: -1.72911% Day Change: 0.09 | |
| Week Change: -3.80818% Year-to-date Change: 64.3% | |
| VERB Links: Profile News Message Board | |
| Charts:- Daily , Weekly | |
| Add VERB to Watchlist: View: Get Complete VERB Trend Analysis ➞ | |
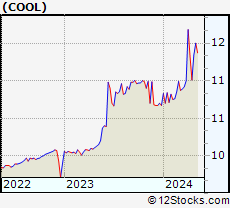 | COOL PolarityTE, Inc. |
| Sector: Technology | |
| SubSector: Multimedia & Graphics Software | |
| MarketCap: 34.78 Millions | |
| Recent Price: 11.10 Smart Investing & Trading Score: 10 | |
| Day Percent Change: -1.13737% Day Change: -9999 | |
| Week Change: -3.8961% Year-to-date Change: 0.0% | |
| COOL Links: Profile News Message Board | |
| Charts:- Daily , Weekly | |
| Add COOL to Watchlist: View: Get Complete COOL Trend Analysis ➞ | |
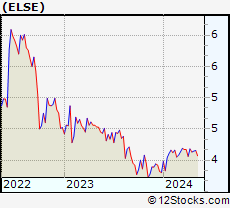 | ELSE Electro-Sensors, Inc |
| Sector: Technology | |
| SubSector: Scientific & Technical Instruments | |
| MarketCap: 16.35 Millions | |
| Recent Price: 4.80 Smart Investing & Trading Score: 80 | |
| Day Percent Change: 0% Day Change: -0.05 | |
| Week Change: -3.908% Year-to-date Change: -7.5% | |
| ELSE Links: Profile News Message Board | |
| Charts:- Daily , Weekly | |
| Add ELSE to Watchlist: View: Get Complete ELSE Trend Analysis ➞ | |
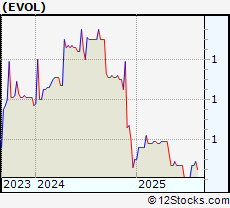 | EVOL Evolving Systems, Inc. |
| Sector: Technology | |
| SubSector: Technical & System Software | |
| MarketCap: 8.3 Millions | |
| Recent Price: 0.45 Smart Investing & Trading Score: 20 | |
| Day Percent Change: -8.16327% Day Change: -0.49 | |
| Week Change: -4.25532% Year-to-date Change: -6.3% | |
| EVOL Links: Profile News Message Board | |
| Charts:- Daily , Weekly | |
| Add EVOL to Watchlist: View: Get Complete EVOL Trend Analysis ➞ | |
 | CMCM Cheetah Mobile Inc ADR |
| Sector: Technology | |
| SubSector: Internet Content & Information | |
| MarketCap: 66.3 Millions | |
| Recent Price: 8.30 Smart Investing & Trading Score: 60 | |
| Day Percent Change: 2.97767% Day Change: 0.15 | |
| Week Change: -4.26759% Year-to-date Change: 80.4% | |
| CMCM Links: Profile News Message Board | |
| Charts:- Daily , Weekly | |
| Add CMCM to Watchlist: View: Get Complete CMCM Trend Analysis ➞ | |
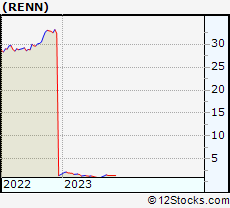 | RENN Renren Inc. |
| Sector: Technology | |
| SubSector: Internet Software & Services | |
| MarketCap: 19.2991 Millions | |
| Recent Price: 1.17 Smart Investing & Trading Score: 20 | |
| Day Percent Change: -3.7037% Day Change: -9999 | |
| Week Change: -4.4898% Year-to-date Change: 0.0% | |
| RENN Links: Profile News Message Board | |
| Charts:- Daily , Weekly | |
| Add RENN to Watchlist: View: Get Complete RENN Trend Analysis ➞ | |
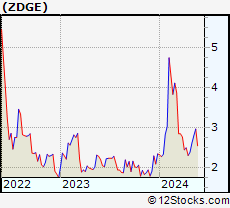 | ZDGE Zedge Inc |
| Sector: Technology | |
| SubSector: Internet Content & Information | |
| MarketCap: 41.44 Millions | |
| Recent Price: 2.95 Smart Investing & Trading Score: 10 | |
| Day Percent Change: 0.682594% Day Change: 0 | |
| Week Change: -4.53074% Year-to-date Change: 8.9% | |
| ZDGE Links: Profile News Message Board | |
| Charts:- Daily , Weekly | |
| Add ZDGE to Watchlist: View: Get Complete ZDGE Trend Analysis ➞ | |
 | BHAT Blue Hat Interactive Entertainment Technology |
| Sector: Technology | |
| SubSector: Electronic Gaming & Multimedia | |
| MarketCap: 12.57 Millions | |
| Recent Price: 1.83 Smart Investing & Trading Score: 60 | |
| Day Percent Change: -3.1746% Day Change: -0.01 | |
| Week Change: -4.6875% Year-to-date Change: -87.6% | |
| BHAT Links: Profile News Message Board | |
| Charts:- Daily , Weekly | |
| Add BHAT to Watchlist: View: Get Complete BHAT Trend Analysis ➞ | |
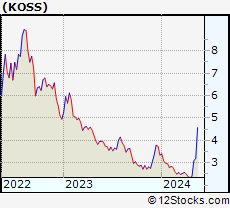 | KOSS Koss Corp |
| Sector: Technology | |
| SubSector: Consumer Electronics | |
| MarketCap: 58.16 Millions | |
| Recent Price: 5.18 Smart Investing & Trading Score: 10 | |
| Day Percent Change: -0.766284% Day Change: 0.05 | |
| Week Change: -4.86685% Year-to-date Change: -30.2% | |
| KOSS Links: Profile News Message Board | |
| Charts:- Daily , Weekly | |
| Add KOSS to Watchlist: View: Get Complete KOSS Trend Analysis ➞ | |
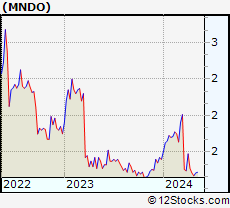 | MNDO Mind C.T.I Ltd |
| Sector: Technology | |
| SubSector: Software - Application | |
| MarketCap: 24.64 Millions | |
| Recent Price: 1.12 Smart Investing & Trading Score: 20 | |
| Day Percent Change: 0.900901% Day Change: 0 | |
| Week Change: -4.93167% Year-to-date Change: -37.9% | |
| MNDO Links: Profile News Message Board | |
| Charts:- Daily , Weekly | |
| Add MNDO to Watchlist: View: Get Complete MNDO Trend Analysis ➞ | |
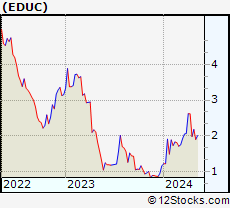 | EDUC Educational Development Corp |
| Sector: Technology | |
| SubSector: Publishing | |
| MarketCap: 9.44 Millions | |
| Recent Price: 1.30 Smart Investing & Trading Score: 30 | |
| Day Percent Change: -2.25564% Day Change: 0 | |
| Week Change: -5.10949% Year-to-date Change: -21.7% | |
| EDUC Links: Profile News Message Board | |
| Charts:- Daily , Weekly | |
| Add EDUC to Watchlist: View: Get Complete EDUC Trend Analysis ➞ | |
 | ISNS Image Sensing Systems, Inc. |
| Sector: Technology | |
| SubSector: Scientific & Technical Instruments | |
| MarketCap: 18.4553 Millions | |
| Recent Price: 7.59 Smart Investing & Trading Score: 20 | |
| Day Percent Change: 5.12465% Day Change: -9999 | |
| Week Change: -5.24345% Year-to-date Change: 0.0% | |
| ISNS Links: Profile News Message Board | |
| Charts:- Daily , Weekly | |
| Add ISNS to Watchlist: View: Get Complete ISNS Trend Analysis ➞ | |
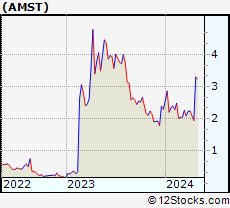 | AMST Amesite Inc |
| Sector: Technology | |
| SubSector: Software - Application | |
| MarketCap: 12.53 Millions | |
| Recent Price: 3.07 Smart Investing & Trading Score: 40 | |
| Day Percent Change: 0.986842% Day Change: -0.07 | |
| Week Change: -5.53846% Year-to-date Change: -30.4% | |
| AMST Links: Profile News Message Board | |
| Charts:- Daily , Weekly | |
| Add AMST to Watchlist: View: Get Complete AMST Trend Analysis ➞ | |
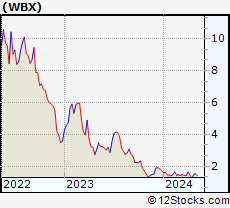 | WBX Wallbox N.V |
| Sector: Technology | |
| SubSector: Electronic Components | |
| MarketCap: 57.02 Millions | |
| Recent Price: 4.58 Smart Investing & Trading Score: 40 | |
| Day Percent Change: 0.659341% Day Change: -0.13 | |
| Week Change: -5.56701% Year-to-date Change: -65.6% | |
| WBX Links: Profile News Message Board | |
| Charts:- Daily , Weekly | |
| Add WBX to Watchlist: View: Get Complete WBX Trend Analysis ➞ | |
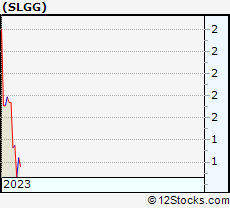 | SLGG Super League Gaming, Inc. |
| Sector: Technology | |
| SubSector: Multimedia & Graphics Software | |
| MarketCap: 23.3586 Millions | |
| Recent Price: 1.16 Smart Investing & Trading Score: 20 | |
| Day Percent Change: -9.36719% Day Change: -9999 | |
| Week Change: -5.68293% Year-to-date Change: 0.0% | |
| SLGG Links: Profile News Message Board | |
| Charts:- Daily , Weekly | |
| Add SLGG to Watchlist: View: Get Complete SLGG Trend Analysis ➞ | |
 | AIXI Xiao-I Corp ADR |
| Sector: Technology | |
| SubSector: Software - Application | |
| MarketCap: 15.87 Millions | |
| Recent Price: 1.23 Smart Investing & Trading Score: 43 | |
| Day Percent Change: 1.47% Day Change: 0.02 | |
| Week Change: -6.39% Year-to-date Change: -74.9% | |
| AIXI Links: Profile News Message Board | |
| Charts:- Daily , Weekly | |
| Add AIXI to Watchlist: View: Get Complete AIXI Trend Analysis ➞ | |
 | GIGM Gigamedia |
| Sector: Technology | |
| SubSector: Electronic Gaming & Multimedia | |
| MarketCap: 18.35 Millions | |
| Recent Price: 1.65 Smart Investing & Trading Score: 30 | |
| Day Percent Change: -1.78571% Day Change: -0.05 | |
| Week Change: -7.82123% Year-to-date Change: 10.0% | |
| GIGM Links: Profile News Message Board | |
| Charts:- Daily , Weekly | |
| Add GIGM to Watchlist: View: Get Complete GIGM Trend Analysis ➞ | |
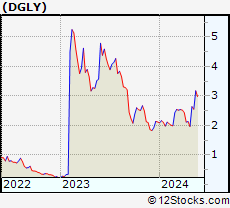 | DGLY Digital Ally Inc |
| Sector: Technology | |
| SubSector: Internet Content & Information | |
| MarketCap: 3.06 Millions | |
| Recent Price: 2.04 Smart Investing & Trading Score: 90 | |
| Day Percent Change: 3.0303% Day Change: 0.06 | |
| Week Change: -8.52018% Year-to-date Change: -99.8% | |
| DGLY Links: Profile News Message Board | |
| Charts:- Daily , Weekly | |
| Add DGLY to Watchlist: View: Get Complete DGLY Trend Analysis ➞ | |
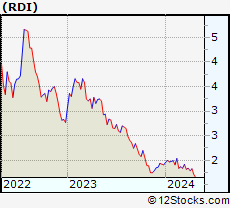 | RDI Reading International Inc |
| Sector: Technology | |
| SubSector: Entertainment | |
| MarketCap: 53.11 Millions | |
| Recent Price: 1.44 Smart Investing & Trading Score: 20 | |
| Day Percent Change: -0.689655% Day Change: 0.02 | |
| Week Change: -8.86076% Year-to-date Change: 4.3% | |
| RDI Links: Profile News Message Board | |
| Charts:- Daily , Weekly | |
| Add RDI to Watchlist: View: Get Complete RDI Trend Analysis ➞ | |
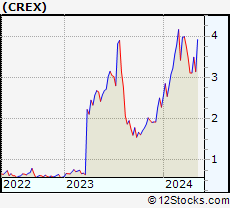 | CREX Creative Realities Inc |
| Sector: Technology | |
| SubSector: Software - Application | |
| MarketCap: 24.61 Millions | |
| Recent Price: 2.26 Smart Investing & Trading Score: 40 | |
| Day Percent Change: -2.1645% Day Change: 0.1 | |
| Week Change: -8.87097% Year-to-date Change: -9.6% | |
| CREX Links: Profile News Message Board | |
| Charts:- Daily , Weekly | |
| Add CREX to Watchlist: View: Get Complete CREX Trend Analysis ➞ | |
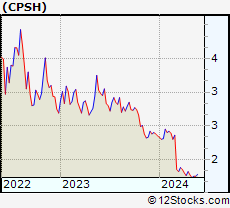 | CPSH CPS Technologies Corporation |
| Sector: Technology | |
| SubSector: Electronic Components | |
| MarketCap: 48.81 Millions | |
| Recent Price: 3.68 Smart Investing & Trading Score: 80 | |
| Day Percent Change: 3.08123% Day Change: 0.11 | |
| Week Change: -9.35961% Year-to-date Change: 130.0% | |
| CPSH Links: Profile News Message Board | |
| Charts:- Daily , Weekly | |
| Add CPSH to Watchlist: View: Get Complete CPSH Trend Analysis ➞ | |
 | JG Aurora Mobile Ltd ADR |
| Sector: Technology | |
| SubSector: Software - Infrastructure | |
| MarketCap: 46.35 Millions | |
| Recent Price: 8.10 Smart Investing & Trading Score: 10 | |
| Day Percent Change: -0.303903% Day Change: 0.26 | |
| Week Change: -9.4648% Year-to-date Change: 18.3% | |
| JG Links: Profile News Message Board | |
| Charts:- Daily , Weekly | |
| Add JG to Watchlist: View: Get Complete JG Trend Analysis ➞ | |
 | CDLX Cardlytics Inc |
| Sector: Technology | |
| SubSector: Advertising Agencies | |
| MarketCap: 49.63 Millions | |
| Recent Price: 2.38 Smart Investing & Trading Score: 80 | |
| Day Percent Change: 1.05932% Day Change: -0.04 | |
| Week Change: -9.65909% Year-to-date Change: -36.1% | |
| CDLX Links: Profile News Message Board | |
| Charts:- Daily , Weekly | |
| Add CDLX to Watchlist: View: Get Complete CDLX Trend Analysis ➞ | |
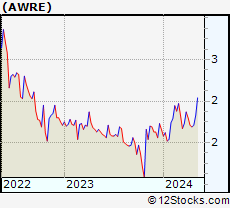 | AWRE Aware Inc |
| Sector: Technology | |
| SubSector: Software - Application | |
| MarketCap: 48.38 Millions | |
| Recent Price: 2.36 Smart Investing & Trading Score: 40 | |
| Day Percent Change: 0.0423729% Day Change: 0.05 | |
| Week Change: -9.8855% Year-to-date Change: 41.4% | |
| AWRE Links: Profile News Message Board | |
| Charts:- Daily , Weekly | |
| Add AWRE to Watchlist: View: Get Complete AWRE Trend Analysis ➞ | |
 | KRKR 36Kr Holdings Inc ADR |
| Sector: Technology | |
| SubSector: Advertising Agencies | |
| MarketCap: 9.33 Millions | |
| Recent Price: 7.27 Smart Investing & Trading Score: 50 | |
| Day Percent Change: 0.275862% Day Change: -0.24 | |
| Week Change: -10.136% Year-to-date Change: 142.3% | |
| KRKR Links: Profile News Message Board | |
| Charts:- Daily , Weekly | |
| Add KRKR to Watchlist: View: Get Complete KRKR Trend Analysis ➞ | |
| For tabular summary view of above stock list: Summary View ➞ 0 - 25 , 25 - 50 , 50 - 75 , 75 - 100 , 100 - 125 , 125 - 150 , 150 - 175 , 175 - 200 | ||
| Click To Change The Sort Order: By Market Cap or Company Size Performance: Year-to-date, Week and Day | |
| Select Chart Type: | ||
|
Best Stocks Today 12Stocks.com |
© 2025 12Stocks.com Terms & Conditions Privacy Contact Us
All Information Provided Only For Education And Not To Be Used For Investing or Trading. See Terms & Conditions


One More Thing ... Get Best Stocks Delivered Daily!
Never Ever Miss A Move With Our Top Ten Stocks Lists
Find Best Stocks In Any Market - Bull or Bear Market
Take A Peek At Our Top Ten Stocks Lists: Daily, Weekly, Year-to-Date & Top Trends
Find Best Stocks In Any Market - Bull or Bear Market
Take A Peek At Our Top Ten Stocks Lists: Daily, Weekly, Year-to-Date & Top Trends
Technology Stocks With Best Up Trends [0-bearish to 100-bullish]: Sony [100], Bakkt [100], Rigetti Computing[100], Fair Isaac[100], Arqit Quantum[100], D-Wave Quantum[100], Navitas Semiconductor[100], Shoals [100], Vuzix [100], Arteris [100], Lantronix [100]
Best Technology Stocks Year-to-Date:
Xunlei [370.476%], Sify [315.033%], Wolfspeed [307.01%], Digital Turbine[265.057%], EchoStar Corp[247.253%], CuriosityStream [241.605%], Viasat [224.029%], Pagaya [222.638%], Oneconnect Financial[209.053%], D-Wave Quantum[203.954%], CommScope Holding[203.101%] Best Technology Stocks This Week:
GTT [443626%], Barracuda Networks[71050%], Mobile TeleSystems[10483.5%], Nam Tai[5033.33%], Ebix [4200.85%], Fang [4150%], NantHealth [3114.02%], Hemisphere Media[2981.82%], Yandex N.V[2935.27%], Wolfspeed [1961.98%], Castlight Health[1751.96%] Best Technology Stocks Daily:
Sony [194.565%], Bakkt [28.6091%], Rigetti Computing[18.4925%], Fair Isaac[17.979%], Arqit Quantum[17.9369%], Marti [17%], Latch [16.6667%], Oclaro [14.734%], D-Wave Quantum[13.968%], Arbe Robotics[13.0178%], Navitas Semiconductor[12.3288%]