
 Login Sign Up


| |||||
 |  | ||||

| 12Stocks.com Market Intelligence |
Best Tech Stocks
| In a hurry? Tech Stocks Lists: Performance & Trends, Stock Charts, FANG Stocks
Sort Tech stocks: Daily, Weekly, Year-to-Date, Market Cap & Trends. Filter Tech stocks list by size:All Tech Large Mid-Range Small and MicroCap |
| 12Stocks.com Tech Stocks Performances & Trends Daily | |||||||||
|
|  The overall Smart Investing & Trading Score is 100 (0-bearish to 100-bullish) which puts Technology sector in short term bullish trend. The Smart Investing & Trading Score from previous trading session is 90 and an improvement of trend continues.
| ||||||||
Here are the Smart Investing & Trading Scores of the most requested Technology stocks at 12Stocks.com (click stock name for detailed review):
|


| 12Stocks.com: Investing in Technology sector with Stocks | |
|
The following table helps investors and traders sort through current performance and trends (as measured by Smart Investing & Trading Score) of various
stocks in the Tech sector. Quick View: Move mouse or cursor over stock symbol (ticker) to view short-term technical chart and over stock name to view long term chart. Click on  to add stock symbol to your watchlist and to add stock symbol to your watchlist and  to view watchlist. Click on any ticker or stock name for detailed market intelligence report for that stock. to view watchlist. Click on any ticker or stock name for detailed market intelligence report for that stock. |
12Stocks.com Performance of Stocks in Tech Sector
| Ticker | Stock Name | Watchlist | Category | Recent Price | Smart Investing & Trading Score | Change % | Weekly Change% |
| CYRN | CYREN |   | Security Software | 24.96 | 70 | -0.40% | 89,042.90% |
| RNWK | RealNetworks | | Software | 14.23 | 100 | 3.87% | 1,849.32% |
| DTRM | Determine | | Software | 35.33 | 70 | -0.11% | 1,228.20% |
| MRVC | MRV | | Networking | 15.23 | 90 | 1.80% | 1,011.68% |
| SYNC | Synacor | | Internet | 64.54 | 70 | 0.88% | 831.31% |
| VJET | voxeljet AG | | Computer | 4.94 | 80 | 1.23% | 744.44% |
| CETX | Cemtrex | | Software - Infrastructure | 5.29 | 70 | -8.32% | 741.82% |
| RESN | Resonant | | Semiconductor | 23.15 | 100 | 416.74% | 416.74% |
| SPRT | Support.com | | Internet | 35.33 | 70 | -0.11% | 199.41% |
| IEC | IEC Electronics | | Circuit Boards | 35.38 | 100 | 1.90% | 130.64% |
| JRJC | China Finance | | Internet | 2.71 | 60 | 0.00% | 115.08% |
| EMAN | eMagin | | Semiconductor | 4.11 | 70 | -2.14% | 104.48% |
| BSQR | BSQUARE | | Software | 3.86 | 70 | 3.21% | 104.23% |
| GSUM | Gridsum Holding | | Software | 3.49 | 80 | -0.29% | 78.97% |
| PRCP | Perceptron | | Instruments | 24.96 | 60 | -0.40% | 74.55% |
| PNTR | Pointer Telocation | | Communication | 1.65 | 40 | -0.60% | 65.00% |
| QH | Quhuo | | Software - | 9.05 | 90 | 11.73% | 43.76% |
| PBTS | Powerbridge | | Software | 0.85 | 40 | -9.10% | 42.85% |
| CCIH | ChinaCache | | Internet | 2.09 | 40 | -0.48% | 41.22% |
| SCOR | Comscore | | Internet Content & Information | 8.30 | 60 | -2.81% | 28.38% |
| WISA | Summit Wireless | | Semiconductor | 0.82 | 50 | 5.14% | 25.30% |
| RNET | RigNet | | Wireless | 1.65 | 30 | 1.85% | 25.00% |
| PXLW | Pixelworks | | Semiconductors | 11.98 | 100 | 9.31% | 20.52% |
| MOSY | MoSys | | Semiconductor | 202.80 | 80 | 9.50% | 20.14% |
| NLST | Netlist | | Semiconductor- | 0.84 | 90 | -2.33% | 20.00% |
| For chart view version of above stock list: Chart View ➞ 0 - 25 , 25 - 50 , 50 - 75 , 75 - 100 , 100 - 125 , 125 - 150 , 150 - 175 , 175 - 200 | ||
 | Click To Change The Sort Order: By Market Cap or Company Size Performance: Year-to-date, Week and Day |  |
|
Get the most comprehensive stock market coverage daily at 12Stocks.com ➞ Best Stocks Today ➞ Best Stocks Weekly ➞ Best Stocks Year-to-Date ➞ Best Stocks Trends ➞  Best Stocks Today 12Stocks.com Best Nasdaq Stocks ➞ Best S&P 500 Stocks ➞ Best Tech Stocks ➞ Best Biotech Stocks ➞ |
| Detailed Overview of Tech Stocks |
| Tech Technical Overview, Leaders & Laggards, Top Tech ETF Funds & Detailed Tech Stocks List, Charts, Trends & More |
| Tech Sector: Technical Analysis, Trends & YTD Performance | |
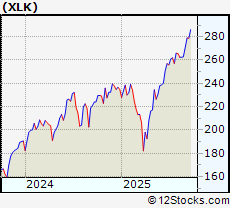
| Technology sector is composed of stocks
from semiconductors, software, web, social media
and services subsectors. Technology sector, as represented by XLK, an exchange-traded fund [ETF] that holds basket of tech stocks (e.g, Intel, Google) is up by 23.7823% and is currently outperforming the overall market by 9.0244% year-to-date. Below is a quick view of technical charts and trends: |
|
 XLK Weekly Chart |
|
| Long Term Trend: Very Good | |
| Medium Term Trend: Good | |
 XLK Daily Chart |
|
| Short Term Trend: Very Good | |
| Overall Trend Score: 100 | |
| YTD Performance: 23.7823% | |
| **Trend Scores & Views Are Only For Educational Purposes And Not For Investing | |
| 12Stocks.com: Top Performing Technology Sector Stocks | ||||||||||||||||||||||||||||||||||||||||||||||||
 The top performing Technology sector stocks year to date are
Now, more recently, over last week, the top performing Technology sector stocks on the move are


|
||||||||||||||||||||||||||||||||||||||||||||||||
| 12Stocks.com: Investing in Tech Sector using Exchange Traded Funds | |
|
The following table shows list of key exchange traded funds (ETF) that
help investors track Tech Index. For detailed view, check out our ETF Funds section of our website. Quick View: Move mouse or cursor over ETF symbol (ticker) to view short-term technical chart and over ETF name to view long term chart. Click on ticker or stock name for detailed view. Click on to add stock symbol to your watchlist and to view watchlist. |
12Stocks.com List of ETFs that track Tech Index
| Ticker | ETF Name | Watchlist | Recent Price | Smart Investing & Trading Score | Change % | Week % | Year-to-date % |
| IGN | Tech-Multimd Ntwk | | 53.86 | 40 | 0.918119 | -20.6435 | 0% |
| 12Stocks.com: Charts, Trends, Fundamental Data and Performances of Tech Stocks | |
|
We now take in-depth look at all Tech stocks including charts, multi-period performances and overall trends (as measured by Smart Investing & Trading Score). One can sort Tech stocks (click link to choose) by Daily, Weekly and by Year-to-Date performances. Also, one can sort by size of the company or by market capitalization. |
| Select Your Default Chart Type: | |||||
| |||||
| Click on stock symbol or name for detailed view. Click on to add stock symbol to your watchlist and to view watchlist. Quick View: Move mouse or cursor over "Daily" to quickly view daily technical stock chart and over "Weekly" to view weekly technical stock chart. | |||||


 | CYRN CYREN Ltd. |
| Sector: Technology | |
| SubSector: Security Software & Services | |
| MarketCap: 45.4317 Millions | |
| Recent Price: 24.96 Smart Investing & Trading Score: 70 | |
| Day Percent Change: -0.399042% Day Change: -9999 | |
| Week Change: 89042.9% Year-to-date Change: 0.0% | |
| CYRN Links: Profile News Message Board | |
| Charts:- Daily , Weekly | |
| Add CYRN to Watchlist: View: Get Complete CYRN Trend Analysis ➞ | |
 | RNWK RealNetworks, Inc. |
| Sector: Technology | |
| SubSector: Multimedia & Graphics Software | |
| MarketCap: 20.7586 Millions | |
| Recent Price: 14.23 Smart Investing & Trading Score: 100 | |
| Day Percent Change: 3.86861% Day Change: -9999 | |
| Week Change: 1849.32% Year-to-date Change: 0.0% | |
| RNWK Links: Profile News Message Board | |
| Charts:- Daily , Weekly | |
| Add RNWK to Watchlist: View: Get Complete RNWK Trend Analysis ➞ | |
 | DTRM Determine, Inc. |
| Sector: Technology | |
| SubSector: Application Software | |
| MarketCap: 37.62 Millions | |
| Recent Price: 35.33 Smart Investing & Trading Score: 70 | |
| Day Percent Change: -0.11309% Day Change: -9999 | |
| Week Change: 1228.2% Year-to-date Change: 0.0% | |
| DTRM Links: Profile News Message Board | |
| Charts:- Daily , Weekly | |
| Add DTRM to Watchlist: View: Get Complete DTRM Trend Analysis ➞ | |
 | MRVC MRV Communications, Inc. |
| Sector: Technology | |
| SubSector: Networking & Communication Devices | |
| MarketCap: 48.01 Millions | |
| Recent Price: 15.23 Smart Investing & Trading Score: 90 | |
| Day Percent Change: 1.80481% Day Change: -9999 | |
| Week Change: 1011.68% Year-to-date Change: 0.0% | |
| MRVC Links: Profile News Message Board | |
| Charts:- Daily , Weekly | |
| Add MRVC to Watchlist: View: Get Complete MRVC Trend Analysis ➞ | |
 | SYNC Synacor, Inc. |
| Sector: Technology | |
| SubSector: Internet Information Providers | |
| MarketCap: 36.808 Millions | |
| Recent Price: 64.54 Smart Investing & Trading Score: 70 | |
| Day Percent Change: 0.875274% Day Change: -9999 | |
| Week Change: 831.313% Year-to-date Change: 0.0% | |
| SYNC Links: Profile News Message Board | |
| Charts:- Daily , Weekly | |
| Add SYNC to Watchlist: View: Get Complete SYNC Trend Analysis ➞ | |
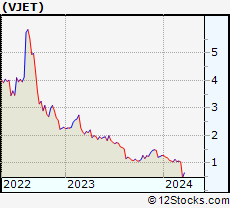 | VJET voxeljet AG |
| Sector: Technology | |
| SubSector: Computer Peripherals | |
| MarketCap: 18.0989 Millions | |
| Recent Price: 4.94 Smart Investing & Trading Score: 80 | |
| Day Percent Change: 1.22951% Day Change: -9999 | |
| Week Change: 744.444% Year-to-date Change: 0.0% | |
| VJET Links: Profile News Message Board | |
| Charts:- Daily , Weekly | |
| Add VJET to Watchlist: View: Get Complete VJET Trend Analysis ➞ | |
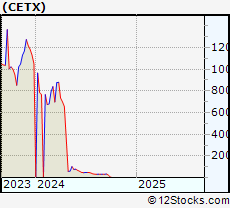 | CETX Cemtrex Inc |
| Sector: Technology | |
| SubSector: Software - Infrastructure | |
| MarketCap: 5.08 Millions | |
| Recent Price: 5.29 Smart Investing & Trading Score: 70 | |
| Day Percent Change: -8.31889% Day Change: 0.01 | |
| Week Change: 741.82% Year-to-date Change: 86.3% | |
| CETX Links: Profile News Message Board | |
| Charts:- Daily , Weekly | |
| Add CETX to Watchlist: View: Get Complete CETX Trend Analysis ➞ | |
 | RESN Resonant Inc. |
| Sector: Technology | |
| SubSector: Semiconductor - Integrated Circuits | |
| MarketCap: 64.951 Millions | |
| Recent Price: 23.15 Smart Investing & Trading Score: 100 | |
| Day Percent Change: 416.741% Day Change: -9999 | |
| Week Change: 416.741% Year-to-date Change: 0.0% | |
| RESN Links: Profile News Message Board | |
| Charts:- Daily , Weekly | |
| Add RESN to Watchlist: View: Get Complete RESN Trend Analysis ➞ | |
 | SPRT Support.com, Inc. |
| Sector: Technology | |
| SubSector: Internet Software & Services | |
| MarketCap: 19.2991 Millions | |
| Recent Price: 35.33 Smart Investing & Trading Score: 70 | |
| Day Percent Change: -0.11309% Day Change: -9999 | |
| Week Change: 199.407% Year-to-date Change: 0.0% | |
| SPRT Links: Profile News Message Board | |
| Charts:- Daily , Weekly | |
| Add SPRT to Watchlist: View: Get Complete SPRT Trend Analysis ➞ | |
 | IEC IEC Electronics Corp. |
| Sector: Technology | |
| SubSector: Printed Circuit Boards | |
| MarketCap: 63.2235 Millions | |
| Recent Price: 35.38 Smart Investing & Trading Score: 100 | |
| Day Percent Change: 1.90092% Day Change: -9999 | |
| Week Change: 130.639% Year-to-date Change: 0.0% | |
| IEC Links: Profile News Message Board | |
| Charts:- Daily , Weekly | |
| Add IEC to Watchlist: View: Get Complete IEC Trend Analysis ➞ | |
 | JRJC China Finance Online Co. Limited |
| Sector: Technology | |
| SubSector: Internet Information Providers | |
| MarketCap: 11.808 Millions | |
| Recent Price: 2.71 Smart Investing & Trading Score: 60 | |
| Day Percent Change: 0% Day Change: -9999 | |
| Week Change: 115.079% Year-to-date Change: 0.0% | |
| JRJC Links: Profile News Message Board | |
| Charts:- Daily , Weekly | |
| Add JRJC to Watchlist: View: Get Complete JRJC Trend Analysis ➞ | |
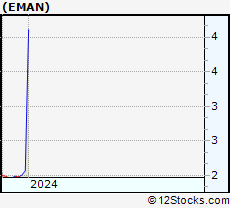 | EMAN eMagin Corporation |
| Sector: Technology | |
| SubSector: Semiconductor Equipment & Materials | |
| MarketCap: 11.9918 Millions | |
| Recent Price: 4.11 Smart Investing & Trading Score: 70 | |
| Day Percent Change: -2.14286% Day Change: -9999 | |
| Week Change: 104.478% Year-to-date Change: 0.0% | |
| EMAN Links: Profile News Message Board | |
| Charts:- Daily , Weekly | |
| Add EMAN to Watchlist: View: Get Complete EMAN Trend Analysis ➞ | |
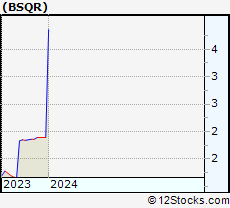 | BSQR BSQUARE Corporation |
| Sector: Technology | |
| SubSector: Application Software | |
| MarketCap: 13.2662 Millions | |
| Recent Price: 3.86 Smart Investing & Trading Score: 70 | |
| Day Percent Change: 3.20856% Day Change: -9999 | |
| Week Change: 104.233% Year-to-date Change: 0.0% | |
| BSQR Links: Profile News Message Board | |
| Charts:- Daily , Weekly | |
| Add BSQR to Watchlist: View: Get Complete BSQR Trend Analysis ➞ | |
 | GSUM Gridsum Holding Inc. |
| Sector: Technology | |
| SubSector: Application Software | |
| MarketCap: 20.9662 Millions | |
| Recent Price: 3.49 Smart Investing & Trading Score: 80 | |
| Day Percent Change: -0.285714% Day Change: -9999 | |
| Week Change: 78.9744% Year-to-date Change: 0.0% | |
| GSUM Links: Profile News Message Board | |
| Charts:- Daily , Weekly | |
| Add GSUM to Watchlist: View: Get Complete GSUM Trend Analysis ➞ | |
 | PRCP Perceptron, Inc. |
| Sector: Technology | |
| SubSector: Scientific & Technical Instruments | |
| MarketCap: 28.9553 Millions | |
| Recent Price: 24.96 Smart Investing & Trading Score: 60 | |
| Day Percent Change: -0.399042% Day Change: -9999 | |
| Week Change: 74.5455% Year-to-date Change: 0.0% | |
| PRCP Links: Profile News Message Board | |
| Charts:- Daily , Weekly | |
| Add PRCP to Watchlist: View: Get Complete PRCP Trend Analysis ➞ | |
 | PNTR Pointer Telocation Ltd. |
| Sector: Technology | |
| SubSector: Communication Equipment | |
| MarketCap: 68.71 Millions | |
| Recent Price: 1.65 Smart Investing & Trading Score: 40 | |
| Day Percent Change: -0.60241% Day Change: -9999 | |
| Week Change: 65% Year-to-date Change: 0.0% | |
| PNTR Links: Profile News Message Board | |
| Charts:- Daily , Weekly | |
| Add PNTR to Watchlist: View: Get Complete PNTR Trend Analysis ➞ | |
 | QH Quhuo Ltd ADR |
| Sector: Technology | |
| SubSector: Software - Application | |
| MarketCap: 5.35 Millions | |
| Recent Price: 9.05 Smart Investing & Trading Score: 90 | |
| Day Percent Change: 11.7284% Day Change: -0.04 | |
| Week Change: 43.7649% Year-to-date Change: 511.5% | |
| QH Links: Profile News Message Board | |
| Charts:- Daily , Weekly | |
| Add QH to Watchlist: View: Get Complete QH Trend Analysis ➞ | |
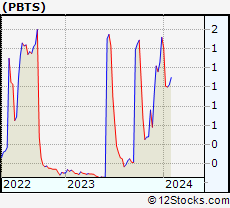 | PBTS Powerbridge Technologies Co., Ltd. |
| Sector: Technology | |
| SubSector: Application Software | |
| MarketCap: 19.0662 Millions | |
| Recent Price: 0.85 Smart Investing & Trading Score: 40 | |
| Day Percent Change: -9.09967% Day Change: -9999 | |
| Week Change: 42.8499% Year-to-date Change: 0.0% | |
| PBTS Links: Profile News Message Board | |
| Charts:- Daily , Weekly | |
| Add PBTS to Watchlist: View: Get Complete PBTS Trend Analysis ➞ | |
 | CCIH ChinaCache International Holdings Ltd. |
| Sector: Technology | |
| SubSector: Internet Information Providers | |
| MarketCap: 44.73 Millions | |
| Recent Price: 2.09 Smart Investing & Trading Score: 40 | |
| Day Percent Change: -0.47619% Day Change: -9999 | |
| Week Change: 41.2162% Year-to-date Change: 0.0% | |
| CCIH Links: Profile News Message Board | |
| Charts:- Daily , Weekly | |
| Add CCIH to Watchlist: View: Get Complete CCIH Trend Analysis ➞ | |
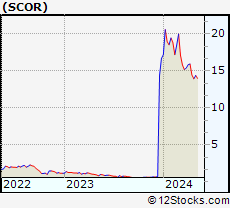 | SCOR Comscore Inc |
| Sector: Technology | |
| SubSector: Internet Content & Information | |
| MarketCap: 32.14 Millions | |
| Recent Price: 8.30 Smart Investing & Trading Score: 60 | |
| Day Percent Change: -2.8103% Day Change: -0.17 | |
| Week Change: 28.3836% Year-to-date Change: 23.7% | |
| SCOR Links: Profile News Message Board | |
| Charts:- Daily , Weekly | |
| Add SCOR to Watchlist: View: Get Complete SCOR Trend Analysis ➞ | |
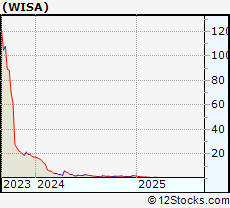 | WISA Summit Wireless Technologies, Inc. |
| Sector: Technology | |
| SubSector: Semiconductor - Broad Line | |
| MarketCap: 8.42242 Millions | |
| Recent Price: 0.82 Smart Investing & Trading Score: 50 | |
| Day Percent Change: 5.14043% Day Change: -9999 | |
| Week Change: 25.3032% Year-to-date Change: -60.0% | |
| WISA Links: Profile News Message Board | |
| Charts:- Daily , Weekly | |
| Add WISA to Watchlist: View: Get Complete WISA Trend Analysis ➞ | |
 | RNET RigNet, Inc. |
| Sector: Technology | |
| SubSector: Wireless Communications | |
| MarketCap: 38.4827 Millions | |
| Recent Price: 1.65 Smart Investing & Trading Score: 30 | |
| Day Percent Change: 1.85185% Day Change: -9999 | |
| Week Change: 25% Year-to-date Change: 0.0% | |
| RNET Links: Profile News Message Board | |
| Charts:- Daily , Weekly | |
| Add RNET to Watchlist: View: Get Complete RNET Trend Analysis ➞ | |
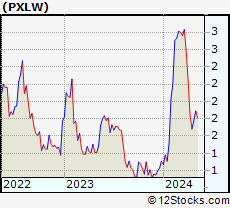 | PXLW Pixelworks Inc |
| Sector: Technology | |
| SubSector: Semiconductors | |
| MarketCap: 46.2 Millions | |
| Recent Price: 11.98 Smart Investing & Trading Score: 100 | |
| Day Percent Change: 9.30657% Day Change: -0.29 | |
| Week Change: 20.5231% Year-to-date Change: 33.1% | |
| PXLW Links: Profile News Message Board | |
| Charts:- Daily , Weekly | |
| Add PXLW to Watchlist: View: Get Complete PXLW Trend Analysis ➞ | |
 | MOSY MoSys, Inc. |
| Sector: Technology | |
| SubSector: Semiconductor - Integrated Circuits | |
| MarketCap: 2.4751 Millions | |
| Recent Price: 202.80 Smart Investing & Trading Score: 80 | |
| Day Percent Change: 9.50324% Day Change: -9999 | |
| Week Change: 20.1422% Year-to-date Change: 0.0% | |
| MOSY Links: Profile News Message Board | |
| Charts:- Daily , Weekly | |
| Add MOSY to Watchlist: View: Get Complete MOSY Trend Analysis ➞ | |
 | NLST Netlist, Inc. |
| Sector: Technology | |
| SubSector: Semiconductor- Memory Chips | |
| MarketCap: 58.59 Millions | |
| Recent Price: 0.84 Smart Investing & Trading Score: 90 | |
| Day Percent Change: -2.32558% Day Change: -9999 | |
| Week Change: 20% Year-to-date Change: -2.3% | |
| NLST Links: Profile News Message Board | |
| Charts:- Daily , Weekly | |
| Add NLST to Watchlist: View: Get Complete NLST Trend Analysis ➞ | |
| For tabular summary view of above stock list: Summary View ➞ 0 - 25 , 25 - 50 , 50 - 75 , 75 - 100 , 100 - 125 , 125 - 150 , 150 - 175 , 175 - 200 | ||
| Click To Change The Sort Order: By Market Cap or Company Size Performance: Year-to-date, Week and Day | |
| Select Chart Type: | ||
|
Best Stocks Today 12Stocks.com |
© 2025 12Stocks.com Terms & Conditions Privacy Contact Us
All Information Provided Only For Education And Not To Be Used For Investing or Trading. See Terms & Conditions


One More Thing ... Get Best Stocks Delivered Daily!
Never Ever Miss A Move With Our Top Ten Stocks Lists
Find Best Stocks In Any Market - Bull or Bear Market
Take A Peek At Our Top Ten Stocks Lists: Daily, Weekly, Year-to-Date & Top Trends
Find Best Stocks In Any Market - Bull or Bear Market
Take A Peek At Our Top Ten Stocks Lists: Daily, Weekly, Year-to-Date & Top Trends
Technology Stocks With Best Up Trends [0-bearish to 100-bullish]: Sony [100], Bakkt [100], Rigetti Computing[100], Fair Isaac[100], Arqit Quantum[100], D-Wave Quantum[100], Navitas Semiconductor[100], Shoals [100], Vuzix [100], Arteris [100], Lantronix [100]
Best Technology Stocks Year-to-Date:
Xunlei [370.476%], Sify [315.033%], Wolfspeed [307.01%], Digital Turbine[265.057%], EchoStar Corp[247.253%], CuriosityStream [241.605%], Viasat [224.029%], Pagaya [222.638%], Oneconnect Financial[209.053%], D-Wave Quantum[203.954%], CommScope Holding[203.101%] Best Technology Stocks This Week:
GTT [443626%], Barracuda Networks[71050%], Mobile TeleSystems[10483.5%], Nam Tai[5033.33%], Ebix [4200.85%], Fang [4150%], NantHealth [3114.02%], Hemisphere Media[2981.82%], Yandex N.V[2935.27%], Wolfspeed [1961.98%], Castlight Health[1751.96%] Best Technology Stocks Daily:
Sony [194.565%], Bakkt [28.6091%], Rigetti Computing[18.4925%], Fair Isaac[17.979%], Arqit Quantum[17.9369%], Marti [17%], Latch [16.6667%], Oclaro [14.734%], D-Wave Quantum[13.968%], Arbe Robotics[13.0178%], Navitas Semiconductor[12.3288%]