
 Login Sign Up


| |||||
 |  | ||||

| 12Stocks.com Market Intelligence |
Best Tech Stocks
| In a hurry? Tech Stocks Lists: Performance & Trends, Stock Charts, FANG Stocks
Sort Tech stocks: Daily, Weekly, Year-to-Date, Market Cap & Trends. Filter Tech stocks list by size:All Tech Large Mid-Range Small and MicroCap |
| 12Stocks.com Tech Stocks Performances & Trends Daily | |||||||||
|
|  The overall Smart Investing & Trading Score is 100 (0-bearish to 100-bullish) which puts Technology sector in short term bullish trend. The Smart Investing & Trading Score from previous trading session is 90 and an improvement of trend continues.
| ||||||||
Here are the Smart Investing & Trading Scores of the most requested Technology stocks at 12Stocks.com (click stock name for detailed review):
|


| 12Stocks.com: Investing in Technology sector with Stocks | |
|
The following table helps investors and traders sort through current performance and trends (as measured by Smart Investing & Trading Score) of various
stocks in the Tech sector. Quick View: Move mouse or cursor over stock symbol (ticker) to view short-term technical chart and over stock name to view long term chart. Click on  to add stock symbol to your watchlist and to add stock symbol to your watchlist and  to view watchlist. Click on any ticker or stock name for detailed market intelligence report for that stock. to view watchlist. Click on any ticker or stock name for detailed market intelligence report for that stock. |
12Stocks.com Performance of Stocks in Tech Sector
| Ticker | Stock Name | Watchlist | Category | Recent Price | Smart Investing & Trading Score | Change % | Weekly Change% |
| BL | BlackLine |   | Software - | 51.30 | 0 | 0.43% | -4.66% |
| TYL | Tyler | | Software - | 498.19 | 0 | -0.51% | -4.72% |
| FEYE | FireEye | | Software | 16.25 | 10 | 0.99% | -4.75% |
| EXTR | Extreme Networks | | Communication | 20.43 | 50 | -2.16% | -4.76% |
| RELL | Richardson Electronics | | Electronic Components | 9.52 | 20 | -0.94% | -4.80% |
| DBX | Dropbox | | Software - Infrastructure | 29.86 | 30 | 1.13% | -4.80% |
| VERI | Veritone | | Software - Infrastructure | 5.29 | 90 | 9.52% | -4.86% |
| ASAN | Asana | | Software - | 13.47 | 20 | 1.51% | -4.87% |
| DHX | DHI | | Software - | 2.67 | 10 | 1.14% | -4.98% |
| CRTO | Criteo S.A | | Advertising Agencies | 21.31 | 0 | -3.92% | -5.04% |
| AFRM | Affirm | | Software - Infrastructure | 77.42 | 60 | 4.02% | -5.05% |
| DAKT | Daktronics | | Electronic Components | 20.11 | 30 | -2.28% | -5.10% |
| INFY | Infosys | | IT | 16.15 | 0 | -1.34% | -5.17% |
| KC | Kingsoft Cloud | | Software - | 15.62 | 60 | 3.48% | -5.19% |
| TCX | Tucows | | Software - Infrastructure | 18.05 | 10 | -1.53% | -5.20% |
| MANH | Manhattan Associates | | Software - | 201.30 | 10 | 0.87% | -5.25% |
| Z | Zillow | | Internet Content & Information | 74.85 | 10 | 1.86% | -5.25% |
| ZG | Zillow | | Internet Content & Information | 72.46 | 10 | 1.80% | -5.27% |
| ATNI | ATN | | Telecom | 15.01 | 10 | 0.54% | -5.30% |
| EGHT | 8X8 | | Software - | 2.10 | 30 | -0.94% | -5.41% |
| IBEX | IBEX | | IT | 39.52 | 30 | -2.96% | -5.49% |
| APPN | Appian Corp | | Software - Infrastructure | 30.67 | 60 | 0.13% | -5.51% |
| NWSA | News Corp | | Entertainment | 28.55 | 10 | -1.38% | -5.56% |
| TV | Grupo Televisa | | Telecom | 2.54 | 0 | -1.93% | -5.58% |
| LOGM | LogMeIn | | Software | 23.03 | 40 | 1.28% | -5.65% |
| For chart view version of above stock list: Chart View ➞ 0 - 25 , 25 - 50 , 50 - 75 , 75 - 100 , 100 - 125 , 125 - 150 , 150 - 175 , 175 - 200 , 200 - 225 , 225 - 250 , 250 - 275 , 275 - 300 , 300 - 325 , 325 - 350 , 350 - 375 , 375 - 400 , 400 - 425 , 425 - 450 , 450 - 475 , 475 - 500 , 500 - 525 , 525 - 550 , 550 - 575 , 575 - 600 , 600 - 625 , 625 - 650 , 650 - 675 , 675 - 700 , 700 - 725 , 725 - 750 , 750 - 775 , 775 - 800 , 800 - 825 , 825 - 850 , 850 - 875 , 875 - 900 | ||
 | Click To Change The Sort Order: By Market Cap or Company Size Performance: Year-to-date, Week and Day |  |
|
Get the most comprehensive stock market coverage daily at 12Stocks.com ➞ Best Stocks Today ➞ Best Stocks Weekly ➞ Best Stocks Year-to-Date ➞ Best Stocks Trends ➞  Best Stocks Today 12Stocks.com Best Nasdaq Stocks ➞ Best S&P 500 Stocks ➞ Best Tech Stocks ➞ Best Biotech Stocks ➞ |
| Detailed Overview of Tech Stocks |
| Tech Technical Overview, Leaders & Laggards, Top Tech ETF Funds & Detailed Tech Stocks List, Charts, Trends & More |
| Tech Sector: Technical Analysis, Trends & YTD Performance | |
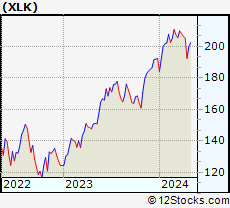
| Technology sector is composed of stocks
from semiconductors, software, web, social media
and services subsectors. Technology sector, as represented by XLK, an exchange-traded fund [ETF] that holds basket of tech stocks (e.g, Intel, Google) is up by 23.7823% and is currently outperforming the overall market by 9.0244% year-to-date. Below is a quick view of technical charts and trends: |
|
 XLK Weekly Chart |
|
| Long Term Trend: Very Good | |
| Medium Term Trend: Good | |
 XLK Daily Chart |
|
| Short Term Trend: Very Good | |
| Overall Trend Score: 100 | |
| YTD Performance: 23.7823% | |
| **Trend Scores & Views Are Only For Educational Purposes And Not For Investing | |
| 12Stocks.com: Top Performing Technology Sector Stocks | ||||||||||||||||||||||||||||||||||||||||||||||||
 The top performing Technology sector stocks year to date are
Now, more recently, over last week, the top performing Technology sector stocks on the move are


|
||||||||||||||||||||||||||||||||||||||||||||||||
| 12Stocks.com: Investing in Tech Sector using Exchange Traded Funds | |
|
The following table shows list of key exchange traded funds (ETF) that
help investors track Tech Index. For detailed view, check out our ETF Funds section of our website. Quick View: Move mouse or cursor over ETF symbol (ticker) to view short-term technical chart and over ETF name to view long term chart. Click on ticker or stock name for detailed view. Click on to add stock symbol to your watchlist and to view watchlist. |
12Stocks.com List of ETFs that track Tech Index
| Ticker | ETF Name | Watchlist | Recent Price | Smart Investing & Trading Score | Change % | Week % | Year-to-date % |
| IGN | Tech-Multimd Ntwk | | 53.86 | 40 | 0.918119 | -20.6435 | 0% |
| 12Stocks.com: Charts, Trends, Fundamental Data and Performances of Tech Stocks | |
|
We now take in-depth look at all Tech stocks including charts, multi-period performances and overall trends (as measured by Smart Investing & Trading Score). One can sort Tech stocks (click link to choose) by Daily, Weekly and by Year-to-Date performances. Also, one can sort by size of the company or by market capitalization. |
| Select Your Default Chart Type: | |||||
| |||||
| Click on stock symbol or name for detailed view. Click on to add stock symbol to your watchlist and to view watchlist. Quick View: Move mouse or cursor over "Daily" to quickly view daily technical stock chart and over "Weekly" to view weekly technical stock chart. | |||||


 | BL BlackLine Inc |
| Sector: Technology | |
| SubSector: Software - Application | |
| MarketCap: 3317.81 Millions | |
| Recent Price: 51.30 Smart Investing & Trading Score: 0 | |
| Day Percent Change: 0.430697% Day Change: 0.09 | |
| Week Change: -4.66456% Year-to-date Change: -15.0% | |
| BL Links: Profile News Message Board | |
| Charts:- Daily , Weekly | |
| Add BL to Watchlist: View: Get Complete BL Trend Analysis ➞ | |
 | TYL Tyler Technologies, Inc |
| Sector: Technology | |
| SubSector: Software - Application | |
| MarketCap: 24224.9 Millions | |
| Recent Price: 498.19 Smart Investing & Trading Score: 0 | |
| Day Percent Change: -0.509246% Day Change: -1.86 | |
| Week Change: -4.72375% Year-to-date Change: -13.3% | |
| TYL Links: Profile News Message Board | |
| Charts:- Daily , Weekly | |
| Add TYL to Watchlist: View: Get Complete TYL Trend Analysis ➞ | |
 | FEYE FireEye, Inc. |
| Sector: Technology | |
| SubSector: Application Software | |
| MarketCap: 2577.52 Millions | |
| Recent Price: 16.25 Smart Investing & Trading Score: 10 | |
| Day Percent Change: 0.994406% Day Change: -9999 | |
| Week Change: -4.74795% Year-to-date Change: 0.0% | |
| FEYE Links: Profile News Message Board | |
| Charts:- Daily , Weekly | |
| Add FEYE to Watchlist: View: Get Complete FEYE Trend Analysis ➞ | |
 | EXTR Extreme Networks Inc |
| Sector: Technology | |
| SubSector: Communication Equipment | |
| MarketCap: 2868.95 Millions | |
| Recent Price: 20.43 Smart Investing & Trading Score: 50 | |
| Day Percent Change: -2.15517% Day Change: 0.07 | |
| Week Change: -4.75524% Year-to-date Change: 23.0% | |
| EXTR Links: Profile News Message Board | |
| Charts:- Daily , Weekly | |
| Add EXTR to Watchlist: View: Get Complete EXTR Trend Analysis ➞ | |
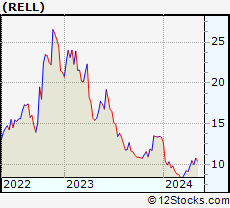 | RELL Richardson Electronics, Ltd |
| Sector: Technology | |
| SubSector: Electronic Components | |
| MarketCap: 139.59 Millions | |
| Recent Price: 9.52 Smart Investing & Trading Score: 20 | |
| Day Percent Change: -0.936524% Day Change: -0.13 | |
| Week Change: -4.8% Year-to-date Change: -31.5% | |
| RELL Links: Profile News Message Board | |
| Charts:- Daily , Weekly | |
| Add RELL to Watchlist: View: Get Complete RELL Trend Analysis ➞ | |
 | DBX Dropbox Inc |
| Sector: Technology | |
| SubSector: Software - Infrastructure | |
| MarketCap: 7811.82 Millions | |
| Recent Price: 29.86 Smart Investing & Trading Score: 30 | |
| Day Percent Change: 1.13482% Day Change: 0.31 | |
| Week Change: -4.79911% Year-to-date Change: 1.0% | |
| DBX Links: Profile News Message Board | |
| Charts:- Daily , Weekly | |
| Add DBX to Watchlist: View: Get Complete DBX Trend Analysis ➞ | |
 | VERI Veritone Inc |
| Sector: Technology | |
| SubSector: Software - Infrastructure | |
| MarketCap: 147.02 Millions | |
| Recent Price: 5.29 Smart Investing & Trading Score: 90 | |
| Day Percent Change: 9.52381% Day Change: -0.01 | |
| Week Change: -4.85612% Year-to-date Change: 65.3% | |
| VERI Links: Profile News Message Board | |
| Charts:- Daily , Weekly | |
| Add VERI to Watchlist: View: Get Complete VERI Trend Analysis ➞ | |
 | ASAN Asana Inc |
| Sector: Technology | |
| SubSector: Software - Application | |
| MarketCap: 3179.88 Millions | |
| Recent Price: 13.47 Smart Investing & Trading Score: 20 | |
| Day Percent Change: 1.50716% Day Change: 0.09 | |
| Week Change: -4.87288% Year-to-date Change: -32.1% | |
| ASAN Links: Profile News Message Board | |
| Charts:- Daily , Weekly | |
| Add ASAN to Watchlist: View: Get Complete ASAN Trend Analysis ➞ | |
 | DHX DHI Group Inc |
| Sector: Technology | |
| SubSector: Software - Application | |
| MarketCap: 142.59 Millions | |
| Recent Price: 2.67 Smart Investing & Trading Score: 10 | |
| Day Percent Change: 1.13636% Day Change: -0.16 | |
| Week Change: -4.98221% Year-to-date Change: 52.6% | |
| DHX Links: Profile News Message Board | |
| Charts:- Daily , Weekly | |
| Add DHX to Watchlist: View: Get Complete DHX Trend Analysis ➞ | |
 | CRTO Criteo S.A ADR |
| Sector: Technology | |
| SubSector: Advertising Agencies | |
| MarketCap: 1349.64 Millions | |
| Recent Price: 21.31 Smart Investing & Trading Score: 0 | |
| Day Percent Change: -3.92245% Day Change: -0.2 | |
| Week Change: -5.03565% Year-to-date Change: -45.8% | |
| CRTO Links: Profile News Message Board | |
| Charts:- Daily , Weekly | |
| Add CRTO to Watchlist: View: Get Complete CRTO Trend Analysis ➞ | |
 | AFRM Affirm Holdings Inc |
| Sector: Technology | |
| SubSector: Software - Infrastructure | |
| MarketCap: 28449.2 Millions | |
| Recent Price: 77.42 Smart Investing & Trading Score: 60 | |
| Day Percent Change: 4.02446% Day Change: 1.95 | |
| Week Change: -5.04722% Year-to-date Change: 23.8% | |
| AFRM Links: Profile News Message Board | |
| Charts:- Daily , Weekly | |
| Add AFRM to Watchlist: View: Get Complete AFRM Trend Analysis ➞ | |
 | DAKT Daktronics Inc |
| Sector: Technology | |
| SubSector: Electronic Components | |
| MarketCap: 853.72 Millions | |
| Recent Price: 20.11 Smart Investing & Trading Score: 30 | |
| Day Percent Change: -2.28377% Day Change: 0.35 | |
| Week Change: -5.09674% Year-to-date Change: 20.3% | |
| DAKT Links: Profile News Message Board | |
| Charts:- Daily , Weekly | |
| Add DAKT to Watchlist: View: Get Complete DAKT Trend Analysis ➞ | |
 | INFY Infosys Ltd ADR |
| Sector: Technology | |
| SubSector: Information Technology Services | |
| MarketCap: 68048.6 Millions | |
| Recent Price: 16.15 Smart Investing & Trading Score: 0 | |
| Day Percent Change: -1.34392% Day Change: -0.23 | |
| Week Change: -5.16735% Year-to-date Change: -27.6% | |
| INFY Links: Profile News Message Board | |
| Charts:- Daily , Weekly | |
| Add INFY to Watchlist: View: Get Complete INFY Trend Analysis ➞ | |
 | KC Kingsoft Cloud Holdings Ltd ADR |
| Sector: Technology | |
| SubSector: Software - Application | |
| MarketCap: 3755.58 Millions | |
| Recent Price: 15.62 Smart Investing & Trading Score: 60 | |
| Day Percent Change: 3.47913% Day Change: -0.23 | |
| Week Change: -5.19126% Year-to-date Change: 45.7% | |
| KC Links: Profile News Message Board | |
| Charts:- Daily , Weekly | |
| Add KC to Watchlist: View: Get Complete KC Trend Analysis ➞ | |
 | TCX Tucows, Inc |
| Sector: Technology | |
| SubSector: Software - Infrastructure | |
| MarketCap: 197.53 Millions | |
| Recent Price: 18.05 Smart Investing & Trading Score: 10 | |
| Day Percent Change: -1.52755% Day Change: -0.47 | |
| Week Change: -5.19958% Year-to-date Change: 7.6% | |
| TCX Links: Profile News Message Board | |
| Charts:- Daily , Weekly | |
| Add TCX to Watchlist: View: Get Complete TCX Trend Analysis ➞ | |
 | MANH Manhattan Associates, Inc |
| Sector: Technology | |
| SubSector: Software - Application | |
| MarketCap: 13019.5 Millions | |
| Recent Price: 201.30 Smart Investing & Trading Score: 10 | |
| Day Percent Change: 0.866864% Day Change: 1.44 | |
| Week Change: -5.24829% Year-to-date Change: -25.1% | |
| MANH Links: Profile News Message Board | |
| Charts:- Daily , Weekly | |
| Add MANH to Watchlist: View: Get Complete MANH Trend Analysis ➞ | |
 | Z Zillow Group Inc |
| Sector: Technology | |
| SubSector: Internet Content & Information | |
| MarketCap: 21137.5 Millions | |
| Recent Price: 74.85 Smart Investing & Trading Score: 10 | |
| Day Percent Change: 1.86445% Day Change: 0.83 | |
| Week Change: -5.25316% Year-to-date Change: 2.3% | |
| Z Links: Profile News Message Board | |
| Charts:- Daily , Weekly | |
| Add Z to Watchlist: View: Get Complete Z Trend Analysis ➞ | |
 | ZG Zillow Group Inc |
| Sector: Technology | |
| SubSector: Internet Content & Information | |
| MarketCap: 21137.5 Millions | |
| Recent Price: 72.46 Smart Investing & Trading Score: 10 | |
| Day Percent Change: 1.79826% Day Change: 0.76 | |
| Week Change: -5.26866% Year-to-date Change: 3.4% | |
| ZG Links: Profile News Message Board | |
| Charts:- Daily , Weekly | |
| Add ZG to Watchlist: View: Get Complete ZG Trend Analysis ➞ | |
 | ATNI ATN International Inc |
| Sector: Technology | |
| SubSector: Telecom Services | |
| MarketCap: 245.19 Millions | |
| Recent Price: 15.01 Smart Investing & Trading Score: 10 | |
| Day Percent Change: 0.535834% Day Change: 0.13 | |
| Week Change: -5.29968% Year-to-date Change: -6.7% | |
| ATNI Links: Profile News Message Board | |
| Charts:- Daily , Weekly | |
| Add ATNI to Watchlist: View: Get Complete ATNI Trend Analysis ➞ | |
 | EGHT 8X8 Inc |
| Sector: Technology | |
| SubSector: Software - Application | |
| MarketCap: 282.28 Millions | |
| Recent Price: 2.10 Smart Investing & Trading Score: 30 | |
| Day Percent Change: -0.943396% Day Change: 0 | |
| Week Change: -5.40541% Year-to-date Change: -21.1% | |
| EGHT Links: Profile News Message Board | |
| Charts:- Daily , Weekly | |
| Add EGHT to Watchlist: View: Get Complete EGHT Trend Analysis ➞ | |
 | IBEX IBEX Ltd |
| Sector: Technology | |
| SubSector: Information Technology Services | |
| MarketCap: 392.61 Millions | |
| Recent Price: 39.52 Smart Investing & Trading Score: 30 | |
| Day Percent Change: -2.95851% Day Change: 0.2 | |
| Week Change: -5.4878% Year-to-date Change: 82.1% | |
| IBEX Links: Profile News Message Board | |
| Charts:- Daily , Weekly | |
| Add IBEX to Watchlist: View: Get Complete IBEX Trend Analysis ➞ | |
 | APPN Appian Corp |
| Sector: Technology | |
| SubSector: Software - Infrastructure | |
| MarketCap: 2263.16 Millions | |
| Recent Price: 30.67 Smart Investing & Trading Score: 60 | |
| Day Percent Change: 0.130591% Day Change: 0.04 | |
| Week Change: -5.51448% Year-to-date Change: -7.6% | |
| APPN Links: Profile News Message Board | |
| Charts:- Daily , Weekly | |
| Add APPN to Watchlist: View: Get Complete APPN Trend Analysis ➞ | |
 | NWSA News Corp |
| Sector: Technology | |
| SubSector: Entertainment | |
| MarketCap: 17379.3 Millions | |
| Recent Price: 28.55 Smart Investing & Trading Score: 10 | |
| Day Percent Change: -1.38169% Day Change: -0.18 | |
| Week Change: -5.55739% Year-to-date Change: 4.4% | |
| NWSA Links: Profile News Message Board | |
| Charts:- Daily , Weekly | |
| Add NWSA to Watchlist: View: Get Complete NWSA Trend Analysis ➞ | |
 | TV Grupo Televisa SAB ADR |
| Sector: Technology | |
| SubSector: Telecom Services | |
| MarketCap: 1281.93 Millions | |
| Recent Price: 2.54 Smart Investing & Trading Score: 0 | |
| Day Percent Change: -1.9305% Day Change: -0.01 | |
| Week Change: -5.57621% Year-to-date Change: 52.1% | |
| TV Links: Profile News Message Board | |
| Charts:- Daily , Weekly | |
| Add TV to Watchlist: View: Get Complete TV Trend Analysis ➞ | |
 | LOGM LogMeIn, Inc. |
| Sector: Technology | |
| SubSector: Application Software | |
| MarketCap: 4021.72 Millions | |
| Recent Price: 23.03 Smart Investing & Trading Score: 40 | |
| Day Percent Change: 1.27529% Day Change: -9999 | |
| Week Change: -5.65342% Year-to-date Change: 0.0% | |
| LOGM Links: Profile News Message Board | |
| Charts:- Daily , Weekly | |
| Add LOGM to Watchlist: View: Get Complete LOGM Trend Analysis ➞ | |
| For tabular summary view of above stock list: Summary View ➞ 0 - 25 , 25 - 50 , 50 - 75 , 75 - 100 , 100 - 125 , 125 - 150 , 150 - 175 , 175 - 200 , 200 - 225 , 225 - 250 , 250 - 275 , 275 - 300 , 300 - 325 , 325 - 350 , 350 - 375 , 375 - 400 , 400 - 425 , 425 - 450 , 450 - 475 , 475 - 500 , 500 - 525 , 525 - 550 , 550 - 575 , 575 - 600 , 600 - 625 , 625 - 650 , 650 - 675 , 675 - 700 , 700 - 725 , 725 - 750 , 750 - 775 , 775 - 800 , 800 - 825 , 825 - 850 , 850 - 875 , 875 - 900 | ||
| Click To Change The Sort Order: By Market Cap or Company Size Performance: Year-to-date, Week and Day | |
| Select Chart Type: | ||
|
Best Stocks Today 12Stocks.com |
© 2025 12Stocks.com Terms & Conditions Privacy Contact Us
All Information Provided Only For Education And Not To Be Used For Investing or Trading. See Terms & Conditions


One More Thing ... Get Best Stocks Delivered Daily!
Never Ever Miss A Move With Our Top Ten Stocks Lists
Find Best Stocks In Any Market - Bull or Bear Market
Take A Peek At Our Top Ten Stocks Lists: Daily, Weekly, Year-to-Date & Top Trends
Find Best Stocks In Any Market - Bull or Bear Market
Take A Peek At Our Top Ten Stocks Lists: Daily, Weekly, Year-to-Date & Top Trends
Technology Stocks With Best Up Trends [0-bearish to 100-bullish]: Sony [100], Bakkt [100], Rigetti Computing[100], Fair Isaac[100], Arqit Quantum[100], D-Wave Quantum[100], Navitas Semiconductor[100], Shoals [100], Vuzix [100], Arteris [100], Lantronix [100]
Best Technology Stocks Year-to-Date:
Xunlei [370.476%], Sify [315.033%], Wolfspeed [307.01%], Digital Turbine[265.057%], EchoStar Corp[247.253%], CuriosityStream [241.605%], Viasat [224.029%], Pagaya [222.638%], Oneconnect Financial[209.053%], D-Wave Quantum[203.954%], CommScope Holding[203.101%] Best Technology Stocks This Week:
GTT [443626%], Barracuda Networks[71050%], Mobile TeleSystems[10483.5%], Nam Tai[5033.33%], Ebix [4200.85%], Fang [4150%], NantHealth [3114.02%], Hemisphere Media[2981.82%], Yandex N.V[2935.27%], Wolfspeed [1961.98%], Castlight Health[1751.96%] Best Technology Stocks Daily:
Sony [194.565%], Bakkt [28.6091%], Rigetti Computing[18.4925%], Fair Isaac[17.979%], Arqit Quantum[17.9369%], Marti [17%], Latch [16.6667%], Oclaro [14.734%], D-Wave Quantum[13.968%], Arbe Robotics[13.0178%], Navitas Semiconductor[12.3288%]