
 Login Sign Up


| |||||
 |  | ||||

| 12Stocks.com Market Intelligence |
Best Tech Stocks
| In a hurry? Tech Stocks Lists: Performance & Trends, Stock Charts, FANG Stocks
Sort Tech stocks: Daily, Weekly, Year-to-Date, Market Cap & Trends. Filter Tech stocks list by size:All Tech Large Mid-Range Small and MicroCap |
| 12Stocks.com Tech Stocks Performances & Trends Daily | |||||||||
|
|  The overall Smart Investing & Trading Score is 100 (0-bearish to 100-bullish) which puts Technology sector in short term bullish trend. The Smart Investing & Trading Score from previous trading session is 90 and an improvement of trend continues.
| ||||||||
Here are the Smart Investing & Trading Scores of the most requested Technology stocks at 12Stocks.com (click stock name for detailed review):
|


| 12Stocks.com: Investing in Technology sector with Stocks | |
|
The following table helps investors and traders sort through current performance and trends (as measured by Smart Investing & Trading Score) of various
stocks in the Tech sector. Quick View: Move mouse or cursor over stock symbol (ticker) to view short-term technical chart and over stock name to view long term chart. Click on  to add stock symbol to your watchlist and to add stock symbol to your watchlist and  to view watchlist. Click on any ticker or stock name for detailed market intelligence report for that stock. to view watchlist. Click on any ticker or stock name for detailed market intelligence report for that stock. |
12Stocks.com Performance of Stocks in Tech Sector
| Ticker | Stock Name | Watchlist | Category | Recent Price | Smart Investing & Trading Score | Change % | Weekly Change% |
| TENB | Tenable |   | Software - Infrastructure | 29.50 | 20 | 2.18% | -1.40% |
| RELY | Remitly Global | | Software - Infrastructure | 16.06 | 20 | -0.74% | -1.41% |
| ADTN | ADTRAN | | Communication | 9.29 | 50 | -2.57% | -1.43% |
| WBD | Warner Bros. | | Entertainment | 19.23 | 20 | -0.62% | -1.44% |
| CURI | CuriosityStream | | Broadcasting | 5.13 | 50 | -0.10% | -1.44% |
| WEX | WEX | | Software - Infrastructure | 158.93 | 20 | -0.43% | -1.54% |
| GTN | Gray Media | | Broadcasting | 5.70 | 60 | 1.42% | -1.55% |
| COHU | Cohu | | Semiconductor | 20.19 | 60 | -1.12% | -1.56% |
| MSI | Motorola | | Communication | 448.03 | 10 | -1.95% | -1.56% |
| RUM | Rumble | | Internet Content & Information | 7.41 | 60 | 3.64% | -1.59% |
| GIB | CGI | | IT | 90.26 | 50 | 0.31% | -1.60% |
| AVT | Avnet | | Electronics & Computer Distribution | 51.98 | 40 | -0.44% | -1.63% |
| ROP | Roper | | Software - | 497.40 | 40 | -0.11% | -1.64% |
| SCSC | Scansource | | Electronics & Computer Distribution | 43.81 | 50 | -0.02% | -1.64% |
| TASK | TaskUs | | IT | 17.43 | 30 | -1.69% | -1.64% |
| IMXI | Money | | Software - Infrastructure | 14.02 | 40 | 0.65% | -1.68% |
| CARS | Cars.com | | Internet Content & Information | 12.17 | 30 | -1.30% | -1.70% |
| AVNW | Aviat Networks | | Communication | 22.42 | 30 | -1.06% | -1.71% |
| NSIT | Insight Enterprises | | Electronics & Computer Distribution | 112.14 | 40 | -0.24% | -1.77% |
| PSFE | Paysafe | | Software - Infrastructure | 13.00 | 40 | 1.88% | -1.81% |
| CSGS | CSG Systems | | Software - Infrastructure | 64.39 | 50 | -1.39% | -1.83% |
| QRVO | Qorvo | | Semiconductors | 91.54 | 70 | 1.18% | -1.85% |
| INTU | Intuit | | Software - | 681.86 | 20 | 0.35% | -1.86% |
| PUBM | PubMatic | | Software - | 8.28 | 40 | 0.24% | -1.90% |
| HAR | Harman | | Electronic | 47.18 | 20 | -0.72% | -1.91% |
| For chart view version of above stock list: Chart View ➞ 0 - 25 , 25 - 50 , 50 - 75 , 75 - 100 , 100 - 125 , 125 - 150 , 150 - 175 , 175 - 200 , 200 - 225 , 225 - 250 , 250 - 275 , 275 - 300 , 300 - 325 , 325 - 350 , 350 - 375 , 375 - 400 , 400 - 425 , 425 - 450 , 450 - 475 , 475 - 500 , 500 - 525 , 525 - 550 , 550 - 575 , 575 - 600 , 600 - 625 , 625 - 650 , 650 - 675 , 675 - 700 , 700 - 725 , 725 - 750 , 750 - 775 , 775 - 800 , 800 - 825 , 825 - 850 , 850 - 875 , 875 - 900 | ||
 | Click To Change The Sort Order: By Market Cap or Company Size Performance: Year-to-date, Week and Day |  |
|
Get the most comprehensive stock market coverage daily at 12Stocks.com ➞ Best Stocks Today ➞ Best Stocks Weekly ➞ Best Stocks Year-to-Date ➞ Best Stocks Trends ➞  Best Stocks Today 12Stocks.com Best Nasdaq Stocks ➞ Best S&P 500 Stocks ➞ Best Tech Stocks ➞ Best Biotech Stocks ➞ |
| Detailed Overview of Tech Stocks |
| Tech Technical Overview, Leaders & Laggards, Top Tech ETF Funds & Detailed Tech Stocks List, Charts, Trends & More |
| Tech Sector: Technical Analysis, Trends & YTD Performance | |
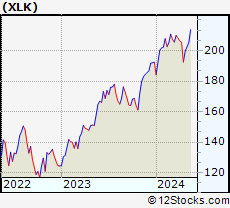
| Technology sector is composed of stocks
from semiconductors, software, web, social media
and services subsectors. Technology sector, as represented by XLK, an exchange-traded fund [ETF] that holds basket of tech stocks (e.g, Intel, Google) is up by 23.7823% and is currently outperforming the overall market by 9.0244% year-to-date. Below is a quick view of technical charts and trends: |
|
 XLK Weekly Chart |
|
| Long Term Trend: Very Good | |
| Medium Term Trend: Good | |
 XLK Daily Chart |
|
| Short Term Trend: Very Good | |
| Overall Trend Score: 100 | |
| YTD Performance: 23.7823% | |
| **Trend Scores & Views Are Only For Educational Purposes And Not For Investing | |
| 12Stocks.com: Top Performing Technology Sector Stocks | ||||||||||||||||||||||||||||||||||||||||||||||||
 The top performing Technology sector stocks year to date are
Now, more recently, over last week, the top performing Technology sector stocks on the move are


|
||||||||||||||||||||||||||||||||||||||||||||||||
| 12Stocks.com: Investing in Tech Sector using Exchange Traded Funds | |
|
The following table shows list of key exchange traded funds (ETF) that
help investors track Tech Index. For detailed view, check out our ETF Funds section of our website. Quick View: Move mouse or cursor over ETF symbol (ticker) to view short-term technical chart and over ETF name to view long term chart. Click on ticker or stock name for detailed view. Click on to add stock symbol to your watchlist and to view watchlist. |
12Stocks.com List of ETFs that track Tech Index
| Ticker | ETF Name | Watchlist | Recent Price | Smart Investing & Trading Score | Change % | Week % | Year-to-date % |
| IGN | Tech-Multimd Ntwk | | 53.86 | 40 | 0.918119 | -20.6435 | 0% |
| 12Stocks.com: Charts, Trends, Fundamental Data and Performances of Tech Stocks | |
|
We now take in-depth look at all Tech stocks including charts, multi-period performances and overall trends (as measured by Smart Investing & Trading Score). One can sort Tech stocks (click link to choose) by Daily, Weekly and by Year-to-Date performances. Also, one can sort by size of the company or by market capitalization. |
| Select Your Default Chart Type: | |||||
| |||||
| Click on stock symbol or name for detailed view. Click on to add stock symbol to your watchlist and to view watchlist. Quick View: Move mouse or cursor over "Daily" to quickly view daily technical stock chart and over "Weekly" to view weekly technical stock chart. | |||||


 | TENB Tenable Holdings Inc |
| Sector: Technology | |
| SubSector: Software - Infrastructure | |
| MarketCap: 3760 Millions | |
| Recent Price: 29.50 Smart Investing & Trading Score: 20 | |
| Day Percent Change: 2.1822% Day Change: -0.31 | |
| Week Change: -1.40374% Year-to-date Change: -24.3% | |
| TENB Links: Profile News Message Board | |
| Charts:- Daily , Weekly | |
| Add TENB to Watchlist: View: Get Complete TENB Trend Analysis ➞ | |
 | RELY Remitly Global Inc |
| Sector: Technology | |
| SubSector: Software - Infrastructure | |
| MarketCap: 4018.71 Millions | |
| Recent Price: 16.06 Smart Investing & Trading Score: 20 | |
| Day Percent Change: -0.741656% Day Change: -0.21 | |
| Week Change: -1.41191% Year-to-date Change: -28.3% | |
| RELY Links: Profile News Message Board | |
| Charts:- Daily , Weekly | |
| Add RELY to Watchlist: View: Get Complete RELY Trend Analysis ➞ | |
 | ADTN ADTRAN Holdings Inc |
| Sector: Technology | |
| SubSector: Communication Equipment | |
| MarketCap: 780.51 Millions | |
| Recent Price: 9.29 Smart Investing & Trading Score: 50 | |
| Day Percent Change: -2.56813% Day Change: 0.29 | |
| Week Change: -1.4316% Year-to-date Change: 6.8% | |
| ADTN Links: Profile News Message Board | |
| Charts:- Daily , Weekly | |
| Add ADTN to Watchlist: View: Get Complete ADTN Trend Analysis ➞ | |
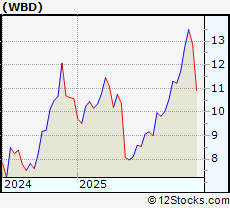 | WBD Warner Bros. Discovery Inc |
| Sector: Technology | |
| SubSector: Entertainment | |
| MarketCap: 29981.6 Millions | |
| Recent Price: 19.23 Smart Investing & Trading Score: 20 | |
| Day Percent Change: -0.62% Day Change: -0.12 | |
| Week Change: -1.44% Year-to-date Change: 84.2% | |
| WBD Links: Profile News Message Board | |
| Charts:- Daily , Weekly | |
| Add WBD to Watchlist: View: Get Complete WBD Trend Analysis ➞ | |
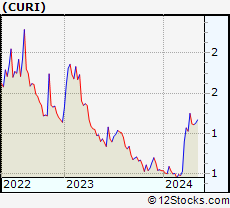 | CURI CuriosityStream Inc |
| Sector: Technology | |
| SubSector: Broadcasting | |
| MarketCap: 264.74 Millions | |
| Recent Price: 5.13 Smart Investing & Trading Score: 50 | |
| Day Percent Change: -0.0972763% Day Change: -0.12 | |
| Week Change: -1.43954% Year-to-date Change: 241.6% | |
| CURI Links: Profile News Message Board | |
| Charts:- Daily , Weekly | |
| Add CURI to Watchlist: View: Get Complete CURI Trend Analysis ➞ | |
 | WEX WEX Inc |
| Sector: Technology | |
| SubSector: Software - Infrastructure | |
| MarketCap: 5865.71 Millions | |
| Recent Price: 158.93 Smart Investing & Trading Score: 20 | |
| Day Percent Change: -0.432277% Day Change: -0.63 | |
| Week Change: -1.54256% Year-to-date Change: -9.2% | |
| WEX Links: Profile News Message Board | |
| Charts:- Daily , Weekly | |
| Add WEX to Watchlist: View: Get Complete WEX Trend Analysis ➞ | |
 | GTN Gray Media Inc |
| Sector: Technology | |
| SubSector: Broadcasting | |
| MarketCap: 664.55 Millions | |
| Recent Price: 5.70 Smart Investing & Trading Score: 60 | |
| Day Percent Change: 1.42349% Day Change: 0.11 | |
| Week Change: -1.5544% Year-to-date Change: 77.1% | |
| GTN Links: Profile News Message Board | |
| Charts:- Daily , Weekly | |
| Add GTN to Watchlist: View: Get Complete GTN Trend Analysis ➞ | |
 | COHU Cohu, Inc |
| Sector: Technology | |
| SubSector: Semiconductor Equipment & Materials | |
| MarketCap: 949.5 Millions | |
| Recent Price: 20.19 Smart Investing & Trading Score: 60 | |
| Day Percent Change: -1.12145% Day Change: -0.09 | |
| Week Change: -1.55534% Year-to-date Change: -23.7% | |
| COHU Links: Profile News Message Board | |
| Charts:- Daily , Weekly | |
| Add COHU to Watchlist: View: Get Complete COHU Trend Analysis ➞ | |
 | MSI Motorola Solutions Inc |
| Sector: Technology | |
| SubSector: Communication Equipment | |
| MarketCap: 79799.9 Millions | |
| Recent Price: 448.03 Smart Investing & Trading Score: 10 | |
| Day Percent Change: -1.94778% Day Change: -5.8 | |
| Week Change: -1.55999% Year-to-date Change: -1.9% | |
| MSI Links: Profile News Message Board | |
| Charts:- Daily , Weekly | |
| Add MSI to Watchlist: View: Get Complete MSI Trend Analysis ➞ | |
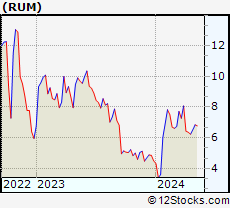 | RUM Rumble Inc |
| Sector: Technology | |
| SubSector: Internet Content & Information | |
| MarketCap: 3090.5 Millions | |
| Recent Price: 7.41 Smart Investing & Trading Score: 60 | |
| Day Percent Change: 3.63636% Day Change: -0.03 | |
| Week Change: -1.59363% Year-to-date Change: -40.2% | |
| RUM Links: Profile News Message Board | |
| Charts:- Daily , Weekly | |
| Add RUM to Watchlist: View: Get Complete RUM Trend Analysis ➞ | |
 | GIB CGI Inc |
| Sector: Technology | |
| SubSector: Information Technology Services | |
| MarketCap: 21345.4 Millions | |
| Recent Price: 90.26 Smart Investing & Trading Score: 50 | |
| Day Percent Change: 0.31118% Day Change: -0.34 | |
| Week Change: -1.60253% Year-to-date Change: -17.2% | |
| GIB Links: Profile News Message Board | |
| Charts:- Daily , Weekly | |
| Add GIB to Watchlist: View: Get Complete GIB Trend Analysis ➞ | |
 | AVT Avnet Inc |
| Sector: Technology | |
| SubSector: Electronics & Computer Distribution | |
| MarketCap: 4487.79 Millions | |
| Recent Price: 51.98 Smart Investing & Trading Score: 40 | |
| Day Percent Change: -0.440529% Day Change: 0.09 | |
| Week Change: -1.62755% Year-to-date Change: 1.9% | |
| AVT Links: Profile News Message Board | |
| Charts:- Daily , Weekly | |
| Add AVT to Watchlist: View: Get Complete AVT Trend Analysis ➞ | |
 | ROP Roper Technologies Inc |
| Sector: Technology | |
| SubSector: Software - Application | |
| MarketCap: 55791.3 Millions | |
| Recent Price: 497.40 Smart Investing & Trading Score: 40 | |
| Day Percent Change: -0.114465% Day Change: -0.73 | |
| Week Change: -1.6374% Year-to-date Change: -2.8% | |
| ROP Links: Profile News Message Board | |
| Charts:- Daily , Weekly | |
| Add ROP to Watchlist: View: Get Complete ROP Trend Analysis ➞ | |
 | SCSC Scansource, Inc |
| Sector: Technology | |
| SubSector: Electronics & Computer Distribution | |
| MarketCap: 983.05 Millions | |
| Recent Price: 43.81 Smart Investing & Trading Score: 50 | |
| Day Percent Change: -0.0228206% Day Change: -2.62 | |
| Week Change: -1.63898% Year-to-date Change: -6.8% | |
| SCSC Links: Profile News Message Board | |
| Charts:- Daily , Weekly | |
| Add SCSC to Watchlist: View: Get Complete SCSC Trend Analysis ➞ | |
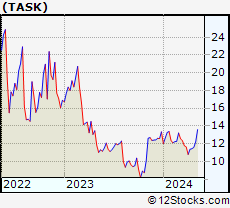 | TASK TaskUs Inc |
| Sector: Technology | |
| SubSector: Information Technology Services | |
| MarketCap: 1633.95 Millions | |
| Recent Price: 17.43 Smart Investing & Trading Score: 30 | |
| Day Percent Change: -1.69205% Day Change: 0.03 | |
| Week Change: -1.63657% Year-to-date Change: 3.2% | |
| TASK Links: Profile News Message Board | |
| Charts:- Daily , Weekly | |
| Add TASK to Watchlist: View: Get Complete TASK Trend Analysis ➞ | |
 | IMXI International Money Express Inc |
| Sector: Technology | |
| SubSector: Software - Infrastructure | |
| MarketCap: 429.83 Millions | |
| Recent Price: 14.02 Smart Investing & Trading Score: 40 | |
| Day Percent Change: 0.646088% Day Change: -0.02 | |
| Week Change: -1.68303% Year-to-date Change: -32.0% | |
| IMXI Links: Profile News Message Board | |
| Charts:- Daily , Weekly | |
| Add IMXI to Watchlist: View: Get Complete IMXI Trend Analysis ➞ | |
 | CARS Cars.com |
| Sector: Technology | |
| SubSector: Internet Content & Information | |
| MarketCap: 835.04 Millions | |
| Recent Price: 12.17 Smart Investing & Trading Score: 30 | |
| Day Percent Change: -1.29765% Day Change: 0.41 | |
| Week Change: -1.69628% Year-to-date Change: -27.7% | |
| CARS Links: Profile News Message Board | |
| Charts:- Daily , Weekly | |
| Add CARS to Watchlist: View: Get Complete CARS Trend Analysis ➞ | |
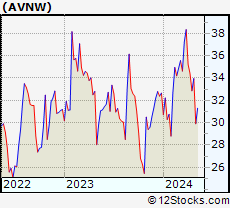 | AVNW Aviat Networks Inc |
| Sector: Technology | |
| SubSector: Communication Equipment | |
| MarketCap: 284.63 Millions | |
| Recent Price: 22.42 Smart Investing & Trading Score: 30 | |
| Day Percent Change: -1.05914% Day Change: 0.41 | |
| Week Change: -1.70978% Year-to-date Change: 24.0% | |
| AVNW Links: Profile News Message Board | |
| Charts:- Daily , Weekly | |
| Add AVNW to Watchlist: View: Get Complete AVNW Trend Analysis ➞ | |
 | NSIT Insight Enterprises Inc |
| Sector: Technology | |
| SubSector: Electronics & Computer Distribution | |
| MarketCap: 4018.5 Millions | |
| Recent Price: 112.14 Smart Investing & Trading Score: 40 | |
| Day Percent Change: -0.240192% Day Change: -1.1 | |
| Week Change: -1.76945% Year-to-date Change: -24.9% | |
| NSIT Links: Profile News Message Board | |
| Charts:- Daily , Weekly | |
| Add NSIT to Watchlist: View: Get Complete NSIT Trend Analysis ➞ | |
 | PSFE Paysafe Limited |
| Sector: Technology | |
| SubSector: Software - Infrastructure | |
| MarketCap: 871.01 Millions | |
| Recent Price: 13.00 Smart Investing & Trading Score: 40 | |
| Day Percent Change: 1.88088% Day Change: -0.2 | |
| Week Change: -1.81269% Year-to-date Change: -24.9% | |
| PSFE Links: Profile News Message Board | |
| Charts:- Daily , Weekly | |
| Add PSFE to Watchlist: View: Get Complete PSFE Trend Analysis ➞ | |
 | CSGS CSG Systems International Inc |
| Sector: Technology | |
| SubSector: Software - Infrastructure | |
| MarketCap: 1864.48 Millions | |
| Recent Price: 64.39 Smart Investing & Trading Score: 50 | |
| Day Percent Change: -1.39357% Day Change: -0.03 | |
| Week Change: -1.82955% Year-to-date Change: 28.7% | |
| CSGS Links: Profile News Message Board | |
| Charts:- Daily , Weekly | |
| Add CSGS to Watchlist: View: Get Complete CSGS Trend Analysis ➞ | |
 | QRVO Qorvo Inc |
| Sector: Technology | |
| SubSector: Semiconductors | |
| MarketCap: 8606.65 Millions | |
| Recent Price: 91.54 Smart Investing & Trading Score: 70 | |
| Day Percent Change: 1.18271% Day Change: 1.26 | |
| Week Change: -1.85483% Year-to-date Change: 31.2% | |
| QRVO Links: Profile News Message Board | |
| Charts:- Daily , Weekly | |
| Add QRVO to Watchlist: View: Get Complete QRVO Trend Analysis ➞ | |
 | INTU Intuit Inc |
| Sector: Technology | |
| SubSector: Software - Application | |
| MarketCap: 187586 Millions | |
| Recent Price: 681.86 Smart Investing & Trading Score: 20 | |
| Day Percent Change: 0.347314% Day Change: -3.88 | |
| Week Change: -1.86099% Year-to-date Change: 10.0% | |
| INTU Links: Profile News Message Board | |
| Charts:- Daily , Weekly | |
| Add INTU to Watchlist: View: Get Complete INTU Trend Analysis ➞ | |
 | PUBM PubMatic Inc |
| Sector: Technology | |
| SubSector: Software - Application | |
| MarketCap: 382.73 Millions | |
| Recent Price: 8.28 Smart Investing & Trading Score: 40 | |
| Day Percent Change: 0.242131% Day Change: 0.68 | |
| Week Change: -1.89573% Year-to-date Change: -44.2% | |
| PUBM Links: Profile News Message Board | |
| Charts:- Daily , Weekly | |
| Add PUBM to Watchlist: View: Get Complete PUBM Trend Analysis ➞ | |
 | HAR Harman International Industries, Incorporated |
| Sector: Technology | |
| SubSector: Electronic Equipment | |
| MarketCap: 7792.74 Millions | |
| Recent Price: 47.18 Smart Investing & Trading Score: 20 | |
| Day Percent Change: -0.715488% Day Change: -9999 | |
| Week Change: -1.91268% Year-to-date Change: 0.0% | |
| HAR Links: Profile News Message Board | |
| Charts:- Daily , Weekly | |
| Add HAR to Watchlist: View: Get Complete HAR Trend Analysis ➞ | |
| For tabular summary view of above stock list: Summary View ➞ 0 - 25 , 25 - 50 , 50 - 75 , 75 - 100 , 100 - 125 , 125 - 150 , 150 - 175 , 175 - 200 , 200 - 225 , 225 - 250 , 250 - 275 , 275 - 300 , 300 - 325 , 325 - 350 , 350 - 375 , 375 - 400 , 400 - 425 , 425 - 450 , 450 - 475 , 475 - 500 , 500 - 525 , 525 - 550 , 550 - 575 , 575 - 600 , 600 - 625 , 625 - 650 , 650 - 675 , 675 - 700 , 700 - 725 , 725 - 750 , 750 - 775 , 775 - 800 , 800 - 825 , 825 - 850 , 850 - 875 , 875 - 900 | ||
| Click To Change The Sort Order: By Market Cap or Company Size Performance: Year-to-date, Week and Day | |
| Select Chart Type: | ||
|
Best Stocks Today 12Stocks.com |
© 2025 12Stocks.com Terms & Conditions Privacy Contact Us
All Information Provided Only For Education And Not To Be Used For Investing or Trading. See Terms & Conditions


One More Thing ... Get Best Stocks Delivered Daily!
Never Ever Miss A Move With Our Top Ten Stocks Lists
Find Best Stocks In Any Market - Bull or Bear Market
Take A Peek At Our Top Ten Stocks Lists: Daily, Weekly, Year-to-Date & Top Trends
Find Best Stocks In Any Market - Bull or Bear Market
Take A Peek At Our Top Ten Stocks Lists: Daily, Weekly, Year-to-Date & Top Trends
Technology Stocks With Best Up Trends [0-bearish to 100-bullish]: Sony [100], Bakkt [100], Rigetti Computing[100], Fair Isaac[100], Arqit Quantum[100], D-Wave Quantum[100], Navitas Semiconductor[100], Shoals [100], Vuzix [100], Arteris [100], Lantronix [100]
Best Technology Stocks Year-to-Date:
Xunlei [370.476%], Sify [315.033%], Wolfspeed [307.01%], Digital Turbine[265.057%], EchoStar Corp[247.253%], CuriosityStream [241.605%], Viasat [224.029%], Pagaya [222.638%], Oneconnect Financial[209.053%], D-Wave Quantum[203.954%], CommScope Holding[203.101%] Best Technology Stocks This Week:
GTT [443626%], Barracuda Networks[71050%], Mobile TeleSystems[10483.5%], Nam Tai[5033.33%], Ebix [4200.85%], Fang [4150%], NantHealth [3114.02%], Hemisphere Media[2981.82%], Yandex N.V[2935.27%], Wolfspeed [1961.98%], Castlight Health[1751.96%] Best Technology Stocks Daily:
Sony [194.565%], Bakkt [28.6091%], Rigetti Computing[18.4925%], Fair Isaac[17.979%], Arqit Quantum[17.9369%], Marti [17%], Latch [16.6667%], Oclaro [14.734%], D-Wave Quantum[13.968%], Arbe Robotics[13.0178%], Navitas Semiconductor[12.3288%]