
 Login Sign Up


| |||||
 |  | ||||

| 12Stocks.com Market Intelligence |
Best SmallCap Stocks
|
| In a hurry? Small Cap Stock Lists: Performance Trends Table, Stock Charts
Sort Small Cap stocks: Daily, Weekly, Year-to-Date, Market Cap & Trends. Filter Small Cap stocks list by sector: Show all, Tech, Finance, Energy, Staples, Retail, Industrial, Materials, Utilities and HealthCare Filter Small Cap stocks list by size: All Large Medium Small and MicroCap |
| 12Stocks.com Small Cap Stocks Performances & Trends Daily | |||||||||
|
|  The overall Smart Investing & Trading Score is 69 (0-bearish to 100-bullish) which puts Small Cap index in short term neutral to bullish trend. The Smart Investing & Trading Score from previous trading session is 49 and hence an improvement of trend.
| ||||||||
Here are the Smart Investing & Trading Scores of the most requested small cap stocks at 12Stocks.com (click stock name for detailed review):
|


| 12Stocks.com: Investing in Smallcap Index with Stocks | |
|
The following table helps investors and traders sort through current performance and trends (as measured by Smart Investing & Trading Score) of various
stocks in the Smallcap Index. Quick View: Move mouse or cursor over stock symbol (ticker) to view short-term technical chart and over stock name to view long term chart. Click on  to add stock symbol to your watchlist and to add stock symbol to your watchlist and  to view watchlist. Click on any ticker or stock name for detailed market intelligence report for that stock. to view watchlist. Click on any ticker or stock name for detailed market intelligence report for that stock. |
12Stocks.com Performance of Stocks in Smallcap Index
| Ticker | Stock Name | Watchlist | Category | Recent Price | Smart Investing & Trading Score | Change % | YTD Change% |
| WEYS | Weyco Group |   | Consumer Staples | 29.28 | 32 | -1.38% | -6.63% |
| USCB | USCB Financial | | Financials | 11.91 | 100 | 0.00% | -3.01% |
| AKTS | Akoustis | | Technology | 0.60 | 37 | 0.00% | -28.06% |
| DOUG | Douglas Elliman | | Financials | 1.39 | 54 | -0.36% | -52.73% |
| CEIX | CONSOL Energy | | Materials | 83.89 | 50 | 2.06% | -16.55% |
| BCBP | BCB Bancorp | | Financials | 9.82 | 67 | 1.34% | -23.58% |
| MTDR | Matador Resources | | Energy | 63.28 | 55 | 1.88% | 11.29% |
| STRO | Sutro Biopharma | | Health Care | 3.83 | 39 | -2.79% | -10.72% |
| GPRE | Green Plains | | Materials | 20.17 | 10 | -2.75% | -20.02% |
| ATLO | Ames National | | Financials | 20.27 | 100 | 2.01% | -5.01% |
| STHO | Star | | Financials | 12.39 | 87 | 0.36% | -17.37% |
| TGAN | Transphorm | | Technology | 4.87 | 68 | 0.10% | 32.74% |
| THRD | Third Harmonic | | Health Care | 11.68 | 93 | 0.78% | 6.04% |
| CIX | CompX | | Services & Goods | 32.66 | 48 | 8.15% | 29.19% |
| SFST | Southern First | | Financials | 26.45 | 50 | 1.93% | -28.71% |
| NDLS | Noodles & | | Services & Goods | 1.58 | 54 | 1.28% | -49.84% |
| MPB | Mid Penn | | Financials | 21.32 | 93 | 1.57% | -12.19% |
| GCO | Genesco | | Services & Goods | 24.43 | 0 | -2.71% | -30.62% |
| SSBK | Southern States | | Financials | 25.52 | 100 | 1.69% | -13.30% |
| IPSC | Century | | Health Care | 3.09 | 44 | 4.22% | -6.36% |
| MLP | Maui Land | | Financials | 20.12 | 73 | 0.00% | 26.62% |
| NGVC | Natural Grocers | | Services & Goods | 17.38 | 95 | 3.33% | 8.63% |
| OSG | Overseas Shipholding | | Transports | 6.32 | 90 | -0.94% | 19.92% |
| CPS | Cooper-Standard | | Consumer Staples | 16.15 | 75 | 0.81% | -17.35% |
| BIRD | Allbirds | | Services & Goods | 0.63 | 57 | 2.62% | -49.10% |


| Too many stocks? View smallcap stocks filtered by marketcap & sector |
| Marketcap: All SmallCap Stocks (default-no microcap), Large, Mid-Range, Small |
| Smallcap Sector: Tech, Finance, Energy, Staples, Retail, Industrial, Materials, & Medical |
|
Get the most comprehensive stock market coverage daily at 12Stocks.com ➞ Best Stocks Today ➞ Best Stocks Weekly ➞ Best Stocks Year-to-Date ➞ Best Stocks Trends ➞  Best Stocks Today 12Stocks.com Best Nasdaq Stocks ➞ Best S&P 500 Stocks ➞ Best Tech Stocks ➞ Best Biotech Stocks ➞ |
| Detailed Overview of SmallCap Stocks |
| SmallCap Technical Overview, Leaders & Laggards, Top SmallCap ETF Funds & Detailed SmallCap Stocks List, Charts, Trends & More |
| Smallcap: Technical Analysis, Trends & YTD Performance | |
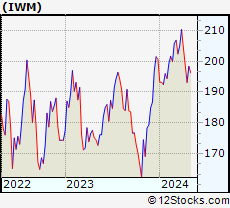
| SmallCap segment as represented by
IWM, an exchange-traded fund [ETF], holds basket of thousands of smallcap stocks from across all major sectors of the US stock market. The smallcap index (contains stocks like Riverbed & Sotheby's) is up by 0.59% and is currently underperforming the overall market by -6.29% year-to-date. Below is a quick view of technical charts and trends: | |
 IWM Weekly Chart |
|
| Long Term Trend: Not Good | |
| Medium Term Trend: Very Good | |
 IWM Daily Chart |
|
| Short Term Trend: Very Good | |
| Overall Trend Score: 69 | |
| YTD Performance: 0.59% | |
| **Trend Scores & Views Are Only For Educational Purposes And Not For Investing | |
| 12Stocks.com: Top Performing Small Cap Index Stocks | ||||||||||||||||||||||||||||||||||||||||||||||||
 The top performing Small Cap Index stocks year to date are
Now, more recently, over last week, the top performing Small Cap Index stocks on the move are


|
||||||||||||||||||||||||||||||||||||||||||||||||
| 12Stocks.com: Investing in Smallcap Index using Exchange Traded Funds | |
|
The following table shows list of key exchange traded funds (ETF) that
help investors track Smallcap index. The following list also includes leveraged ETF funds that track twice or thrice the daily returns of Smallcap indices. Short or inverse ETF funds move in the opposite direction to the index they track and are useful during market pullbacks or during bear markets. Quick View: Move mouse or cursor over ETF symbol (ticker) to view short-term technical chart and over ETF name to view long term chart. Click on ticker or stock name for detailed view. Click on to add stock symbol to your watchlist and to view watchlist. |
12Stocks.com List of ETFs that track Smallcap Index
| Ticker | ETF Name | Watchlist | Recent Price | Smart Investing & Trading Score | Change % | Week % | Year-to-date % |
| IWM | iShares Russell 2000 | | 201.90 | 69 | 0.99 | 1.77 | 0.59% |
| IJR | iShares Core S&P Small-Cap | | 107.13 | 82 | 0.75 | 1.4 | -1.03% |
| VTWO | Vanguard Russell 2000 ETF | | 81.61 | 69 | 0.94 | 1.73 | 0.63% |
| IWN | iShares Russell 2000 Value | | 154.21 | 100 | 0.87 | 2.03 | -0.72% |
| IJS | iShares S&P Small-Cap 600 Value | | 98.72 | 64 | 0.71 | 1.57 | -4.22% |
| IWO | iShares Russell 2000 Growth | | 256.87 | 57 | 0.99 | 1.49 | 1.84% |
| IJT | iShares S&P Small-Cap 600 Growth | | 127.76 | 95 | 0.82 | 1.32 | 2.09% |
| XSLV | PowerShares S&P SmallCap Low Volatil ETF | | 43.22 | 87 | 0.19 | 1.17 | -2.11% |
| SBB | ProShares Short SmallCap600 | | 16.16 | 13 | -1.28 | -1.37 | 1.44% |
| SDD | ProShares UltraShort SmallCap600 | | 18.84 | 23 | -2.41 | -2.61 | 2.27% |
| SAA | ProShares Ultra SmallCap600 | | 23.59 | 69 | 2.86 | 2.39 | -5.45% |
| SMLV | SPDR SSGA US Small Cap Low Volatil ETF | | 109.69 | 87 | 0.78 | 2.01 | -2.52% |
| 12Stocks.com: Charts, Trends, Fundamental Data and Performances of SmallCap Stocks | |
|
We now take in-depth look at all SmallCap stocks including charts, multi-period performances and overall trends (as measured by Smart Investing & Trading Score). One can sort SmallCap stocks (click link to choose) by Daily, Weekly and by Year-to-Date performances. Also, one can sort by size of the company or by market capitalization. |
| Select Your Default Chart Type: | |||||
| |||||
| Click on stock symbol or name for detailed view. Click on to add stock symbol to your watchlist and to view watchlist. Quick View: Move mouse or cursor over "Daily" to quickly view daily technical stock chart and over "Weekly" to view weekly technical stock chart. | |||||

 | WEYS Weyco Group, Inc. |
| Sector: Consumer Staples | |
| SubSector: Textile - Apparel Footwear & Accessories | |
| MarketCap: 198.87 Millions | |
| Recent Price: 29.28 Smart Investing & Trading Score: 32 | |
| Day Percent Change: -1.38% Day Change: -0.41 | |
| Week Change: 0.21% Year-to-date Change: -6.6% | |
| WEYS Links: Profile News Message Board | |
| Charts:- Daily , Weekly | |
| Add WEYS to Watchlist: View: Get Complete WEYS Trend Analysis ➞ | |
 | USCB USCB Financial Holdings, Inc. |
| Sector: Financials | |
| SubSector: Banks - Regional | |
| MarketCap: 198 Millions | |
| Recent Price: 11.91 Smart Investing & Trading Score: 100 | |
| Day Percent Change: 0.00% Day Change: 0.00 | |
| Week Change: 11% Year-to-date Change: -3.0% | |
| USCB Links: Profile News Message Board | |
| Charts:- Daily , Weekly | |
| Add USCB to Watchlist: View: Get Complete USCB Trend Analysis ➞ | |
 | AKTS Akoustis Technologies, Inc. |
| Sector: Technology | |
| SubSector: Communication Equipment | |
| MarketCap: 197.039 Millions | |
| Recent Price: 0.60 Smart Investing & Trading Score: 37 | |
| Day Percent Change: 0.00% Day Change: 0.00 | |
| Week Change: 9.85% Year-to-date Change: -28.1% | |
| AKTS Links: Profile News Message Board | |
| Charts:- Daily , Weekly | |
| Add AKTS to Watchlist: View: Get Complete AKTS Trend Analysis ➞ | |
 | DOUG Douglas Elliman Inc. |
| Sector: Financials | |
| SubSector: Financials Services | |
| MarketCap: 197 Millions | |
| Recent Price: 1.39 Smart Investing & Trading Score: 54 | |
| Day Percent Change: -0.36% Day Change: 0.00 | |
| Week Change: 16.39% Year-to-date Change: -52.7% | |
| DOUG Links: Profile News Message Board | |
| Charts:- Daily , Weekly | |
| Add DOUG to Watchlist: View: Get Complete DOUG Trend Analysis ➞ | |
 | CEIX CONSOL Energy Inc. |
| Sector: Materials | |
| SubSector: Industrial Metals & Minerals | |
| MarketCap: 196.81 Millions | |
| Recent Price: 83.89 Smart Investing & Trading Score: 50 | |
| Day Percent Change: 2.06% Day Change: 1.69 | |
| Week Change: -2.15% Year-to-date Change: -16.6% | |
| CEIX Links: Profile News Message Board | |
| Charts:- Daily , Weekly | |
| Add CEIX to Watchlist: View: Get Complete CEIX Trend Analysis ➞ | |
 | BCBP BCB Bancorp, Inc. |
| Sector: Financials | |
| SubSector: Regional - Northeast Banks | |
| MarketCap: 196.799 Millions | |
| Recent Price: 9.82 Smart Investing & Trading Score: 67 | |
| Day Percent Change: 1.34% Day Change: 0.13 | |
| Week Change: 3.81% Year-to-date Change: -23.6% | |
| BCBP Links: Profile News Message Board | |
| Charts:- Daily , Weekly | |
| Add BCBP to Watchlist: View: Get Complete BCBP Trend Analysis ➞ | |
 | MTDR Matador Resources Company |
| Sector: Energy | |
| SubSector: Independent Oil & Gas | |
| MarketCap: 196.593 Millions | |
| Recent Price: 63.28 Smart Investing & Trading Score: 55 | |
| Day Percent Change: 1.88% Day Change: 1.17 | |
| Week Change: -3.55% Year-to-date Change: 11.3% | |
| MTDR Links: Profile News Message Board | |
| Charts:- Daily , Weekly | |
| Add MTDR to Watchlist: View: Get Complete MTDR Trend Analysis ➞ | |
 | STRO Sutro Biopharma, Inc. |
| Sector: Health Care | |
| SubSector: Biotechnology | |
| MarketCap: 196.485 Millions | |
| Recent Price: 3.83 Smart Investing & Trading Score: 39 | |
| Day Percent Change: -2.79% Day Change: -0.11 | |
| Week Change: 11.99% Year-to-date Change: -10.7% | |
| STRO Links: Profile News Message Board | |
| Charts:- Daily , Weekly | |
| Add STRO to Watchlist: View: Get Complete STRO Trend Analysis ➞ | |
 | GPRE Green Plains Inc. |
| Sector: Materials | |
| SubSector: Specialty Chemicals | |
| MarketCap: 196.357 Millions | |
| Recent Price: 20.17 Smart Investing & Trading Score: 10 | |
| Day Percent Change: -2.75% Day Change: -0.57 | |
| Week Change: -5.75% Year-to-date Change: -20.0% | |
| GPRE Links: Profile News Message Board | |
| Charts:- Daily , Weekly | |
| Add GPRE to Watchlist: View: Get Complete GPRE Trend Analysis ➞ | |
 | ATLO Ames National Corporation |
| Sector: Financials | |
| SubSector: Regional - Northeast Banks | |
| MarketCap: 195.999 Millions | |
| Recent Price: 20.27 Smart Investing & Trading Score: 100 | |
| Day Percent Change: 2.01% Day Change: 0.40 | |
| Week Change: 2.68% Year-to-date Change: -5.0% | |
| ATLO Links: Profile News Message Board | |
| Charts:- Daily , Weekly | |
| Add ATLO to Watchlist: View: Get Complete ATLO Trend Analysis ➞ | |
 | STHO Star Holdings |
| Sector: Financials | |
| SubSector: Financials Services | |
| MarketCap: 195 Millions | |
| Recent Price: 12.39 Smart Investing & Trading Score: 87 | |
| Day Percent Change: 0.36% Day Change: 0.04 | |
| Week Change: 5.72% Year-to-date Change: -17.4% | |
| STHO Links: Profile News Message Board | |
| Charts:- Daily , Weekly | |
| Add STHO to Watchlist: View: Get Complete STHO Trend Analysis ➞ | |
 | TGAN Transphorm, Inc. |
| Sector: Technology | |
| SubSector: Semiconductor Equipment & Materials | |
| MarketCap: 194 Millions | |
| Recent Price: 4.87 Smart Investing & Trading Score: 68 | |
| Day Percent Change: 0.10% Day Change: 0.00 | |
| Week Change: 0.1% Year-to-date Change: 32.7% | |
| TGAN Links: Profile News Message Board | |
| Charts:- Daily , Weekly | |
| Add TGAN to Watchlist: View: Get Complete TGAN Trend Analysis ➞ | |
 | THRD Third Harmonic Bio, Inc. |
| Sector: Health Care | |
| SubSector: Biotechnology | |
| MarketCap: 190 Millions | |
| Recent Price: 11.68 Smart Investing & Trading Score: 93 | |
| Day Percent Change: 0.78% Day Change: 0.09 | |
| Week Change: 7.85% Year-to-date Change: 6.0% | |
| THRD Links: Profile News Message Board | |
| Charts:- Daily , Weekly | |
| Add THRD to Watchlist: View: Get Complete THRD Trend Analysis ➞ | |
 | CIX CompX International Inc. |
| Sector: Services & Goods | |
| SubSector: Security & Protection Services | |
| MarketCap: 189.603 Millions | |
| Recent Price: 32.66 Smart Investing & Trading Score: 48 | |
| Day Percent Change: 8.15% Day Change: 2.46 | |
| Week Change: -4.7% Year-to-date Change: 29.2% | |
| CIX Links: Profile News Message Board | |
| Charts:- Daily , Weekly | |
| Add CIX to Watchlist: View: Get Complete CIX Trend Analysis ➞ | |
 | SFST Southern First Bancshares, Inc. |
| Sector: Financials | |
| SubSector: Money Center Banks | |
| MarketCap: 189.099 Millions | |
| Recent Price: 26.45 Smart Investing & Trading Score: 50 | |
| Day Percent Change: 1.93% Day Change: 0.50 | |
| Week Change: -2.69% Year-to-date Change: -28.7% | |
| SFST Links: Profile News Message Board | |
| Charts:- Daily , Weekly | |
| Add SFST to Watchlist: View: Get Complete SFST Trend Analysis ➞ | |
 | NDLS Noodles & Company |
| Sector: Services & Goods | |
| SubSector: Restaurants | |
| MarketCap: 188.77 Millions | |
| Recent Price: 1.58 Smart Investing & Trading Score: 54 | |
| Day Percent Change: 1.28% Day Change: 0.02 | |
| Week Change: 12.86% Year-to-date Change: -49.8% | |
| NDLS Links: Profile News Message Board | |
| Charts:- Daily , Weekly | |
| Add NDLS to Watchlist: View: Get Complete NDLS Trend Analysis ➞ | |
 | MPB Mid Penn Bancorp, Inc. |
| Sector: Financials | |
| SubSector: Regional - Northeast Banks | |
| MarketCap: 187.699 Millions | |
| Recent Price: 21.32 Smart Investing & Trading Score: 93 | |
| Day Percent Change: 1.57% Day Change: 0.33 | |
| Week Change: 2.21% Year-to-date Change: -12.2% | |
| MPB Links: Profile News Message Board | |
| Charts:- Daily , Weekly | |
| Add MPB to Watchlist: View: Get Complete MPB Trend Analysis ➞ | |
 | GCO Genesco Inc. |
| Sector: Services & Goods | |
| SubSector: Apparel Stores | |
| MarketCap: 187.508 Millions | |
| Recent Price: 24.43 Smart Investing & Trading Score: 0 | |
| Day Percent Change: -2.71% Day Change: -0.68 | |
| Week Change: -6.76% Year-to-date Change: -30.6% | |
| GCO Links: Profile News Message Board | |
| Charts:- Daily , Weekly | |
| Add GCO to Watchlist: View: Get Complete GCO Trend Analysis ➞ | |
 | SSBK Southern States Bancshares, Inc. |
| Sector: Financials | |
| SubSector: Banks - Regional | |
| MarketCap: 187 Millions | |
| Recent Price: 25.52 Smart Investing & Trading Score: 100 | |
| Day Percent Change: 1.69% Day Change: 0.42 | |
| Week Change: 4.87% Year-to-date Change: -13.3% | |
| SSBK Links: Profile News Message Board | |
| Charts:- Daily , Weekly | |
| Add SSBK to Watchlist: View: Get Complete SSBK Trend Analysis ➞ | |
 | IPSC Century Therapeutics, Inc. |
| Sector: Health Care | |
| SubSector: Biotechnology | |
| MarketCap: 187 Millions | |
| Recent Price: 3.09 Smart Investing & Trading Score: 44 | |
| Day Percent Change: 4.22% Day Change: 0.13 | |
| Week Change: 7.29% Year-to-date Change: -6.4% | |
| IPSC Links: Profile News Message Board | |
| Charts:- Daily , Weekly | |
| Add IPSC to Watchlist: View: Get Complete IPSC Trend Analysis ➞ | |
 | MLP Maui Land & Pineapple Company, Inc. |
| Sector: Financials | |
| SubSector: Real Estate Development | |
| MarketCap: 186.619 Millions | |
| Recent Price: 20.12 Smart Investing & Trading Score: 73 | |
| Day Percent Change: 0.00% Day Change: 0.00 | |
| Week Change: 1.56% Year-to-date Change: 26.6% | |
| MLP Links: Profile News Message Board | |
| Charts:- Daily , Weekly | |
| Add MLP to Watchlist: View: Get Complete MLP Trend Analysis ➞ | |
 | NGVC Natural Grocers by Vitamin Cottage, Inc. |
| Sector: Services & Goods | |
| SubSector: Grocery Stores | |
| MarketCap: 185.475 Millions | |
| Recent Price: 17.38 Smart Investing & Trading Score: 95 | |
| Day Percent Change: 3.33% Day Change: 0.56 | |
| Week Change: 2.96% Year-to-date Change: 8.6% | |
| NGVC Links: Profile News Message Board | |
| Charts:- Daily , Weekly | |
| Add NGVC to Watchlist: View: Get Complete NGVC Trend Analysis ➞ | |
 | OSG Overseas Shipholding Group, Inc. |
| Sector: Transports | |
| SubSector: Shipping | |
| MarketCap: 184.814 Millions | |
| Recent Price: 6.32 Smart Investing & Trading Score: 90 | |
| Day Percent Change: -0.94% Day Change: -0.06 | |
| Week Change: 4.81% Year-to-date Change: 19.9% | |
| OSG Links: Profile News Message Board | |
| Charts:- Daily , Weekly | |
| Add OSG to Watchlist: View: Get Complete OSG Trend Analysis ➞ | |
 | CPS Cooper-Standard Holdings Inc. |
| Sector: Consumer Staples | |
| SubSector: Auto Parts | |
| MarketCap: 184.339 Millions | |
| Recent Price: 16.15 Smart Investing & Trading Score: 75 | |
| Day Percent Change: 0.81% Day Change: 0.13 | |
| Week Change: 0.94% Year-to-date Change: -17.4% | |
| CPS Links: Profile News Message Board | |
| Charts:- Daily , Weekly | |
| Add CPS to Watchlist: View: Get Complete CPS Trend Analysis ➞ | |
 | BIRD Allbirds, Inc. |
| Sector: Services & Goods | |
| SubSector: Apparel Retail | |
| MarketCap: 184 Millions | |
| Recent Price: 0.63 Smart Investing & Trading Score: 57 | |
| Day Percent Change: 2.62% Day Change: 0.02 | |
| Week Change: 2.2% Year-to-date Change: -49.1% | |
| BIRD Links: Profile News Message Board | |
| Charts:- Daily , Weekly | |
| Add BIRD to Watchlist: View: Get Complete BIRD Trend Analysis ➞ | |
| Too many stocks? View smallcap stocks filtered by marketcap & sector |
| Marketcap: All SmallCap Stocks (default-no microcap), Large, Mid-Range, Small & MicroCap |
| Sector: Tech, Finance, Energy, Staples, Retail, Industrial, Materials, Utilities & Medical |
|
Best Stocks Today 12Stocks.com |
© 2024 12Stocks.com Terms & Conditions Privacy Contact Us
All Information Provided Only For Education And Not To Be Used For Investing or Trading. See Terms & Conditions


One More Thing ... Get Best Stocks Delivered Daily!
Never Ever Miss A Move With Our Top Ten Stocks Lists
Find Best Stocks In Any Market - Bull or Bear Market
Take A Peek At Our Top Ten Stocks Lists: Daily, Weekly, Year-to-Date & Top Trends
Find Best Stocks In Any Market - Bull or Bear Market
Take A Peek At Our Top Ten Stocks Lists: Daily, Weekly, Year-to-Date & Top Trends
Smallcap Stocks With Best Up Trends [0-bearish to 100-bullish]: Twist Bioscience[100], WideOpenWest [100], Joint [100], FTC Solar[100], Origin Materials[100], Alignment Healthcare[100], Clarus [100], IES [100], Emergent BioSolutions[100], Enovix [100], El Pollo[100]
Best Smallcap Stocks Year-to-Date:
Janux [482.74%], Viking [313.59%], Longboard [272.5%], Alpine Immune[239.29%], Bakkt [199.55%], Avidity Biosciences[192.48%], Vera [189.47%], Cullinan Oncology[176.9%], Super Micro[175.35%], Y-mAbs [151.47%], Sana [149.33%] Best Smallcap Stocks This Week:
Emergent BioSolutions[102.6%], Deciphera [73.24%], Origin Materials[66.52%], Eyenovia [60.78%], Cue Biopharma[56.04%], Aspen Aerogels[55.96%], Enovix [54.02%], Luna Innovations[53.77%], Codexis [47.37%], Carvana Co[44.31%], Office Properties[42.79%] Best Smallcap Stocks Daily:
Luna Innovations[36.00%], Twist Bioscience[28.74%], Ardelyx [28.42%], WideOpenWest [28.23%], 2U [26.63%], Joint [25.35%], FTC Solar[25.09%], Origin Materials[22.23%], Alignment Healthcare[21.97%], Clarus [18.67%], Aurora Innovation[18.09%]