
 Login Sign Up


| |||||
 |  | ||||

| 12Stocks.com Market Intelligence |
Best SmallCap Stocks
|
| In a hurry? Small Cap Stock Lists: Performance Trends Table, Stock Charts
Sort Small Cap stocks: Daily, Weekly, Year-to-Date, Market Cap & Trends. Filter Small Cap stocks list by sector: Show all, Tech, Finance, Energy, Staples, Retail, Industrial, Materials, Utilities and HealthCare Filter Small Cap stocks list by size: All Large Medium Small and MicroCap |
| 12Stocks.com Small Cap Stocks Performances & Trends Daily | |||||||||
|
|  The overall Smart Investing & Trading Score is 63 (0-bearish to 100-bullish) which puts Small Cap index in short term neutral to bullish trend. The Smart Investing & Trading Score from previous trading session is 87 and hence a deterioration of trend.
| ||||||||
Here are the Smart Investing & Trading Scores of the most requested small cap stocks at 12Stocks.com (click stock name for detailed review):
|


| 12Stocks.com: Investing in Smallcap Index with Stocks | |
|
The following table helps investors and traders sort through current performance and trends (as measured by Smart Investing & Trading Score) of various
stocks in the Smallcap Index. Quick View: Move mouse or cursor over stock symbol (ticker) to view short-term technical chart and over stock name to view long term chart. Click on  to add stock symbol to your watchlist and to add stock symbol to your watchlist and  to view watchlist. Click on any ticker or stock name for detailed market intelligence report for that stock. to view watchlist. Click on any ticker or stock name for detailed market intelligence report for that stock. |
12Stocks.com Performance of Stocks in Smallcap Index
| Ticker | Stock Name | Watchlist | Category | Recent Price | Smart Investing & Trading Score | Change % | Weekly Change% |
| DXLG | Destination XL |   | Services & Goods | 3.32 | 67 | 0.00% | 2.47% |
| GRWG | GrowGeneration | | Materials | 2.75 | 81 | -3.17% | 2.23% |
| HROW | Harrow Health | | Health Care | 10.60 | 50 | -1.94% | 2.12% |
| INSE | Inspired Entertainment | | Services & Goods | 8.75 | 28 | 1.16% | 2.10% |
| SM | SM Energy | | Energy | 51.10 | 83 | -0.12% | 1.93% |
| LOVE | Lovesac | | Consumer Staples | 23.82 | 93 | -1.85% | 1.88% |
| HQI | HireQuest | | Services & Goods | 12.70 | 50 | -0.39% | 1.76% |
| KFS | Kingsway Financial | | Financials | 9.28 | 88 | 1.20% | 1.75% |
| EPM | Evolution | | Energy | 5.62 | 28 | 2.37% | 1.63% |
| NRIM | Northrim BanCorp | | Financials | 50.07 | 90 | -0.62% | 1.46% |
| LYTS | LSI Industries | | Industrials | 15.49 | 83 | 1.77% | 1.37% |
| CUTR | Cutera | | Health Care | 2.56 | 90 | -6.91% | 1.19% |
| KRUS | Kura Sushi | | Services & Goods | 107.17 | 44 | 0.67% | 1.18% |
| SPY | SPDR S&P | | Utilities | 517.12 | 88 | 0.00% | 1.14% |
| CRMD | CorMedix | | Health Care | 5.90 | 95 | 1.03% | 1.03% |
| FLL | Full House | | Services & Goods | 5.04 | 17 | 0.80% | 1.00% |
| RNGR | Ranger Energy | | Energy | 10.15 | 18 | 2.42% | 1.00% |
| FRBA | First Bank | | Financials | 12.29 | 49 | 0.00% | 0.99% |
| PANL | Pangaea Logistics | | Transports | 7.47 | 59 | 0.13% | 0.95% |
| TSQ | Townsquare Media | | Services & Goods | 12.61 | 83 | -0.20% | 0.92% |
| WLFC | Willis Lease | | Transports | 56.50 | 93 | -0.37% | 0.91% |
| IWM | iShares Russell | | Utilities | 203.67 | 63 | -0.63% | 0.88% |
| XAIR | Beyond Air | | Health Care | 1.31 | 62 | 1.55% | 0.77% |
| IDT | IDT | | Technology | 38.37 | 100 | -1.41% | 0.63% |
| LXU | LSB Industries | | Materials | 8.56 | 88 | -1.27% | 0.59% |
| For chart view version of above stock list: Chart View ➞ 0 - 25 , 25 - 50 , 50 - 75 , 75 - 100 , 100 - 125 , 125 - 150 , 150 - 175 , 175 - 200 | ||
 | Click To Change The Sort Order: By Market Cap or Company Size Performance: Year-to-date, Week and Day |  |
| Too many stocks? View smallcap stocks filtered by marketcap & sector |
| Marketcap: All SmallCap Stocks (default-no microcap), Large, Mid-Range, Small |
| Smallcap Sector: Tech, Finance, Energy, Staples, Retail, Industrial, Materials, & Medical |
|
Get the most comprehensive stock market coverage daily at 12Stocks.com ➞ Best Stocks Today ➞ Best Stocks Weekly ➞ Best Stocks Year-to-Date ➞ Best Stocks Trends ➞  Best Stocks Today 12Stocks.com Best Nasdaq Stocks ➞ Best S&P 500 Stocks ➞ Best Tech Stocks ➞ Best Biotech Stocks ➞ |
| Detailed Overview of SmallCap Stocks |
| SmallCap Technical Overview, Leaders & Laggards, Top SmallCap ETF Funds & Detailed SmallCap Stocks List, Charts, Trends & More |
| Smallcap: Technical Analysis, Trends & YTD Performance | |
| SmallCap segment as represented by
IWM, an exchange-traded fund [ETF], holds basket of thousands of smallcap stocks from across all major sectors of the US stock market. The smallcap index (contains stocks like Riverbed & Sotheby's) is up by 1.47% and is currently underperforming the overall market by -6.62% year-to-date. Below is a quick view of technical charts and trends: | |
 IWM Weekly Chart |
|
| Long Term Trend: Deteriorating | |
| Medium Term Trend: Very Good | |
 IWM Daily Chart |
|
| Short Term Trend: Good | |
| Overall Trend Score: 63 | |
| YTD Performance: 1.47% | |
| **Trend Scores & Views Are Only For Educational Purposes And Not For Investing | |
| 12Stocks.com: Top Performing Small Cap Index Stocks | ||||||||||||||||||||||||||||||||||||||||||||||||
 The top performing Small Cap Index stocks year to date are
Now, more recently, over last week, the top performing Small Cap Index stocks on the move are


|
||||||||||||||||||||||||||||||||||||||||||||||||
| 12Stocks.com: Investing in Smallcap Index using Exchange Traded Funds | |
|
The following table shows list of key exchange traded funds (ETF) that
help investors track Smallcap index. The following list also includes leveraged ETF funds that track twice or thrice the daily returns of Smallcap indices. Short or inverse ETF funds move in the opposite direction to the index they track and are useful during market pullbacks or during bear markets. Quick View: Move mouse or cursor over ETF symbol (ticker) to view short-term technical chart and over ETF name to view long term chart. Click on ticker or stock name for detailed view. Click on to add stock symbol to your watchlist and to view watchlist. |
12Stocks.com List of ETFs that track Smallcap Index
| Ticker | ETF Name | Watchlist | Recent Price | Smart Investing & Trading Score | Change % | Week % | Year-to-date % |
| IWM | iShares Russell 2000 | | 203.67 | 63 | -0.63 | 0.88 | 1.47% |
| IJR | iShares Core S&P Small-Cap | | 107.77 | 93 | -0.79 | 0.59 | -0.45% |
| VTWO | Vanguard Russell 2000 ETF | | 82.27 | 75 | -0.69 | 0.81 | 1.44% |
| IWN | iShares Russell 2000 Value | | 154.59 | 93 | -0.67 | 0.24 | -0.48% |
| IWO | iShares Russell 2000 Growth | | 260.15 | 75 | -0.82 | 1.28 | 3.15% |
| IJS | iShares S&P Small-Cap 600 Value | | 99.06 | 62 | -0.62 | 0.34 | -3.89% |
| IJT | iShares S&P Small-Cap 600 Growth | | 128.54 | 88 | -1.00 | 0.61 | 2.72% |
| XSLV | PowerShares S&P SmallCap Low Volatil ETF | | 43.77 | 100 | -0.52 | 1.27 | -0.86% |
| SDD | ProShares UltraShort SmallCap600 | | 18.66 | 17 | 2.43 | -0.98 | 1.27% |
| SMLV | SPDR SSGA US Small Cap Low Volatil ETF | | 109.87 | 93 | -0.55 | 0.17 | -2.36% |
| SBB | ProShares Short SmallCap600 | | 16.11 | 7 | 0.91 | -0.28 | 1.16% |
| SAA | ProShares Ultra SmallCap600 | | 24.21 | 88 | -0.75 | 2.62 | -2.98% |
| 12Stocks.com: Charts, Trends, Fundamental Data and Performances of SmallCap Stocks | |
|
We now take in-depth look at all SmallCap stocks including charts, multi-period performances and overall trends (as measured by Smart Investing & Trading Score). One can sort SmallCap stocks (click link to choose) by Daily, Weekly and by Year-to-Date performances. Also, one can sort by size of the company or by market capitalization. |
| Select Your Default Chart Type: | |||||
| |||||
| Click on stock symbol or name for detailed view. Click on to add stock symbol to your watchlist and to view watchlist. Quick View: Move mouse or cursor over "Daily" to quickly view daily technical stock chart and over "Weekly" to view weekly technical stock chart. | |||||
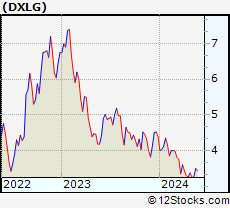 | DXLG Destination XL Group, Inc. |
| Sector: Services & Goods | |
| SubSector: Apparel Stores | |
| MarketCap: 16.6408 Millions | |
| Recent Price: 3.32 Smart Investing & Trading Score: 67 | |
| Day Percent Change: 0.00% Day Change: 0.00 | |
| Week Change: 2.47% Year-to-date Change: -24.6% | |
| DXLG Links: Profile News Message Board | |
| Charts:- Daily , Weekly | |
| Add DXLG to Watchlist: View: Get Complete DXLG Trend Analysis ➞ | |
 | GRWG GrowGeneration Corp. |
| Sector: Materials | |
| SubSector: Agricultural Chemicals | |
| MarketCap: 118.429 Millions | |
| Recent Price: 2.75 Smart Investing & Trading Score: 81 | |
| Day Percent Change: -3.17% Day Change: -0.09 | |
| Week Change: 2.23% Year-to-date Change: 9.6% | |
| GRWG Links: Profile News Message Board | |
| Charts:- Daily , Weekly | |
| Add GRWG to Watchlist: View: Get Complete GRWG Trend Analysis ➞ | |
 | HROW Harrow Health, Inc. |
| Sector: Health Care | |
| SubSector: Drug Manufacturers - Other | |
| MarketCap: 104.033 Millions | |
| Recent Price: 10.60 Smart Investing & Trading Score: 50 | |
| Day Percent Change: -1.94% Day Change: -0.21 | |
| Week Change: 2.12% Year-to-date Change: -5.4% | |
| HROW Links: Profile News Message Board | |
| Charts:- Daily , Weekly | |
| Add HROW to Watchlist: View: Get Complete HROW Trend Analysis ➞ | |
 | INSE Inspired Entertainment, Inc. |
| Sector: Services & Goods | |
| SubSector: Gaming Activities | |
| MarketCap: 80.9289 Millions | |
| Recent Price: 8.75 Smart Investing & Trading Score: 28 | |
| Day Percent Change: 1.16% Day Change: 0.10 | |
| Week Change: 2.1% Year-to-date Change: -11.4% | |
| INSE Links: Profile News Message Board | |
| Charts:- Daily , Weekly | |
| Add INSE to Watchlist: View: Get Complete INSE Trend Analysis ➞ | |
 | SM SM Energy Company |
| Sector: Energy | |
| SubSector: Independent Oil & Gas | |
| MarketCap: 137.593 Millions | |
| Recent Price: 51.10 Smart Investing & Trading Score: 83 | |
| Day Percent Change: -0.12% Day Change: -0.06 | |
| Week Change: 1.93% Year-to-date Change: 32.0% | |
| SM Links: Profile News Message Board | |
| Charts:- Daily , Weekly | |
| Add SM to Watchlist: View: Get Complete SM Trend Analysis ➞ | |
 | LOVE The Lovesac Company |
| Sector: Consumer Staples | |
| SubSector: Home Furnishings & Fixtures | |
| MarketCap: 112.835 Millions | |
| Recent Price: 23.82 Smart Investing & Trading Score: 93 | |
| Day Percent Change: -1.85% Day Change: -0.45 | |
| Week Change: 1.88% Year-to-date Change: -6.8% | |
| LOVE Links: Profile News Message Board | |
| Charts:- Daily , Weekly | |
| Add LOVE to Watchlist: View: Get Complete LOVE Trend Analysis ➞ | |
 | HQI HireQuest, Inc. |
| Sector: Services & Goods | |
| SubSector: Staffing & Outsourcing Services | |
| MarketCap: 77 Millions | |
| Recent Price: 12.70 Smart Investing & Trading Score: 50 | |
| Day Percent Change: -0.39% Day Change: -0.05 | |
| Week Change: 1.76% Year-to-date Change: -17.3% | |
| HQI Links: Profile News Message Board | |
| Charts:- Daily , Weekly | |
| Add HQI to Watchlist: View: Get Complete HQI Trend Analysis ➞ | |
 | KFS Kingsway Financial Services Inc. |
| Sector: Financials | |
| SubSector: Property & Casualty Insurance | |
| MarketCap: 47.5812 Millions | |
| Recent Price: 9.28 Smart Investing & Trading Score: 88 | |
| Day Percent Change: 1.20% Day Change: 0.11 | |
| Week Change: 1.75% Year-to-date Change: 10.5% | |
| KFS Links: Profile News Message Board | |
| Charts:- Daily , Weekly | |
| Add KFS to Watchlist: View: Get Complete KFS Trend Analysis ➞ | |
 | EPM Evolution Petroleum Corporation |
| Sector: Energy | |
| SubSector: Independent Oil & Gas | |
| MarketCap: 98.0593 Millions | |
| Recent Price: 5.62 Smart Investing & Trading Score: 28 | |
| Day Percent Change: 2.37% Day Change: 0.13 | |
| Week Change: 1.63% Year-to-date Change: -3.3% | |
| EPM Links: Profile News Message Board | |
| Charts:- Daily , Weekly | |
| Add EPM to Watchlist: View: Get Complete EPM Trend Analysis ➞ | |
 | NRIM Northrim BanCorp, Inc. |
| Sector: Financials | |
| SubSector: Regional - Pacific Banks | |
| MarketCap: 147.629 Millions | |
| Recent Price: 50.07 Smart Investing & Trading Score: 90 | |
| Day Percent Change: -0.62% Day Change: -0.31 | |
| Week Change: 1.46% Year-to-date Change: -12.5% | |
| NRIM Links: Profile News Message Board | |
| Charts:- Daily , Weekly | |
| Add NRIM to Watchlist: View: Get Complete NRIM Trend Analysis ➞ | |
 | LYTS LSI Industries Inc. |
| Sector: Industrials | |
| SubSector: Industrial Electrical Equipment | |
| MarketCap: 85.7879 Millions | |
| Recent Price: 15.49 Smart Investing & Trading Score: 83 | |
| Day Percent Change: 1.77% Day Change: 0.27 | |
| Week Change: 1.37% Year-to-date Change: 10.0% | |
| LYTS Links: Profile News Message Board | |
| Charts:- Daily , Weekly | |
| Add LYTS to Watchlist: View: Get Complete LYTS Trend Analysis ➞ | |
 | CUTR Cutera, Inc. |
| Sector: Health Care | |
| SubSector: Medical Appliances & Equipment | |
| MarketCap: 143.68 Millions | |
| Recent Price: 2.56 Smart Investing & Trading Score: 90 | |
| Day Percent Change: -6.91% Day Change: -0.19 | |
| Week Change: 1.19% Year-to-date Change: -27.4% | |
| CUTR Links: Profile News Message Board | |
| Charts:- Daily , Weekly | |
| Add CUTR to Watchlist: View: Get Complete CUTR Trend Analysis ➞ | |
 | KRUS Kura Sushi USA, Inc. |
| Sector: Services & Goods | |
| SubSector: Restaurants | |
| MarketCap: 74.057 Millions | |
| Recent Price: 107.17 Smart Investing & Trading Score: 44 | |
| Day Percent Change: 0.67% Day Change: 0.71 | |
| Week Change: 1.18% Year-to-date Change: 40.9% | |
| KRUS Links: Profile News Message Board | |
| Charts:- Daily , Weekly | |
| Add KRUS to Watchlist: View: Get Complete KRUS Trend Analysis ➞ | |
 | SPY SPDR S&P 500 ETF |
| Sector: Utilities | |
| SubSector: Exchange Traded Fund | |
| MarketCap: 0 Millions | |
| Recent Price: 517.12 Smart Investing & Trading Score: 88 | |
| Day Percent Change: 0.00% Day Change: -0.02 | |
| Week Change: 1.14% Year-to-date Change: 8.8% | |
| SPY Links: Profile News Message Board | |
| Charts:- Daily , Weekly | |
| Add SPY to Watchlist: View: Get Complete SPY Trend Analysis ➞ | |
 | CRMD CorMedix, Inc. |
| Sector: Health Care | |
| SubSector: Biotechnology | |
| MarketCap: 90.7785 Millions | |
| Recent Price: 5.90 Smart Investing & Trading Score: 95 | |
| Day Percent Change: 1.03% Day Change: 0.06 | |
| Week Change: 1.03% Year-to-date Change: 56.9% | |
| CRMD Links: Profile News Message Board | |
| Charts:- Daily , Weekly | |
| Add CRMD to Watchlist: View: Get Complete CRMD Trend Analysis ➞ | |
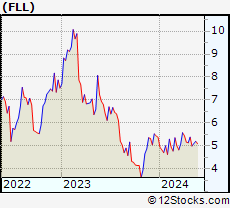 | FLL Full House Resorts, Inc. |
| Sector: Services & Goods | |
| SubSector: Resorts & Casinos | |
| MarketCap: 33.5794 Millions | |
| Recent Price: 5.04 Smart Investing & Trading Score: 17 | |
| Day Percent Change: 0.80% Day Change: 0.04 | |
| Week Change: 1% Year-to-date Change: -6.2% | |
| FLL Links: Profile News Message Board | |
| Charts:- Daily , Weekly | |
| Add FLL to Watchlist: View: Get Complete FLL Trend Analysis ➞ | |
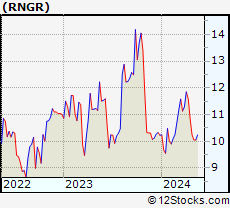 | RNGR Ranger Energy Services, Inc. |
| Sector: Energy | |
| SubSector: Oil & Gas Equipment & Services | |
| MarketCap: 39.4461 Millions | |
| Recent Price: 10.15 Smart Investing & Trading Score: 18 | |
| Day Percent Change: 2.42% Day Change: 0.24 | |
| Week Change: 1% Year-to-date Change: -0.8% | |
| RNGR Links: Profile News Message Board | |
| Charts:- Daily , Weekly | |
| Add RNGR to Watchlist: View: Get Complete RNGR Trend Analysis ➞ | |
 | FRBA First Bank |
| Sector: Financials | |
| SubSector: Regional - Mid-Atlantic Banks | |
| MarketCap: 124.859 Millions | |
| Recent Price: 12.29 Smart Investing & Trading Score: 49 | |
| Day Percent Change: 0.00% Day Change: 0.00 | |
| Week Change: 0.99% Year-to-date Change: -16.4% | |
| FRBA Links: Profile News Message Board | |
| Charts:- Daily , Weekly | |
| Add FRBA to Watchlist: View: Get Complete FRBA Trend Analysis ➞ | |
 | PANL Pangaea Logistics Solutions, Ltd. |
| Sector: Transports | |
| SubSector: Shipping | |
| MarketCap: 80 Millions | |
| Recent Price: 7.47 Smart Investing & Trading Score: 59 | |
| Day Percent Change: 0.13% Day Change: 0.01 | |
| Week Change: 0.95% Year-to-date Change: -9.3% | |
| PANL Links: Profile News Message Board | |
| Charts:- Daily , Weekly | |
| Add PANL to Watchlist: View: Get Complete PANL Trend Analysis ➞ | |
 | TSQ Townsquare Media, Inc. |
| Sector: Services & Goods | |
| SubSector: Broadcasting - Radio | |
| MarketCap: 101.795 Millions | |
| Recent Price: 12.61 Smart Investing & Trading Score: 83 | |
| Day Percent Change: -0.20% Day Change: -0.03 | |
| Week Change: 0.92% Year-to-date Change: 19.4% | |
| TSQ Links: Profile News Message Board | |
| Charts:- Daily , Weekly | |
| Add TSQ to Watchlist: View: Get Complete TSQ Trend Analysis ➞ | |
 | WLFC Willis Lease Finance Corporation |
| Sector: Transports | |
| SubSector: Rental & Leasing Services | |
| MarketCap: 122.044 Millions | |
| Recent Price: 56.50 Smart Investing & Trading Score: 93 | |
| Day Percent Change: -0.37% Day Change: -0.21 | |
| Week Change: 0.91% Year-to-date Change: 15.6% | |
| WLFC Links: Profile News Message Board | |
| Charts:- Daily , Weekly | |
| Add WLFC to Watchlist: View: Get Complete WLFC Trend Analysis ➞ | |
 | IWM iShares Russell 2000 |
| Sector: Utilities | |
| SubSector: Exchange Traded Fund | |
| MarketCap: 0 Millions | |
| Recent Price: 203.67 Smart Investing & Trading Score: 63 | |
| Day Percent Change: -0.63% Day Change: -1.30 | |
| Week Change: 0.88% Year-to-date Change: 1.5% | |
| IWM Links: Profile News Message Board | |
| Charts:- Daily , Weekly | |
| Add IWM to Watchlist: View: Get Complete IWM Trend Analysis ➞ | |
 | XAIR Beyond Air, Inc. |
| Sector: Health Care | |
| SubSector: Medical Appliances & Equipment | |
| MarketCap: 132.48 Millions | |
| Recent Price: 1.31 Smart Investing & Trading Score: 62 | |
| Day Percent Change: 1.55% Day Change: 0.02 | |
| Week Change: 0.77% Year-to-date Change: -33.2% | |
| XAIR Links: Profile News Message Board | |
| Charts:- Daily , Weekly | |
| Add XAIR to Watchlist: View: Get Complete XAIR Trend Analysis ➞ | |
 | IDT IDT Corporation |
| Sector: Technology | |
| SubSector: Diversified Communication Services | |
| MarketCap: 130.064 Millions | |
| Recent Price: 38.37 Smart Investing & Trading Score: 100 | |
| Day Percent Change: -1.41% Day Change: -0.55 | |
| Week Change: 0.63% Year-to-date Change: 12.6% | |
| IDT Links: Profile News Message Board | |
| Charts:- Daily , Weekly | |
| Add IDT to Watchlist: View: Get Complete IDT Trend Analysis ➞ | |
 | LXU LSB Industries, Inc. |
| Sector: Materials | |
| SubSector: Chemicals - Major Diversified | |
| MarketCap: 51.7736 Millions | |
| Recent Price: 8.56 Smart Investing & Trading Score: 88 | |
| Day Percent Change: -1.27% Day Change: -0.11 | |
| Week Change: 0.59% Year-to-date Change: -8.1% | |
| LXU Links: Profile News Message Board | |
| Charts:- Daily , Weekly | |
| Add LXU to Watchlist: View: Get Complete LXU Trend Analysis ➞ | |
| For tabular summary view of above stock list: Summary View ➞ 0 - 25 , 25 - 50 , 50 - 75 , 75 - 100 , 100 - 125 , 125 - 150 , 150 - 175 , 175 - 200 | ||
| Click To Change The Sort Order: By Market Cap or Company Size Performance: Year-to-date, Week and Day | |
| Select Chart Type: | ||
| Too many stocks? View smallcap stocks filtered by marketcap & sector |
| Marketcap: All SmallCap Stocks (default-no microcap), Large, Mid-Range, Small & MicroCap |
| Sector: Tech, Finance, Energy, Staples, Retail, Industrial, Materials, Utilities & Medical |
|
Best Stocks Today 12Stocks.com |
© 2024 12Stocks.com Terms & Conditions Privacy Contact Us
All Information Provided Only For Education And Not To Be Used For Investing or Trading. See Terms & Conditions


One More Thing ... Get Best Stocks Delivered Daily!
Never Ever Miss A Move With Our Top Ten Stocks Lists
Find Best Stocks In Any Market - Bull or Bear Market
Take A Peek At Our Top Ten Stocks Lists: Daily, Weekly, Year-to-Date & Top Trends
Find Best Stocks In Any Market - Bull or Bear Market
Take A Peek At Our Top Ten Stocks Lists: Daily, Weekly, Year-to-Date & Top Trends
Smallcap Stocks With Best Up Trends [0-bearish to 100-bullish]: Alpha and[100], Myriad Genetics[100], Orthofix Medical[100], Inogen [100], Ardmore Shipping[100], Wolverine World[100], Emergent BioSolutions[100], Sterling Construction[100], Halozyme [100], Edgewell Personal[100], REV Group[100]
Best Smallcap Stocks Year-to-Date:
Janux [384.97%], Viking [319.59%], Bakkt [255.16%], Longboard [254.83%], Alpine Immune[239.47%], Super Micro[193.67%], Vera [189.15%], Avidity Biosciences[185.95%], Cullinan Oncology[179.94%], Arcutis Bio[146.28%], Sana [135.19%] Best Smallcap Stocks This Week:
Perficient [52.68%], DASAN Zhone[40.85%], Innodata [37.95%], Thoughtworks Holding[37.33%], Design [32.5%], Cricut [30.45%], Latham Group[30.4%], Great Lakes[30.24%], Vigil Neuroscience[29.78%], Sterling Construction[25.77%], Outset Medical[25.72%] Best Smallcap Stocks Daily:
Innodata [37.54%], Cricut [35.17%], Veritone [25.41%], Ameresco [22.19%], PowerSchool [21.21%], Alpha and[19.97%], Myriad Genetics[19.26%], Latham Group[19.06%], Hyster-Yale Materials[18.10%], Denali [15.16%], Adaptive Bio[14.15%]