
 Login Sign Up


| |||||
 |  | ||||

| 12Stocks.com Market Intelligence |
Best SmallCap Stocks
|
| In a hurry? Small Cap Stock Lists: Performance Trends Table, Stock Charts
Sort Small Cap stocks: Daily, Weekly, Year-to-Date, Market Cap & Trends. Filter Small Cap stocks list by sector: Show all, Tech, Finance, Energy, Staples, Retail, Industrial, Materials, Utilities and HealthCare Filter Small Cap stocks list by size: All Large Medium Small and MicroCap |
| 12Stocks.com Small Cap Stocks Performances & Trends Daily | |||||||||
|
|  The overall Smart Investing & Trading Score is 49 (0-bearish to 100-bullish) which puts Small Cap index in short term neutral trend. The Smart Investing & Trading Score from previous trading session is 14 and hence an improvement of trend.
| ||||||||
Here are the Smart Investing & Trading Scores of the most requested small cap stocks at 12Stocks.com (click stock name for detailed review):
|


| 12Stocks.com: Investing in Smallcap Index with Stocks | |
|
The following table helps investors and traders sort through current performance and trends (as measured by Smart Investing & Trading Score) of various
stocks in the Smallcap Index. Quick View: Move mouse or cursor over stock symbol (ticker) to view short-term technical chart and over stock name to view long term chart. Click on  to add stock symbol to your watchlist and to add stock symbol to your watchlist and  to view watchlist. Click on any ticker or stock name for detailed market intelligence report for that stock. to view watchlist. Click on any ticker or stock name for detailed market intelligence report for that stock. |
12Stocks.com Performance of Stocks in Smallcap Index
| Ticker | Stock Name | Watchlist | Category | Recent Price | Smart Investing & Trading Score | Change % | Weekly Change% |
| KWR | Quaker Chemical |   | Materials | 192.70 | 57 | 2.77% | 1.30% |
| CENTA | Central Garden | | Materials | 35.89 | 59 | 0.59% | 0.98% |
| CBT | Cabot | | Materials | 94.22 | 90 | 2.46% | 0.67% |
| IOSP | Innospec | | Materials | 121.70 | 25 | 1.05% | 0.48% |
| TSE | Trinseo S.A | | Materials | 2.82 | 37 | 8.46% | 0.36% |
| KOP | Koppers | | Materials | 52.91 | 17 | 1.07% | 0.34% |
| WOR | Worthington Industries | | Materials | 58.56 | 32 | 1.04% | 0.26% |
| METCB | Ramaco Resources | | Materials | 11.55 | 50 | -1.37% | 0.17% |
| KNF | Knife River | | Materials | 78.13 | 43 | 0.50% | -0.15% |
| IIIN | Insteel Industries | | Materials | 32.32 | 18 | 1.44% | -0.22% |
| PRM | Perimeter Solutions | | Materials | 7.02 | 53 | 1.15% | -0.57% |
| KALU | Kaiser Aluminum | | Materials | 94.33 | 75 | 2.70% | -0.62% |
| ASIX | AdvanSix | | Materials | 25.75 | 20 | 0.94% | -1.00% |
| ROCK | Gibraltar Industries | | Materials | 71.24 | 10 | 3.46% | -1.41% |
| BHIL | Benson Hill | | Materials | 0.19 | 42 | 3.60% | -1.78% |
| VHI | Valhi | | Materials | 14.71 | 46 | -0.41% | -1.93% |
| SLCA | U.S. Silica | | Materials | 15.52 | 88 | 0.39% | -2.33% |
| CMP | Compass Minerals | | Materials | 12.71 | 30 | 4.61% | -2.53% |
| CDE | Coeur Mining | | Materials | 4.79 | 68 | 4.59% | -3.04% |
| TG | Tredegar | | Materials | 6.36 | 46 | 0.47% | -3.05% |
| GPRE | Green Plains | | Materials | 20.74 | 20 | 3.08% | -3.08% |
| CSTM | Constellium SE | | Materials | 19.98 | 36 | 1.22% | -3.48% |
| ARCH | Arch Coal | | Materials | 158.39 | 32 | 0.98% | -3.67% |
| FF | FutureFuel | | Materials | 5.34 | 10 | 0.56% | -3.96% |
| CEIX | CONSOL Energy | | Materials | 82.20 | 17 | 0.96% | -4.12% |
| For chart view version of above stock list: Chart View ➞ 0 - 25 , 25 - 50 , 50 - 75 | ||
 | Click To Change The Sort Order: By Market Cap or Company Size Performance: Year-to-date, Week and Day |  |
| Too many stocks? View smallcap stocks filtered by marketcap & sector |
| Marketcap: All SmallCap Stocks (default-no microcap), Large, Mid-Range, Small |
| Smallcap Sector: Tech, Finance, Energy, Staples, Retail, Industrial, Materials, & Medical |
|
Get the most comprehensive stock market coverage daily at 12Stocks.com ➞ Best Stocks Today ➞ Best Stocks Weekly ➞ Best Stocks Year-to-Date ➞ Best Stocks Trends ➞  Best Stocks Today 12Stocks.com Best Nasdaq Stocks ➞ Best S&P 500 Stocks ➞ Best Tech Stocks ➞ Best Biotech Stocks ➞ |
| Detailed Overview of SmallCap Stocks |
| SmallCap Technical Overview, Leaders & Laggards, Top SmallCap ETF Funds & Detailed SmallCap Stocks List, Charts, Trends & More |
| Smallcap: Technical Analysis, Trends & YTD Performance | |
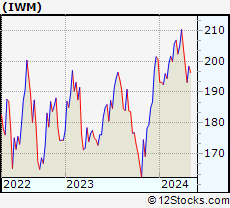
| SmallCap segment as represented by
IWM, an exchange-traded fund [ETF], holds basket of thousands of smallcap stocks from across all major sectors of the US stock market. The smallcap index (contains stocks like Riverbed & Sotheby's) is down by -0.39% and is currently underperforming the overall market by -6.01% year-to-date. Below is a quick view of technical charts and trends: | |
 IWM Weekly Chart |
|
| Long Term Trend: Not Good | |
| Medium Term Trend: Good | |
 IWM Daily Chart |
|
| Short Term Trend: Deteriorating | |
| Overall Trend Score: 49 | |
| YTD Performance: -0.39% | |
| **Trend Scores & Views Are Only For Educational Purposes And Not For Investing | |
| 12Stocks.com: Top Performing Small Cap Index Stocks | ||||||||||||||||||||||||||||||||||||||||||||||||
 The top performing Small Cap Index stocks year to date are
Now, more recently, over last week, the top performing Small Cap Index stocks on the move are


|
||||||||||||||||||||||||||||||||||||||||||||||||
| 12Stocks.com: Investing in Smallcap Index using Exchange Traded Funds | |
|
The following table shows list of key exchange traded funds (ETF) that
help investors track Smallcap index. The following list also includes leveraged ETF funds that track twice or thrice the daily returns of Smallcap indices. Short or inverse ETF funds move in the opposite direction to the index they track and are useful during market pullbacks or during bear markets. Quick View: Move mouse or cursor over ETF symbol (ticker) to view short-term technical chart and over ETF name to view long term chart. Click on ticker or stock name for detailed view. Click on to add stock symbol to your watchlist and to view watchlist. |
12Stocks.com List of ETFs that track Smallcap Index
| Ticker | ETF Name | Watchlist | Recent Price | Smart Investing & Trading Score | Change % | Week % | Year-to-date % |
| IWM | iShares Russell 2000 | | 199.92 | 49 | 1.84 | 0.77 | -0.39% |
| IJR | iShares Core S&P Small-Cap | | 106.33 | 50 | 1.52 | 0.64 | -1.77% |
| VTWO | Vanguard Russell 2000 ETF | | 80.85 | 42 | 1.88 | 0.79 | -0.31% |
| IWN | iShares Russell 2000 Value | | 152.88 | 75 | 2.04 | 1.15 | -1.58% |
| IWO | iShares Russell 2000 Growth | | 254.34 | 32 | 1.91 | 0.49 | 0.84% |
| IJS | iShares S&P Small-Cap 600 Value | | 98.02 | 43 | 1.68 | 0.85 | -4.9% |
| IJT | iShares S&P Small-Cap 600 Growth | | 126.72 | 63 | 1.42 | 0.5 | 1.26% |
| XSLV | PowerShares S&P SmallCap Low Volatil ETF | | 43.14 | 73 | 0.72 | 0.98 | -2.29% |
| SDD | ProShares UltraShort SmallCap600 | | 19.31 | 56 | -2.02 | -0.21 | 4.79% |
| SMLV | SPDR SSGA US Small Cap Low Volatil ETF | | 108.83 | 87 | 1.30 | 1.22 | -3.27% |
| SAA | ProShares Ultra SmallCap600 | | 22.93 | 42 | 1.56 | -0.46 | -8.08% |
| SBB | ProShares Short SmallCap600 | | 16.37 | 49 | -1.14 | -0.09 | 2.76% |
| 12Stocks.com: Charts, Trends, Fundamental Data and Performances of SmallCap Stocks | |
|
We now take in-depth look at all SmallCap stocks including charts, multi-period performances and overall trends (as measured by Smart Investing & Trading Score). One can sort SmallCap stocks (click link to choose) by Daily, Weekly and by Year-to-Date performances. Also, one can sort by size of the company or by market capitalization. |
| Select Your Default Chart Type: | |||||
| |||||
| Click on stock symbol or name for detailed view. Click on to add stock symbol to your watchlist and to view watchlist. Quick View: Move mouse or cursor over "Daily" to quickly view daily technical stock chart and over "Weekly" to view weekly technical stock chart. | |||||

 | KWR Quaker Chemical Corporation |
| Sector: Materials | |
| SubSector: Specialty Chemicals | |
| MarketCap: 2411.67 Millions | |
| Recent Price: 192.70 Smart Investing & Trading Score: 57 | |
| Day Percent Change: 2.77% Day Change: 5.19 | |
| Week Change: 1.3% Year-to-date Change: -9.7% | |
| KWR Links: Profile News Message Board | |
| Charts:- Daily , Weekly | |
| Add KWR to Watchlist: View: Get Complete KWR Trend Analysis ➞ | |
 | CENTA Central Garden & Pet Company |
| Sector: Materials | |
| SubSector: Agricultural Chemicals | |
| MarketCap: 953 Millions | |
| Recent Price: 35.89 Smart Investing & Trading Score: 59 | |
| Day Percent Change: 0.59% Day Change: 0.21 | |
| Week Change: 0.98% Year-to-date Change: -18.5% | |
| CENTA Links: Profile News Message Board | |
| Charts:- Daily , Weekly | |
| Add CENTA to Watchlist: View: Get Complete CENTA Trend Analysis ➞ | |
 | CBT Cabot Corporation |
| Sector: Materials | |
| SubSector: Specialty Chemicals | |
| MarketCap: 1261.47 Millions | |
| Recent Price: 94.22 Smart Investing & Trading Score: 90 | |
| Day Percent Change: 2.46% Day Change: 2.26 | |
| Week Change: 0.67% Year-to-date Change: 12.8% | |
| CBT Links: Profile News Message Board | |
| Charts:- Daily , Weekly | |
| Add CBT to Watchlist: View: Get Complete CBT Trend Analysis ➞ | |
 | IOSP Innospec Inc. |
| Sector: Materials | |
| SubSector: Specialty Chemicals | |
| MarketCap: 1665.57 Millions | |
| Recent Price: 121.70 Smart Investing & Trading Score: 25 | |
| Day Percent Change: 1.05% Day Change: 1.26 | |
| Week Change: 0.48% Year-to-date Change: -1.3% | |
| IOSP Links: Profile News Message Board | |
| Charts:- Daily , Weekly | |
| Add IOSP to Watchlist: View: Get Complete IOSP Trend Analysis ➞ | |
 | TSE Trinseo S.A. |
| Sector: Materials | |
| SubSector: Specialty Chemicals | |
| MarketCap: 790.057 Millions | |
| Recent Price: 2.82 Smart Investing & Trading Score: 37 | |
| Day Percent Change: 8.46% Day Change: 0.22 | |
| Week Change: 0.36% Year-to-date Change: -66.3% | |
| TSE Links: Profile News Message Board | |
| Charts:- Daily , Weekly | |
| Add TSE to Watchlist: View: Get Complete TSE Trend Analysis ➞ | |
 | KOP Koppers Holdings Inc. |
| Sector: Materials | |
| SubSector: Specialty Chemicals | |
| MarketCap: 232.657 Millions | |
| Recent Price: 52.91 Smart Investing & Trading Score: 17 | |
| Day Percent Change: 1.07% Day Change: 0.56 | |
| Week Change: 0.34% Year-to-date Change: 3.3% | |
| KOP Links: Profile News Message Board | |
| Charts:- Daily , Weekly | |
| Add KOP to Watchlist: View: Get Complete KOP Trend Analysis ➞ | |
 | WOR Worthington Industries, Inc. |
| Sector: Materials | |
| SubSector: Steel & Iron | |
| MarketCap: 1354.48 Millions | |
| Recent Price: 58.56 Smart Investing & Trading Score: 32 | |
| Day Percent Change: 1.04% Day Change: 0.60 | |
| Week Change: 0.26% Year-to-date Change: 1.8% | |
| WOR Links: Profile News Message Board | |
| Charts:- Daily , Weekly | |
| Add WOR to Watchlist: View: Get Complete WOR Trend Analysis ➞ | |
 | METCB Ramaco Resources, Inc. |
| Sector: Materials | |
| SubSector: Coking Coal | |
| MarketCap: 469 Millions | |
| Recent Price: 11.55 Smart Investing & Trading Score: 50 | |
| Day Percent Change: -1.37% Day Change: -0.16 | |
| Week Change: 0.17% Year-to-date Change: -12.8% | |
| METCB Links: Profile News Message Board | |
| Charts:- Daily , Weekly | |
| Add METCB to Watchlist: View: Get Complete METCB Trend Analysis ➞ | |
 | KNF Knife River Corporation |
| Sector: Materials | |
| SubSector: Building Materials | |
| MarketCap: 2570 Millions | |
| Recent Price: 78.13 Smart Investing & Trading Score: 43 | |
| Day Percent Change: 0.50% Day Change: 0.39 | |
| Week Change: -0.15% Year-to-date Change: 17.5% | |
| KNF Links: Profile News Message Board | |
| Charts:- Daily , Weekly | |
| Add KNF to Watchlist: View: Get Complete KNF Trend Analysis ➞ | |
 | IIIN Insteel Industries, Inc. |
| Sector: Materials | |
| SubSector: Steel & Iron | |
| MarketCap: 269.488 Millions | |
| Recent Price: 32.32 Smart Investing & Trading Score: 18 | |
| Day Percent Change: 1.44% Day Change: 0.46 | |
| Week Change: -0.22% Year-to-date Change: -15.6% | |
| IIIN Links: Profile News Message Board | |
| Charts:- Daily , Weekly | |
| Add IIIN to Watchlist: View: Get Complete IIIN Trend Analysis ➞ | |
 | PRM Perimeter Solutions, SA |
| Sector: Materials | |
| SubSector: Specialty Chemicals | |
| MarketCap: 930 Millions | |
| Recent Price: 7.02 Smart Investing & Trading Score: 53 | |
| Day Percent Change: 1.15% Day Change: 0.08 | |
| Week Change: -0.57% Year-to-date Change: 52.8% | |
| PRM Links: Profile News Message Board | |
| Charts:- Daily , Weekly | |
| Add PRM to Watchlist: View: Get Complete PRM Trend Analysis ➞ | |
 | KALU Kaiser Aluminum Corporation |
| Sector: Materials | |
| SubSector: Aluminum | |
| MarketCap: 969.808 Millions | |
| Recent Price: 94.33 Smart Investing & Trading Score: 75 | |
| Day Percent Change: 2.70% Day Change: 2.48 | |
| Week Change: -0.62% Year-to-date Change: 32.5% | |
| KALU Links: Profile News Message Board | |
| Charts:- Daily , Weekly | |
| Add KALU to Watchlist: View: Get Complete KALU Trend Analysis ➞ | |
 | ASIX AdvanSix Inc. |
| Sector: Materials | |
| SubSector: Chemicals - Major Diversified | |
| MarketCap: 394.136 Millions | |
| Recent Price: 25.75 Smart Investing & Trading Score: 20 | |
| Day Percent Change: 0.94% Day Change: 0.24 | |
| Week Change: -1% Year-to-date Change: -14.1% | |
| ASIX Links: Profile News Message Board | |
| Charts:- Daily , Weekly | |
| Add ASIX to Watchlist: View: Get Complete ASIX Trend Analysis ➞ | |
 | ROCK Gibraltar Industries, Inc. |
| Sector: Materials | |
| SubSector: Steel & Iron | |
| MarketCap: 1341.08 Millions | |
| Recent Price: 71.24 Smart Investing & Trading Score: 10 | |
| Day Percent Change: 3.46% Day Change: 2.38 | |
| Week Change: -1.41% Year-to-date Change: -9.8% | |
| ROCK Links: Profile News Message Board | |
| Charts:- Daily , Weekly | |
| Add ROCK to Watchlist: View: Get Complete ROCK Trend Analysis ➞ | |
 | BHIL Benson Hill, Inc. |
| Sector: Materials | |
| SubSector: Agricultural Inputs | |
| MarketCap: 236 Millions | |
| Recent Price: 0.19 Smart Investing & Trading Score: 42 | |
| Day Percent Change: 3.60% Day Change: 0.01 | |
| Week Change: -1.78% Year-to-date Change: 9.9% | |
| BHIL Links: Profile News Message Board | |
| Charts:- Daily , Weekly | |
| Add BHIL to Watchlist: View: Get Complete BHIL Trend Analysis ➞ | |
 | VHI Valhi, Inc. |
| Sector: Materials | |
| SubSector: Chemicals - Major Diversified | |
| MarketCap: 394.336 Millions | |
| Recent Price: 14.71 Smart Investing & Trading Score: 46 | |
| Day Percent Change: -0.41% Day Change: -0.06 | |
| Week Change: -1.93% Year-to-date Change: -3.2% | |
| VHI Links: Profile News Message Board | |
| Charts:- Daily , Weekly | |
| Add VHI to Watchlist: View: Get Complete VHI Trend Analysis ➞ | |
 | SLCA U.S. Silica Holdings, Inc. |
| Sector: Materials | |
| SubSector: Industrial Metals & Minerals | |
| MarketCap: 93 Millions | |
| Recent Price: 15.52 Smart Investing & Trading Score: 88 | |
| Day Percent Change: 0.39% Day Change: 0.06 | |
| Week Change: -2.33% Year-to-date Change: 37.2% | |
| SLCA Links: Profile News Message Board | |
| Charts:- Daily , Weekly | |
| Add SLCA to Watchlist: View: Get Complete SLCA Trend Analysis ➞ | |
 | CMP Compass Minerals International, Inc. |
| Sector: Materials | |
| SubSector: Industrial Metals & Minerals | |
| MarketCap: 1512.1 Millions | |
| Recent Price: 12.71 Smart Investing & Trading Score: 30 | |
| Day Percent Change: 4.61% Day Change: 0.56 | |
| Week Change: -2.53% Year-to-date Change: -49.8% | |
| CMP Links: Profile News Message Board | |
| Charts:- Daily , Weekly | |
| Add CMP to Watchlist: View: Get Complete CMP Trend Analysis ➞ | |
 | CDE Coeur Mining, Inc. |
| Sector: Materials | |
| SubSector: Gold | |
| MarketCap: 853.219 Millions | |
| Recent Price: 4.79 Smart Investing & Trading Score: 68 | |
| Day Percent Change: 4.59% Day Change: 0.21 | |
| Week Change: -3.04% Year-to-date Change: 46.9% | |
| CDE Links: Profile News Message Board | |
| Charts:- Daily , Weekly | |
| Add CDE to Watchlist: View: Get Complete CDE Trend Analysis ➞ | |
 | TG Tredegar Corporation |
| Sector: Materials | |
| SubSector: Specialty Chemicals | |
| MarketCap: 545.057 Millions | |
| Recent Price: 6.36 Smart Investing & Trading Score: 46 | |
| Day Percent Change: 0.47% Day Change: 0.03 | |
| Week Change: -3.05% Year-to-date Change: 17.6% | |
| TG Links: Profile News Message Board | |
| Charts:- Daily , Weekly | |
| Add TG to Watchlist: View: Get Complete TG Trend Analysis ➞ | |
 | GPRE Green Plains Inc. |
| Sector: Materials | |
| SubSector: Specialty Chemicals | |
| MarketCap: 196.357 Millions | |
| Recent Price: 20.74 Smart Investing & Trading Score: 20 | |
| Day Percent Change: 3.08% Day Change: 0.62 | |
| Week Change: -3.08% Year-to-date Change: -17.8% | |
| GPRE Links: Profile News Message Board | |
| Charts:- Daily , Weekly | |
| Add GPRE to Watchlist: View: Get Complete GPRE Trend Analysis ➞ | |
 | CSTM Constellium SE |
| Sector: Materials | |
| SubSector: Aluminum | |
| MarketCap: 646.608 Millions | |
| Recent Price: 19.98 Smart Investing & Trading Score: 36 | |
| Day Percent Change: 1.22% Day Change: 0.24 | |
| Week Change: -3.48% Year-to-date Change: 0.1% | |
| CSTM Links: Profile News Message Board | |
| Charts:- Daily , Weekly | |
| Add CSTM to Watchlist: View: Get Complete CSTM Trend Analysis ➞ | |
 | ARCH Arch Coal, Inc. |
| Sector: Materials | |
| SubSector: Industrial Metals & Minerals | |
| MarketCap: 547.21 Millions | |
| Recent Price: 158.39 Smart Investing & Trading Score: 32 | |
| Day Percent Change: 0.98% Day Change: 1.53 | |
| Week Change: -3.67% Year-to-date Change: -4.6% | |
| ARCH Links: Profile News Message Board | |
| Charts:- Daily , Weekly | |
| Add ARCH to Watchlist: View: Get Complete ARCH Trend Analysis ➞ | |
 | FF FutureFuel Corp. |
| Sector: Materials | |
| SubSector: Chemicals - Major Diversified | |
| MarketCap: 450.736 Millions | |
| Recent Price: 5.34 Smart Investing & Trading Score: 10 | |
| Day Percent Change: 0.56% Day Change: 0.03 | |
| Week Change: -3.96% Year-to-date Change: -12.2% | |
| FF Links: Profile News Message Board | |
| Charts:- Daily , Weekly | |
| Add FF to Watchlist: View: Get Complete FF Trend Analysis ➞ | |
 | CEIX CONSOL Energy Inc. |
| Sector: Materials | |
| SubSector: Industrial Metals & Minerals | |
| MarketCap: 196.81 Millions | |
| Recent Price: 82.20 Smart Investing & Trading Score: 17 | |
| Day Percent Change: 0.96% Day Change: 0.78 | |
| Week Change: -4.12% Year-to-date Change: -18.2% | |
| CEIX Links: Profile News Message Board | |
| Charts:- Daily , Weekly | |
| Add CEIX to Watchlist: View: Get Complete CEIX Trend Analysis ➞ | |
| For tabular summary view of above stock list: Summary View ➞ 0 - 25 , 25 - 50 , 50 - 75 | ||
| Click To Change The Sort Order: By Market Cap or Company Size Performance: Year-to-date, Week and Day | |
| Select Chart Type: | ||
| Too many stocks? View smallcap stocks filtered by marketcap & sector |
| Marketcap: All SmallCap Stocks (default-no microcap), Large, Mid-Range, Small & MicroCap |
| Sector: Tech, Finance, Energy, Staples, Retail, Industrial, Materials, Utilities & Medical |
|
Best Stocks Today 12Stocks.com |
© 2024 12Stocks.com Terms & Conditions Privacy Contact Us
All Information Provided Only For Education And Not To Be Used For Investing or Trading. See Terms & Conditions


One More Thing ... Get Best Stocks Delivered Daily!
Never Ever Miss A Move With Our Top Ten Stocks Lists
Find Best Stocks In Any Market - Bull or Bear Market
Take A Peek At Our Top Ten Stocks Lists: Daily, Weekly, Year-to-Date & Top Trends
Find Best Stocks In Any Market - Bull or Bear Market
Take A Peek At Our Top Ten Stocks Lists: Daily, Weekly, Year-to-Date & Top Trends
Smallcap Stocks With Best Up Trends [0-bearish to 100-bullish]: Emergent BioSolutions[100], Aspen Aerogels[100], Carvana Co[100], Perdoceo Education[100], Gannett Co[100], Pitney Bowes[100], Benchmark Electronics[100], Origin Materials[100], FormFactor [100], Lantheus [100], Q2 [100]
Best Smallcap Stocks Year-to-Date:
Janux [440.16%], Viking [307.09%], Longboard [273.98%], Alpine Immune[239.29%], Bakkt [187.89%], Avidity Biosciences[182.96%], Vera [170.74%], Cullinan Oncology[169.74%], Super Micro[168.25%], Arcutis Bio[166.25%], Y-mAbs [152.93%] Best Smallcap Stocks This Week:
Deciphera [73.24%], Emergent BioSolutions[71.88%], Eyenovia [49.22%], Aspen Aerogels[48.14%], P3 Health[38.51%], Carvana Co[38.18%], Cue Biopharma[37.73%], Origin Materials[36.24%], TransMedics Group[35.14%], Seres [34.55%], Enovix [32.07%] Best Smallcap Stocks Daily:
Emergent BioSolutions[70.98%], Aspen Aerogels[56.70%], Carvana Co[33.77%], Perdoceo Education[31.46%], Enovix [31.06%], Office Properties[28.00%], Gannett Co[26.97%], Sunnova Energy[25.21%], Pitney Bowes[24.70%], Pulmonx [21.50%], CommScope Holding[20.95%]