
 Login Sign Up


| |||||
 |  | ||||

| 12Stocks.com Market Intelligence |
Best SmallCap Stocks
|
| In a hurry? Small Cap Stock Lists: Performance Trends Table, Stock Charts
Sort Small Cap stocks: Daily, Weekly, Year-to-Date, Market Cap & Trends. Filter Small Cap stocks list by sector: Show all, Tech, Finance, Energy, Staples, Retail, Industrial, Materials, Utilities and HealthCare Filter Small Cap stocks list by size: All Large Medium Small and MicroCap |
| 12Stocks.com Small Cap Stocks Performances & Trends Daily | |||||||||
|
|  The overall Smart Investing & Trading Score is 70 (0-bearish to 100-bullish) which puts Small Cap index in short term neutral to bullish trend. The Smart Investing & Trading Score from previous trading session is 87 and hence a deterioration of trend.
| ||||||||
Here are the Smart Investing & Trading Scores of the most requested small cap stocks at 12Stocks.com (click stock name for detailed review):
|


| 12Stocks.com: Investing in Smallcap Index with Stocks | |
|
The following table helps investors and traders sort through current performance and trends (as measured by Smart Investing & Trading Score) of various
stocks in the Smallcap Index. Quick View: Move mouse or cursor over stock symbol (ticker) to view short-term technical chart and over stock name to view long term chart. Click on  to add stock symbol to your watchlist and to add stock symbol to your watchlist and  to view watchlist. Click on any ticker or stock name for detailed market intelligence report for that stock. to view watchlist. Click on any ticker or stock name for detailed market intelligence report for that stock. |
12Stocks.com Performance of Stocks in Smallcap Index
| Ticker | Stock Name | Watchlist | Category | Recent Price | Smart Investing & Trading Score | Change % | Weekly Change% |
| OFLX | Omega Flex |   | Industrials | 66.40 | 33 | -0.90% | -0.88% |
| PSN | Parsons | | Industrials | 77.67 | 8 | -0.74% | -1.02% |
| OSIS | OSI Systems | | Industrials | 134.15 | 43 | -0.53% | -1.04% |
| LICY | Li-Cycle | | Industrials | 0.69 | 46 | 4.55% | -1.15% |
| NX | Quanex Building | | Industrials | 34.38 | 53 | -0.91% | -1.16% |
| BBCP | Concrete Pumping | | Industrials | 6.69 | 32 | 0.90% | -1.18% |
| CVCO | Cavco Industries | | Industrials | 372.53 | 35 | -1.60% | -1.26% |
| RYI | Ryerson Holding | | Industrials | 22.55 | 10 | 0.20% | -1.29% |
| RYI | Ryerson Holding | | Industrials | 9.45 | 10 | 0.64% | -1.29% |
| SPCE | Virgin Galactic | | Industrials | 0.94 | 42 | -7.41% | -1.35% |
| BV | BrightView | | Industrials | 12.48 | 88 | -0.36% | -1.46% |
| LEGH | Legacy Housing | | Industrials | 20.96 | 52 | -0.99% | -1.46% |
| AAON | AAON | | Industrials | 77.18 | 0 | -1.63% | -1.56% |
| FLR | Fluor | | Industrials | 38.29 | 26 | -0.57% | -1.57% |
| BCC | Boise Cascade | | Industrials | 133.81 | 25 | 2.40% | -1.65% |
| MTW | Manitowoc | | Industrials | 12.22 | 10 | -3.25% | -1.69% |
| POWL | Powell Industries | | Industrials | 157.24 | 37 | -0.33% | -1.69% |
| ERII | Energy Recovery | | Industrials | 13.39 | 60 | -3.46% | -1.83% |
| EAF | GrafTech | | Industrials | 1.77 | 68 | 0.28% | -1.93% |
| SSD | Simpson | | Industrials | 177.47 | 17 | -1.44% | -1.98% |
| ULCC | Frontier Group | | Industrials | 5.80 | 35 | -3.33% | -2.03% |
| GMS | GMS | | Industrials | 93.22 | 48 | -1.32% | -2.21% |
| SLDP | Solid Power | | Industrials | 1.76 | 73 | -1.40% | -2.22% |
| MEG | Montrose Environmental | | Industrials | 43.41 | 93 | -8.73% | -2.46% |
| BECN | Beacon Roofing | | Industrials | 93.30 | 26 | -0.60% | -2.70% |
| For chart view version of above stock list: Chart View ➞ 0 - 25 , 25 - 50 , 50 - 75 , 75 - 100 , 100 - 125 , 125 - 150 , 150 - 175 | ||
 | Click To Change The Sort Order: By Market Cap or Company Size Performance: Year-to-date, Week and Day |  |
| Too many stocks? View smallcap stocks filtered by marketcap & sector |
| Marketcap: All SmallCap Stocks (default-no microcap), Large, Mid-Range, Small |
| Smallcap Sector: Tech, Finance, Energy, Staples, Retail, Industrial, Materials, & Medical |
|
Get the most comprehensive stock market coverage daily at 12Stocks.com ➞ Best Stocks Today ➞ Best Stocks Weekly ➞ Best Stocks Year-to-Date ➞ Best Stocks Trends ➞  Best Stocks Today 12Stocks.com Best Nasdaq Stocks ➞ Best S&P 500 Stocks ➞ Best Tech Stocks ➞ Best Biotech Stocks ➞ |
| Detailed Overview of SmallCap Stocks |
| SmallCap Technical Overview, Leaders & Laggards, Top SmallCap ETF Funds & Detailed SmallCap Stocks List, Charts, Trends & More |
| Smallcap: Technical Analysis, Trends & YTD Performance | |
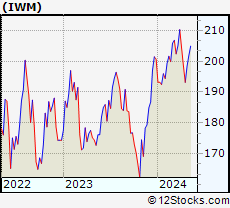
| SmallCap segment as represented by
IWM, an exchange-traded fund [ETF], holds basket of thousands of smallcap stocks from across all major sectors of the US stock market. The smallcap index (contains stocks like Riverbed & Sotheby's) is up by 1.47% and is currently underperforming the overall market by -6.62% year-to-date. Below is a quick view of technical charts and trends: | |
 IWM Weekly Chart |
|
| Long Term Trend: Deteriorating | |
| Medium Term Trend: Very Good | |
 IWM Daily Chart |
|
| Short Term Trend: Good | |
| Overall Trend Score: 70 | |
| YTD Performance: 1.47% | |
| **Trend Scores & Views Are Only For Educational Purposes And Not For Investing | |
| 12Stocks.com: Top Performing Small Cap Index Stocks | ||||||||||||||||||||||||||||||||||||||||||||||||
 The top performing Small Cap Index stocks year to date are
Now, more recently, over last week, the top performing Small Cap Index stocks on the move are


|
||||||||||||||||||||||||||||||||||||||||||||||||
| 12Stocks.com: Investing in Smallcap Index using Exchange Traded Funds | |
|
The following table shows list of key exchange traded funds (ETF) that
help investors track Smallcap index. The following list also includes leveraged ETF funds that track twice or thrice the daily returns of Smallcap indices. Short or inverse ETF funds move in the opposite direction to the index they track and are useful during market pullbacks or during bear markets. Quick View: Move mouse or cursor over ETF symbol (ticker) to view short-term technical chart and over ETF name to view long term chart. Click on ticker or stock name for detailed view. Click on to add stock symbol to your watchlist and to view watchlist. |
12Stocks.com List of ETFs that track Smallcap Index
| Ticker | ETF Name | Watchlist | Recent Price | Smart Investing & Trading Score | Change % | Week % | Year-to-date % |
| IWM | iShares Russell 2000 | | 203.67 | 70 | -0.63 | 0.88 | 1.47% |
| IJR | iShares Core S&P Small-Cap | | 107.77 | 58 | -0.79 | 0.59 | -0.45% |
| VTWO | Vanguard Russell 2000 ETF | | 82.27 | 57 | -0.69 | 0.81 | 1.44% |
| IWN | iShares Russell 2000 Value | | 154.59 | 76 | -0.67 | 0.24 | -0.48% |
| IWO | iShares Russell 2000 Growth | | 260.15 | 57 | -0.82 | 1.28 | 3.15% |
| IJS | iShares S&P Small-Cap 600 Value | | 99.06 | 40 | -0.62 | 0.34 | -3.89% |
| IJT | iShares S&P Small-Cap 600 Growth | | 128.54 | 71 | -1.00 | 0.61 | 2.72% |
| XSLV | PowerShares S&P SmallCap Low Volatil ETF | | 43.77 | 95 | -0.52 | 1.27 | -0.86% |
| SDD | ProShares UltraShort SmallCap600 | | 18.66 | 17 | 2.43 | -0.98 | 1.27% |
| SMLV | SPDR SSGA US Small Cap Low Volatil ETF | | 109.87 | 93 | -0.55 | 0.17 | -2.36% |
| SBB | ProShares Short SmallCap600 | | 16.11 | 7 | 0.91 | -0.28 | 1.16% |
| SAA | ProShares Ultra SmallCap600 | | 24.21 | 88 | -0.75 | 2.62 | -2.98% |
| 12Stocks.com: Charts, Trends, Fundamental Data and Performances of SmallCap Stocks | |
|
We now take in-depth look at all SmallCap stocks including charts, multi-period performances and overall trends (as measured by Smart Investing & Trading Score). One can sort SmallCap stocks (click link to choose) by Daily, Weekly and by Year-to-Date performances. Also, one can sort by size of the company or by market capitalization. |
| Select Your Default Chart Type: | |||||
| |||||
| Click on stock symbol or name for detailed view. Click on to add stock symbol to your watchlist and to view watchlist. Quick View: Move mouse or cursor over "Daily" to quickly view daily technical stock chart and over "Weekly" to view weekly technical stock chart. | |||||

 | OFLX Omega Flex, Inc. |
| Sector: Industrials | |
| SubSector: Industrial Equipment & Components | |
| MarketCap: 590.609 Millions | |
| Recent Price: 66.40 Smart Investing & Trading Score: 33 | |
| Day Percent Change: -0.90% Day Change: -0.60 | |
| Week Change: -0.88% Year-to-date Change: -5.8% | |
| OFLX Links: Profile News Message Board | |
| Charts:- Daily , Weekly | |
| Add OFLX to Watchlist: View: Get Complete OFLX Trend Analysis ➞ | |
 | PSN Parsons Corporation |
| Sector: Industrials | |
| SubSector: Diversified Machinery | |
| MarketCap: 3021.16 Millions | |
| Recent Price: 77.67 Smart Investing & Trading Score: 8 | |
| Day Percent Change: -0.74% Day Change: -0.58 | |
| Week Change: -1.02% Year-to-date Change: 23.9% | |
| PSN Links: Profile News Message Board | |
| Charts:- Daily , Weekly | |
| Add PSN to Watchlist: View: Get Complete PSN Trend Analysis ➞ | |
 | OSIS OSI Systems, Inc. |
| Sector: Industrials | |
| SubSector: Industrial Electrical Equipment | |
| MarketCap: 1100.39 Millions | |
| Recent Price: 134.15 Smart Investing & Trading Score: 43 | |
| Day Percent Change: -0.53% Day Change: -0.71 | |
| Week Change: -1.04% Year-to-date Change: 4.0% | |
| OSIS Links: Profile News Message Board | |
| Charts:- Daily , Weekly | |
| Add OSIS to Watchlist: View: Get Complete OSIS Trend Analysis ➞ | |
 | LICY Li-Cycle Holdings Corp. |
| Sector: Industrials | |
| SubSector: Waste Management | |
| MarketCap: 959 Millions | |
| Recent Price: 0.69 Smart Investing & Trading Score: 46 | |
| Day Percent Change: 4.55% Day Change: 0.03 | |
| Week Change: -1.15% Year-to-date Change: 10.8% | |
| LICY Links: Profile News Message Board | |
| Charts:- Daily , Weekly | |
| Add LICY to Watchlist: View: Get Complete LICY Trend Analysis ➞ | |
 | NX Quanex Building Products Corporation |
| Sector: Industrials | |
| SubSector: General Building Materials | |
| MarketCap: 315.453 Millions | |
| Recent Price: 34.38 Smart Investing & Trading Score: 53 | |
| Day Percent Change: -0.91% Day Change: -0.31 | |
| Week Change: -1.16% Year-to-date Change: 12.5% | |
| NX Links: Profile News Message Board | |
| Charts:- Daily , Weekly | |
| Add NX to Watchlist: View: Get Complete NX Trend Analysis ➞ | |
 | BBCP Concrete Pumping Holdings, Inc. |
| Sector: Industrials | |
| SubSector: General Building Materials | |
| MarketCap: 263.653 Millions | |
| Recent Price: 6.69 Smart Investing & Trading Score: 32 | |
| Day Percent Change: 0.90% Day Change: 0.06 | |
| Week Change: -1.18% Year-to-date Change: -18.4% | |
| BBCP Links: Profile News Message Board | |
| Charts:- Daily , Weekly | |
| Add BBCP to Watchlist: View: Get Complete BBCP Trend Analysis ➞ | |
 | CVCO Cavco Industries, Inc. |
| Sector: Industrials | |
| SubSector: Residential Construction | |
| MarketCap: 1375.86 Millions | |
| Recent Price: 372.53 Smart Investing & Trading Score: 35 | |
| Day Percent Change: -1.60% Day Change: -6.07 | |
| Week Change: -1.26% Year-to-date Change: 7.5% | |
| CVCO Links: Profile News Message Board | |
| Charts:- Daily , Weekly | |
| Add CVCO to Watchlist: View: Get Complete CVCO Trend Analysis ➞ | |
 | RYI Ryerson Holding Corporation |
| Sector: Industrials | |
| SubSector: Metal Fabrication | |
| MarketCap: 202.55 Millions | |
| Recent Price: 22.55 Smart Investing & Trading Score: 10 | |
| Day Percent Change: 0.20% Day Change: 0.05 | |
| Week Change: -1.29% Year-to-date Change: -35.0% | |
| RYI Links: Profile News Message Board | |
| Charts:- Daily , Weekly | |
| Add RYI to Watchlist: View: Get Complete RYI Trend Analysis ➞ | |
| RYI Ryerson Holding Corporation |
| Sector: Industrials | |
| SubSector: Metal Fabrication | |
| MarketCap: 202.55 Millions | |
| Recent Price: 9.45 Smart Investing & Trading Score: 10 | |
| Day Percent Change: 0.64% Day Change: 0.06 | |
| Week Change: -1.29% Year-to-date Change: -35.0% | |
| RYI Links: Profile News Message Board | |
| Charts:- Daily , Weekly | |
| Add RYI to Watchlist: View: Get Complete RYI Trend Analysis ➞ | |
 | SPCE Virgin Galactic Holdings, Inc. |
| Sector: Industrials | |
| SubSector: Conglomerates | |
| MarketCap: 2612.48 Millions | |
| Recent Price: 0.94 Smart Investing & Trading Score: 42 | |
| Day Percent Change: -7.41% Day Change: -0.07 | |
| Week Change: -1.35% Year-to-date Change: -61.8% | |
| SPCE Links: Profile News Message Board | |
| Charts:- Daily , Weekly | |
| Add SPCE to Watchlist: View: Get Complete SPCE Trend Analysis ➞ | |
 | BV BrightView Holdings, Inc. |
| Sector: Industrials | |
| SubSector: General Contractors | |
| MarketCap: 973.763 Millions | |
| Recent Price: 12.48 Smart Investing & Trading Score: 88 | |
| Day Percent Change: -0.36% Day Change: -0.04 | |
| Week Change: -1.46% Year-to-date Change: 48.2% | |
| BV Links: Profile News Message Board | |
| Charts:- Daily , Weekly | |
| Add BV to Watchlist: View: Get Complete BV Trend Analysis ➞ | |
 | LEGH Legacy Housing Corporation |
| Sector: Industrials | |
| SubSector: Residential Construction | |
| MarketCap: 298.006 Millions | |
| Recent Price: 20.96 Smart Investing & Trading Score: 52 | |
| Day Percent Change: -0.99% Day Change: -0.21 | |
| Week Change: -1.46% Year-to-date Change: -16.9% | |
| LEGH Links: Profile News Message Board | |
| Charts:- Daily , Weekly | |
| Add LEGH to Watchlist: View: Get Complete LEGH Trend Analysis ➞ | |
 | AAON AAON, Inc. |
| Sector: Industrials | |
| SubSector: General Building Materials | |
| MarketCap: 2533.63 Millions | |
| Recent Price: 77.18 Smart Investing & Trading Score: 0 | |
| Day Percent Change: -1.63% Day Change: -1.28 | |
| Week Change: -1.56% Year-to-date Change: 4.5% | |
| AAON Links: Profile News Message Board | |
| Charts:- Daily , Weekly | |
| Add AAON to Watchlist: View: Get Complete AAON Trend Analysis ➞ | |
 | FLR Fluor Corporation |
| Sector: Industrials | |
| SubSector: Heavy Construction | |
| MarketCap: 891.495 Millions | |
| Recent Price: 38.29 Smart Investing & Trading Score: 26 | |
| Day Percent Change: -0.57% Day Change: -0.22 | |
| Week Change: -1.57% Year-to-date Change: -2.3% | |
| FLR Links: Profile News Message Board | |
| Charts:- Daily , Weekly | |
| Add FLR to Watchlist: View: Get Complete FLR Trend Analysis ➞ | |
 | BCC Boise Cascade Company |
| Sector: Industrials | |
| SubSector: Lumber, Wood Production | |
| MarketCap: 963.938 Millions | |
| Recent Price: 133.81 Smart Investing & Trading Score: 25 | |
| Day Percent Change: 2.40% Day Change: 3.14 | |
| Week Change: -1.65% Year-to-date Change: 3.4% | |
| BCC Links: Profile News Message Board | |
| Charts:- Daily , Weekly | |
| Add BCC to Watchlist: View: Get Complete BCC Trend Analysis ➞ | |
 | MTW The Manitowoc Company, Inc. |
| Sector: Industrials | |
| SubSector: Farm & Construction Machinery | |
| MarketCap: 373.707 Millions | |
| Recent Price: 12.22 Smart Investing & Trading Score: 10 | |
| Day Percent Change: -3.25% Day Change: -0.41 | |
| Week Change: -1.69% Year-to-date Change: -26.8% | |
| MTW Links: Profile News Message Board | |
| Charts:- Daily , Weekly | |
| Add MTW to Watchlist: View: Get Complete MTW Trend Analysis ➞ | |
 | POWL Powell Industries, Inc. |
| Sector: Industrials | |
| SubSector: Diversified Machinery | |
| MarketCap: 257.216 Millions | |
| Recent Price: 157.24 Smart Investing & Trading Score: 37 | |
| Day Percent Change: -0.33% Day Change: -0.52 | |
| Week Change: -1.69% Year-to-date Change: 77.9% | |
| POWL Links: Profile News Message Board | |
| Charts:- Daily , Weekly | |
| Add POWL to Watchlist: View: Get Complete POWL Trend Analysis ➞ | |
 | ERII Energy Recovery, Inc. |
| Sector: Industrials | |
| SubSector: Pollution & Treatment Controls | |
| MarketCap: 429.375 Millions | |
| Recent Price: 13.39 Smart Investing & Trading Score: 60 | |
| Day Percent Change: -3.46% Day Change: -0.48 | |
| Week Change: -1.83% Year-to-date Change: -28.9% | |
| ERII Links: Profile News Message Board | |
| Charts:- Daily , Weekly | |
| Add ERII to Watchlist: View: Get Complete ERII Trend Analysis ➞ | |
 | EAF GrafTech International Ltd. |
| Sector: Industrials | |
| SubSector: Diversified Machinery | |
| MarketCap: 2084.36 Millions | |
| Recent Price: 1.77 Smart Investing & Trading Score: 68 | |
| Day Percent Change: 0.28% Day Change: 0.00 | |
| Week Change: -1.93% Year-to-date Change: -19.0% | |
| EAF Links: Profile News Message Board | |
| Charts:- Daily , Weekly | |
| Add EAF to Watchlist: View: Get Complete EAF Trend Analysis ➞ | |
 | SSD Simpson Manufacturing Co., Inc. |
| Sector: Industrials | |
| SubSector: Small Tools & Accessories | |
| MarketCap: 2850.16 Millions | |
| Recent Price: 177.47 Smart Investing & Trading Score: 17 | |
| Day Percent Change: -1.44% Day Change: -2.59 | |
| Week Change: -1.98% Year-to-date Change: -10.4% | |
| SSD Links: Profile News Message Board | |
| Charts:- Daily , Weekly | |
| Add SSD to Watchlist: View: Get Complete SSD Trend Analysis ➞ | |
 | ULCC Frontier Group Holdings, Inc. |
| Sector: Industrials | |
| SubSector: Airlines | |
| MarketCap: 2160 Millions | |
| Recent Price: 5.80 Smart Investing & Trading Score: 35 | |
| Day Percent Change: -3.33% Day Change: -0.20 | |
| Week Change: -2.03% Year-to-date Change: 6.8% | |
| ULCC Links: Profile News Message Board | |
| Charts:- Daily , Weekly | |
| Add ULCC to Watchlist: View: Get Complete ULCC Trend Analysis ➞ | |
 | GMS GMS Inc. |
| Sector: Industrials | |
| SubSector: General Building Materials | |
| MarketCap: 587.753 Millions | |
| Recent Price: 93.22 Smart Investing & Trading Score: 48 | |
| Day Percent Change: -1.32% Day Change: -1.24 | |
| Week Change: -2.21% Year-to-date Change: 13.1% | |
| GMS Links: Profile News Message Board | |
| Charts:- Daily , Weekly | |
| Add GMS to Watchlist: View: Get Complete GMS Trend Analysis ➞ | |
 | SLDP Solid Power, Inc. |
| Sector: Industrials | |
| SubSector: Electrical Equipment & Parts | |
| MarketCap: 445 Millions | |
| Recent Price: 1.76 Smart Investing & Trading Score: 73 | |
| Day Percent Change: -1.40% Day Change: -0.03 | |
| Week Change: -2.22% Year-to-date Change: 23.9% | |
| SLDP Links: Profile News Message Board | |
| Charts:- Daily , Weekly | |
| Add SLDP to Watchlist: View: Get Complete SLDP Trend Analysis ➞ | |
 | MEG Montrose Environmental Group, Inc. |
| Sector: Industrials | |
| SubSector: Waste Management | |
| MarketCap: 71627 Millions | |
| Recent Price: 43.41 Smart Investing & Trading Score: 93 | |
| Day Percent Change: -8.73% Day Change: -4.16 | |
| Week Change: -2.46% Year-to-date Change: 35.0% | |
| MEG Links: Profile News Message Board | |
| Charts:- Daily , Weekly | |
| Add MEG to Watchlist: View: Get Complete MEG Trend Analysis ➞ | |
 | BECN Beacon Roofing Supply, Inc. |
| Sector: Industrials | |
| SubSector: General Building Materials | |
| MarketCap: 1210.13 Millions | |
| Recent Price: 93.30 Smart Investing & Trading Score: 26 | |
| Day Percent Change: -0.60% Day Change: -0.56 | |
| Week Change: -2.7% Year-to-date Change: 7.2% | |
| BECN Links: Profile News Message Board | |
| Charts:- Daily , Weekly | |
| Add BECN to Watchlist: View: Get Complete BECN Trend Analysis ➞ | |
| For tabular summary view of above stock list: Summary View ➞ 0 - 25 , 25 - 50 , 50 - 75 , 75 - 100 , 100 - 125 , 125 - 150 , 150 - 175 | ||
| Click To Change The Sort Order: By Market Cap or Company Size Performance: Year-to-date, Week and Day | |
| Select Chart Type: | ||
| Too many stocks? View smallcap stocks filtered by marketcap & sector |
| Marketcap: All SmallCap Stocks (default-no microcap), Large, Mid-Range, Small & MicroCap |
| Sector: Tech, Finance, Energy, Staples, Retail, Industrial, Materials, Utilities & Medical |
|
Best Stocks Today 12Stocks.com |
© 2024 12Stocks.com Terms & Conditions Privacy Contact Us
All Information Provided Only For Education And Not To Be Used For Investing or Trading. See Terms & Conditions


One More Thing ... Get Best Stocks Delivered Daily!
Never Ever Miss A Move With Our Top Ten Stocks Lists
Find Best Stocks In Any Market - Bull or Bear Market
Take A Peek At Our Top Ten Stocks Lists: Daily, Weekly, Year-to-Date & Top Trends
Find Best Stocks In Any Market - Bull or Bear Market
Take A Peek At Our Top Ten Stocks Lists: Daily, Weekly, Year-to-Date & Top Trends
Smallcap Stocks With Best Up Trends [0-bearish to 100-bullish]: Alpha and[100], Myriad Genetics[100], Hyster-Yale Materials[100], Pacira BioSciences[100], Hannon Armstrong[100], Orthofix Medical[100], Inogen [100], Ardmore Shipping[100], Wolverine World[100], Emergent BioSolutions[100], Payoneer Global[100]
Best Smallcap Stocks Year-to-Date:
Janux [384.97%], Viking [319.59%], Bakkt [255.16%], Longboard [254.83%], Alpine Immune[239.47%], Super Micro[193.67%], Vera [189.15%], Avidity Biosciences[185.95%], Cullinan Oncology[179.94%], Arcutis Bio[146.28%], Sana [135.19%] Best Smallcap Stocks This Week:
Perficient [52.68%], DASAN Zhone[40.85%], Innodata [37.95%], Thoughtworks Holding[37.33%], Design [32.5%], Cricut [30.45%], Latham Group[30.4%], Great Lakes[30.24%], Vigil Neuroscience[29.78%], Sterling Construction[25.77%], Outset Medical[25.72%] Best Smallcap Stocks Daily:
Innodata [37.54%], Cricut [35.17%], Veritone [25.41%], Ameresco [22.19%], PowerSchool [21.21%], Alpha and[19.97%], Myriad Genetics[19.26%], Latham Group[19.06%], Hyster-Yale Materials[18.10%], Denali [15.16%], Adaptive Bio[14.15%]