
 Login Sign Up


| |||||
 |  | ||||

| 12Stocks.com Market Intelligence |
Best SmallCap Stocks
|
| In a hurry? Small Cap Stock Lists: Performance Trends Table, Stock Charts
Sort Small Cap stocks: Daily, Weekly, Year-to-Date, Market Cap & Trends. Filter Small Cap stocks list by sector: Show all, Tech, Finance, Energy, Staples, Retail, Industrial, Materials, Utilities and HealthCare Filter Small Cap stocks list by size: All Large Medium Small and MicroCap |
| 12Stocks.com Small Cap Stocks Performances & Trends Daily | |||||||||
|
|  The overall Smart Investing & Trading Score is 80 (0-bearish to 100-bullish) which puts Small Cap index in short term neutral to bullish trend. The Smart Investing & Trading Score from previous trading session is 50 and an improvement of trend continues.
| ||||||||
Here are the Smart Investing & Trading Scores of the most requested small cap stocks at 12Stocks.com (click stock name for detailed review):
|


| 12Stocks.com: Investing in Smallcap Index with Stocks | |
|
The following table helps investors and traders sort through current performance and trends (as measured by Smart Investing & Trading Score) of various
stocks in the Smallcap Index. Quick View: Move mouse or cursor over stock symbol (ticker) to view short-term technical chart and over stock name to view long term chart. Click on  to add stock symbol to your watchlist and to add stock symbol to your watchlist and  to view watchlist. Click on any ticker or stock name for detailed market intelligence report for that stock. to view watchlist. Click on any ticker or stock name for detailed market intelligence report for that stock. |
12Stocks.com Performance of Stocks in Smallcap Index
| Ticker | Stock Name | Watchlist | Category | Recent Price | Smart Investing & Trading Score | Change % | YTD Change% |
| AMWD | American Woodmark |   | Services & Goods | 67.61 | 50 | -2.35% | -14.16% |
| SPRY | ARS | | Health Care | 9.57 | 10 | 1.70% | -10.64% |
| DHC | Diversified Healthcare | | Financials | 4.41 | 60 | 0.92% | 96.61% |
| ITCI | Intra-Cellular Therapies | | Health Care | 131.87 | 50 | -0.04% | 56.54% |
| CBL | CBL& Associates | | Financials | 31.11 | 30 | -0.19% | 10.50% |
| IIIV | i3 Verticals | | Technology | 30.50 | 40 | -1.83% | 30.96% |
| XPEL | XPEL | | Services & Goods | 33.29 | 10 | -0.24% | -14.58% |
| VTS | Vitesse Energy | | Energy | 24.41 | 68 | 1.20% | 5.75% |
| CSWI | CSW Industrials | | Industrials | 305.10 | 20 | 0.14% | -13.07% |
| KRUS | Kura Sushi | | Services & Goods | 76.18 | 0 | -0.13% | -20.46% |
| SCSC | Scansource | | Technology | 43.94 | 40 | -2.51% | -6.57% |
| TREE | LendingTree | | Financials | 75.77 | 90 | 2.84% | 95.08% |
| MSEX | Middlesex Water | | Utilities | 52.71 | 0 | 1.58% | 3.92% |
| BRKL | Brookline Bancorp | | Financials | 10.95 | 50 | -0.64% | -2.03% |
| OSBC | Old Second | | Financials | 17.91 | 20 | 0.51% | 3.18% |
| ACEL | Accel Entertainment | | Services & Goods | 10.99 | 0 | 0.64% | 3.97% |
| EYPT | EyePoint | | Health Care | 13.64 | 80 | 0.29% | 69.86% |
| SBGI | Slair | | Technology | 14.26 | 70 | 2.30% | -13.08% |
| BH | Biglari | | Services & Goods | 309.39 | 30 | -0.11% | 23.78% |
| FMBH | First Mid | | Financials | 39.23 | 30 | 0.69% | 10.46% |
| SWIM | Latham Group | | Industrials | 7.75 | 30 | 0.13% | 18.87% |
| FBRT | Franklin BSP | | Financials | 11.27 | 30 | -0.53% | -4.45% |
| LICY | Li-Cycle | | Industrials | 0.84 | 20 | -4.06% | -64.42% |
| EVA | Enviva Partners | | Industrials | 0.42 | 60 | 2.22% | 0.00% |
| MRTN | Marten Transport | | Industrials | 11.23 | 10 | -3.19% | -26.47% |
| For chart view version of above stock list: Chart View ➞ 0 - 25 , 25 - 50 , 50 - 75 , 75 - 100 , 100 - 125 , 125 - 150 , 150 - 175 , 175 - 200 , 200 - 225 , 225 - 250 , 250 - 275 , 275 - 300 , 300 - 325 | ||
 | Click To Change The Sort Order: By Market Cap or Company Size Performance: Year-to-date, Week and Day |  |
| Too many stocks? View smallcap stocks filtered by marketcap & sector |
| Marketcap: All SmallCap Stocks (default-no microcap), Large, Mid-Range, Small |
| Smallcap Sector: Tech, Finance, Energy, Staples, Retail, Industrial, Materials, & Medical |
|
Get the most comprehensive stock market coverage daily at 12Stocks.com ➞ Best Stocks Today ➞ Best Stocks Weekly ➞ Best Stocks Year-to-Date ➞ Best Stocks Trends ➞  Best Stocks Today 12Stocks.com Best Nasdaq Stocks ➞ Best S&P 500 Stocks ➞ Best Tech Stocks ➞ Best Biotech Stocks ➞ |
| Detailed Overview of SmallCap Stocks |
| SmallCap Technical Overview, Leaders & Laggards, Top SmallCap ETF Funds & Detailed SmallCap Stocks List, Charts, Trends & More |
| Smallcap: Technical Analysis, Trends & YTD Performance | |
| SmallCap segment as represented by
IWM, an exchange-traded fund [ETF], holds basket of thousands of smallcap stocks from across all major sectors of the US stock market. The smallcap index (contains stocks like Riverbed & Sotheby's) is up by 8.58223% and is currently underperforming the overall market by -4.56457% year-to-date. Below is a quick view of technical charts and trends: | |
 IWM Weekly Chart |
|
| Long Term Trend: Very Good | |
| Medium Term Trend: Good | |
 IWM Daily Chart |
|
| Short Term Trend: Good | |
| Overall Trend Score: 80 | |
| YTD Performance: 8.58223% | |
| **Trend Scores & Views Are Only For Educational Purposes And Not For Investing | |
| 12Stocks.com: Top Performing Small Cap Index Stocks | ||||||||||||||||||||||||||||||||||||||||||||||||
 The top performing Small Cap Index stocks year to date are
Now, more recently, over last week, the top performing Small Cap Index stocks on the move are


|
||||||||||||||||||||||||||||||||||||||||||||||||
| 12Stocks.com: Investing in Smallcap Index using Exchange Traded Funds | |
|
The following table shows list of key exchange traded funds (ETF) that
help investors track Smallcap index. The following list also includes leveraged ETF funds that track twice or thrice the daily returns of Smallcap indices. Short or inverse ETF funds move in the opposite direction to the index they track and are useful during market pullbacks or during bear markets. Quick View: Move mouse or cursor over ETF symbol (ticker) to view short-term technical chart and over ETF name to view long term chart. Click on ticker or stock name for detailed view. Click on to add stock symbol to your watchlist and to view watchlist. |
12Stocks.com List of ETFs that track Smallcap Index
| Ticker | ETF Name | Watchlist | Recent Price | Smart Investing & Trading Score | Change % | Week % | Year-to-date % |
| IWM | iShares Russell 2000 ETF | | 238.92 | 80 | 0.268592 | 0.873971 | 8.58223% |
| IJR | iShares Core S&P Small-Cap ETF | | 117.95 | 30 | -0.025428 | 0.0339242 | 3.2819% |
| VTWO | Vanguard Russell 2000 Index ETF | | 96.93 | 80 | 0.248216 | 1.16898 | 9.0639% |
| IWN | iShares Russell 2000 Value ETF | | 175.07 | 50 | 0.0457169 | 0.206056 | 7.63206% |
| IWO | iShares Russell 2000 Growth ETF | | 315.01 | 80 | 0.283331 | 1.34805 | 9.36063% |
| IJS | iShares S&P Small-Cap 600 Value ETF | | 109.96 | 50 | 0.0728067 | 0.10925 | 2.50291% |
| IJT | iShares S&P Small-Cap 600 Growth ETF | | 140.39 | 30 | -0.0356024 | 0.0641483 | 3.99182% |
| XSLV | Invesco S&P SmallCap Low Volatility ETF | | 46.84 | 30 | 0.0168688 | -1.11885 | 0.602455% |
| SAA | ProShares Ultra SmallCap600 2x Shares | | 25.41 | 50 | -0.0220337 | 0.913423 | -1.51659% |
| SBB | ProShares Short SmallCap600 -1x Shares | | 14.05 | 50 | 0.0698006 | -0.473202 | -2.76282% |
| SMLV | SPDR SSGA US Small Cap Low Volatility Index ETF | | 132.22 | 70 | 0.731373 | 0.254769 | 6.04408% |
| SDD | ProShares UltraShort SmallCap600 -2x Shares | | 13.45 | 50 | 0.114649 | 0.694122 | -11.0908% |
| 12Stocks.com: Charts, Trends, Fundamental Data and Performances of SmallCap Stocks | |
|
We now take in-depth look at all SmallCap stocks including charts, multi-period performances and overall trends (as measured by Smart Investing & Trading Score). One can sort SmallCap stocks (click link to choose) by Daily, Weekly and by Year-to-Date performances. Also, one can sort by size of the company or by market capitalization. |
| Select Your Default Chart Type: | |||||
| |||||
| Click on stock symbol or name for detailed view. Click on to add stock symbol to your watchlist and to view watchlist. Quick View: Move mouse or cursor over "Daily" to quickly view daily technical stock chart and over "Weekly" to view weekly technical stock chart. | |||||

 | AMWD American Woodmark Corp |
| Sector: Services & Goods | |
| SubSector: Furnishings, Fixtures & Appliances | |
| MarketCap: 997.1 Millions | |
| Recent Price: 67.61 Smart Investing & Trading Score: 50 | |
| Day Percent Change: -2.35413% Day Change: 0.01 | |
| Week Change: 4.32032% Year-to-date Change: -14.2% | |
| AMWD Links: Profile News Message Board | |
| Charts:- Daily , Weekly | |
| Add AMWD to Watchlist: View: Get Complete AMWD Trend Analysis ➞ | |
 | SPRY ARS Pharmaceuticals Inc |
| Sector: Health Care | |
| SubSector: Biotechnology | |
| MarketCap: 995.18 Millions | |
| Recent Price: 9.57 Smart Investing & Trading Score: 10 | |
| Day Percent Change: 1.70032% Day Change: 0.27 | |
| Week Change: -7.26744% Year-to-date Change: -10.6% | |
| SPRY Links: Profile News Message Board | |
| Charts:- Daily , Weekly | |
| Add SPRY to Watchlist: View: Get Complete SPRY Trend Analysis ➞ | |
 | DHC Diversified Healthcare Trust |
| Sector: Financials | |
| SubSector: REIT - Healthcare Facilities | |
| MarketCap: 994.63 Millions | |
| Recent Price: 4.41 Smart Investing & Trading Score: 60 | |
| Day Percent Change: 0.915332% Day Change: 0 | |
| Week Change: 3.03738% Year-to-date Change: 96.6% | |
| DHC Links: Profile News Message Board | |
| Charts:- Daily , Weekly | |
| Add DHC to Watchlist: View: Get Complete DHC Trend Analysis ➞ | |
 | ITCI Intra-Cellular Therapies, Inc. |
| Sector: Health Care | |
| SubSector: Biotechnology | |
| MarketCap: 991.885 Millions | |
| Recent Price: 131.87 Smart Investing & Trading Score: 50 | |
| Day Percent Change: -0.0379018% Day Change: -9999 | |
| Week Change: 0.129081% Year-to-date Change: 56.5% | |
| ITCI Links: Profile News Message Board | |
| Charts:- Daily , Weekly | |
| Add ITCI to Watchlist: View: Get Complete ITCI Trend Analysis ➞ | |
 | CBL CBL& Associates Properties, Inc |
| Sector: Financials | |
| SubSector: REIT - Retail | |
| MarketCap: 989.86 Millions | |
| Recent Price: 31.11 Smart Investing & Trading Score: 30 | |
| Day Percent Change: -0.192493% Day Change: -0.34 | |
| Week Change: -2.81162% Year-to-date Change: 10.5% | |
| CBL Links: Profile News Message Board | |
| Charts:- Daily , Weekly | |
| Add CBL to Watchlist: View: Get Complete CBL Trend Analysis ➞ | |
 | IIIV i3 Verticals Inc |
| Sector: Technology | |
| SubSector: Software - Infrastructure | |
| MarketCap: 988.96 Millions | |
| Recent Price: 30.50 Smart Investing & Trading Score: 40 | |
| Day Percent Change: -1.83457% Day Change: -0.29 | |
| Week Change: -1.73969% Year-to-date Change: 31.0% | |
| IIIV Links: Profile News Message Board | |
| Charts:- Daily , Weekly | |
| Add IIIV to Watchlist: View: Get Complete IIIV Trend Analysis ➞ | |
 | XPEL XPEL Inc |
| Sector: Services & Goods | |
| SubSector: Auto Parts | |
| MarketCap: 987.36 Millions | |
| Recent Price: 33.29 Smart Investing & Trading Score: 10 | |
| Day Percent Change: -0.239736% Day Change: -0.23 | |
| Week Change: -10.5829% Year-to-date Change: -14.6% | |
| XPEL Links: Profile News Message Board | |
| Charts:- Daily , Weekly | |
| Add XPEL to Watchlist: View: Get Complete XPEL Trend Analysis ➞ | |
 | VTS Vitesse Energy Inc |
| Sector: Energy | |
| SubSector: Oil & Gas E&P | |
| MarketCap: 986.19 Millions | |
| Recent Price: 24.41 Smart Investing & Trading Score: 68 | |
| Day Percent Change: 1.2% Day Change: 0.3 | |
| Week Change: -1.71% Year-to-date Change: 5.8% | |
| VTS Links: Profile News Message Board | |
| Charts:- Daily , Weekly | |
| Add VTS to Watchlist: View: Get Complete VTS Trend Analysis ➞ | |
 | CSWI CSW Industrials, Inc. |
| Sector: Industrials | |
| SubSector: Diversified Machinery | |
| MarketCap: 985.616 Millions | |
| Recent Price: 305.10 Smart Investing & Trading Score: 20 | |
| Day Percent Change: 0.141136% Day Change: -9999 | |
| Week Change: -0.625366% Year-to-date Change: -13.1% | |
| CSWI Links: Profile News Message Board | |
| Charts:- Daily , Weekly | |
| Add CSWI to Watchlist: View: Get Complete CSWI Trend Analysis ➞ | |
 | KRUS Kura Sushi USA Inc |
| Sector: Services & Goods | |
| SubSector: Restaurants | |
| MarketCap: 985.17 Millions | |
| Recent Price: 76.18 Smart Investing & Trading Score: 0 | |
| Day Percent Change: -0.131096% Day Change: 0.5 | |
| Week Change: -4.53634% Year-to-date Change: -20.5% | |
| KRUS Links: Profile News Message Board | |
| Charts:- Daily , Weekly | |
| Add KRUS to Watchlist: View: Get Complete KRUS Trend Analysis ➞ | |
 | SCSC Scansource, Inc |
| Sector: Technology | |
| SubSector: Electronics & Computer Distribution | |
| MarketCap: 983.05 Millions | |
| Recent Price: 43.94 Smart Investing & Trading Score: 40 | |
| Day Percent Change: -2.50721% Day Change: -2.62 | |
| Week Change: 1.6659% Year-to-date Change: -6.6% | |
| SCSC Links: Profile News Message Board | |
| Charts:- Daily , Weekly | |
| Add SCSC to Watchlist: View: Get Complete SCSC Trend Analysis ➞ | |
 | TREE LendingTree Inc |
| Sector: Financials | |
| SubSector: Financial Conglomerates | |
| MarketCap: 978.06 Millions | |
| Recent Price: 75.77 Smart Investing & Trading Score: 90 | |
| Day Percent Change: 2.83659% Day Change: 0.72 | |
| Week Change: 4.42392% Year-to-date Change: 95.1% | |
| TREE Links: Profile News Message Board | |
| Charts:- Daily , Weekly | |
| Add TREE to Watchlist: View: Get Complete TREE Trend Analysis ➞ | |
 | MSEX Middlesex Water Co |
| Sector: Utilities | |
| SubSector: Utilities - Regulated Water | |
| MarketCap: 975.96 Millions | |
| Recent Price: 52.71 Smart Investing & Trading Score: 0 | |
| Day Percent Change: 1.58027% Day Change: -0.3 | |
| Week Change: -0.715766% Year-to-date Change: 3.9% | |
| MSEX Links: Profile News Message Board | |
| Charts:- Daily , Weekly | |
| Add MSEX to Watchlist: View: Get Complete MSEX Trend Analysis ➞ | |
 | BRKL Brookline Bancorp, Inc |
| Sector: Financials | |
| SubSector: Banks - Regional | |
| MarketCap: 975.7 Millions | |
| Recent Price: 10.95 Smart Investing & Trading Score: 50 | |
| Day Percent Change: -0.635209% Day Change: -0.01 | |
| Week Change: 3.10734% Year-to-date Change: -2.0% | |
| BRKL Links: Profile News Message Board | |
| Charts:- Daily , Weekly | |
| Add BRKL to Watchlist: View: Get Complete BRKL Trend Analysis ➞ | |
 | OSBC Old Second Bancorporation Inc |
| Sector: Financials | |
| SubSector: Banks - Regional | |
| MarketCap: 970.35 Millions | |
| Recent Price: 17.91 Smart Investing & Trading Score: 20 | |
| Day Percent Change: 0.50505% Day Change: 0.03 | |
| Week Change: -1.91676% Year-to-date Change: 3.2% | |
| OSBC Links: Profile News Message Board | |
| Charts:- Daily , Weekly | |
| Add OSBC to Watchlist: View: Get Complete OSBC Trend Analysis ➞ | |
 | ACEL Accel Entertainment Inc |
| Sector: Services & Goods | |
| SubSector: Gambling | |
| MarketCap: 966.85 Millions | |
| Recent Price: 10.99 Smart Investing & Trading Score: 0 | |
| Day Percent Change: 0.641026% Day Change: 0.12 | |
| Week Change: -0.990991% Year-to-date Change: 4.0% | |
| ACEL Links: Profile News Message Board | |
| Charts:- Daily , Weekly | |
| Add ACEL to Watchlist: View: Get Complete ACEL Trend Analysis ➞ | |
 | EYPT EyePoint Pharmaceuticals Inc |
| Sector: Health Care | |
| SubSector: Biotechnology | |
| MarketCap: 965.67 Millions | |
| Recent Price: 13.64 Smart Investing & Trading Score: 80 | |
| Day Percent Change: 0.294118% Day Change: 0.09 | |
| Week Change: -3.87597% Year-to-date Change: 69.9% | |
| EYPT Links: Profile News Message Board | |
| Charts:- Daily , Weekly | |
| Add EYPT to Watchlist: View: Get Complete EYPT Trend Analysis ➞ | |
 | SBGI Sinclair Inc |
| Sector: Technology | |
| SubSector: Broadcasting | |
| MarketCap: 963.91 Millions | |
| Recent Price: 14.26 Smart Investing & Trading Score: 70 | |
| Day Percent Change: 2.29555% Day Change: 0.19 | |
| Week Change: 5.47337% Year-to-date Change: -13.1% | |
| SBGI Links: Profile News Message Board | |
| Charts:- Daily , Weekly | |
| Add SBGI to Watchlist: View: Get Complete SBGI Trend Analysis ➞ | |
 | BH Biglari Holdings Inc |
| Sector: Services & Goods | |
| SubSector: Restaurants | |
| MarketCap: 962.97 Millions | |
| Recent Price: 309.39 Smart Investing & Trading Score: 30 | |
| Day Percent Change: -0.106548% Day Change: -6.43 | |
| Week Change: -0.827003% Year-to-date Change: 23.8% | |
| BH Links: Profile News Message Board | |
| Charts:- Daily , Weekly | |
| Add BH to Watchlist: View: Get Complete BH Trend Analysis ➞ | |
 | FMBH First Mid Bancshares Inc |
| Sector: Financials | |
| SubSector: Banks - Regional | |
| MarketCap: 962.77 Millions | |
| Recent Price: 39.23 Smart Investing & Trading Score: 30 | |
| Day Percent Change: 0.693018% Day Change: -0.33 | |
| Week Change: -1.3826% Year-to-date Change: 10.5% | |
| FMBH Links: Profile News Message Board | |
| Charts:- Daily , Weekly | |
| Add FMBH to Watchlist: View: Get Complete FMBH Trend Analysis ➞ | |
 | SWIM Latham Group Inc |
| Sector: Industrials | |
| SubSector: Building Products & Equipment | |
| MarketCap: 960.31 Millions | |
| Recent Price: 7.75 Smart Investing & Trading Score: 30 | |
| Day Percent Change: 0.129199% Day Change: 0.13 | |
| Week Change: -2.02276% Year-to-date Change: 18.9% | |
| SWIM Links: Profile News Message Board | |
| Charts:- Daily , Weekly | |
| Add SWIM to Watchlist: View: Get Complete SWIM Trend Analysis ➞ | |
 | FBRT Franklin BSP Realty Trust Inc |
| Sector: Financials | |
| SubSector: REIT - Mortgage | |
| MarketCap: 960.15 Millions | |
| Recent Price: 11.27 Smart Investing & Trading Score: 30 | |
| Day Percent Change: -0.529568% Day Change: -0.16 | |
| Week Change: -2.92851% Year-to-date Change: -4.5% | |
| FBRT Links: Profile News Message Board | |
| Charts:- Daily , Weekly | |
| Add FBRT to Watchlist: View: Get Complete FBRT Trend Analysis ➞ | |
 | LICY Li-Cycle Holdings Corp. |
| Sector: Industrials | |
| SubSector: Waste Management | |
| MarketCap: 959 Millions | |
| Recent Price: 0.84 Smart Investing & Trading Score: 20 | |
| Day Percent Change: -4.06143% Day Change: -9999 | |
| Week Change: -13.0619% Year-to-date Change: -64.4% | |
| LICY Links: Profile News Message Board | |
| Charts:- Daily , Weekly | |
| Add LICY to Watchlist: View: Get Complete LICY Trend Analysis ➞ | |
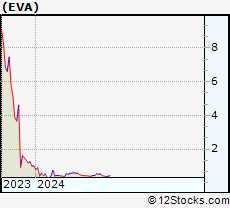 | EVA Enviva Partners, LP |
| Sector: Industrials | |
| SubSector: Lumber, Wood Production | |
| MarketCap: 957.238 Millions | |
| Recent Price: 0.42 Smart Investing & Trading Score: 60 | |
| Day Percent Change: 2.21573% Day Change: -9999 | |
| Week Change: 6.73786% Year-to-date Change: 0.0% | |
| EVA Links: Profile News Message Board | |
| Charts:- Daily , Weekly | |
| Add EVA to Watchlist: View: Get Complete EVA Trend Analysis ➞ | |
 | MRTN Marten Transport, Ltd |
| Sector: Industrials | |
| SubSector: Trucking | |
| MarketCap: 957.05 Millions | |
| Recent Price: 11.23 Smart Investing & Trading Score: 10 | |
| Day Percent Change: -3.18966% Day Change: -0.03 | |
| Week Change: -3.43938% Year-to-date Change: -26.5% | |
| MRTN Links: Profile News Message Board | |
| Charts:- Daily , Weekly | |
| Add MRTN to Watchlist: View: Get Complete MRTN Trend Analysis ➞ | |
| For tabular summary view of above stock list: Summary View ➞ 0 - 25 , 25 - 50 , 50 - 75 , 75 - 100 , 100 - 125 , 125 - 150 , 150 - 175 , 175 - 200 , 200 - 225 , 225 - 250 , 250 - 275 , 275 - 300 , 300 - 325 | ||
| Click To Change The Sort Order: By Market Cap or Company Size Performance: Year-to-date, Week and Day | |
| Select Chart Type: | ||
| Too many stocks? View smallcap stocks filtered by marketcap & sector |
| Marketcap: All SmallCap Stocks (default-no microcap), Large, Mid-Range, Small & MicroCap |
| Sector: Tech, Finance, Energy, Staples, Retail, Industrial, Materials, Utilities & Medical |
|
Best Stocks Today 12Stocks.com |
© 2025 12Stocks.com Terms & Conditions Privacy Contact Us
All Information Provided Only For Education And Not To Be Used For Investing or Trading. See Terms & Conditions


One More Thing ... Get Best Stocks Delivered Daily!
Never Ever Miss A Move With Our Top Ten Stocks Lists
Find Best Stocks In Any Market - Bull or Bear Market
Take A Peek At Our Top Ten Stocks Lists: Daily, Weekly, Year-to-Date & Top Trends
Find Best Stocks In Any Market - Bull or Bear Market
Take A Peek At Our Top Ten Stocks Lists: Daily, Weekly, Year-to-Date & Top Trends
Smallcap Stocks With Best Up Trends [0-bearish to 100-bullish]: AlloVir [100], Cara [100], Assertio [100], Fuelcell Energy[100], B. Riley[100], Bandwidth [100], P.A.M. Transportation[100], Veritone [100], Parsons Corp[100], ACM Research[100], Bloom Energy[100]
Best Smallcap Stocks Year-to-Date:
FiscalNote [323.077%], Celcuity [315.842%], Immuneering Corp[265.158%], Precigen [253.704%], OptimizeRx Corp[241.267%], Bloom Energy[240.907%], CommScope Holding[215.891%], EchoStar Corp[215.648%], Centrus Energy[210.804%], 908 Devices[198.174%], Digital Turbine[194.886%] Best Smallcap Stocks This Week:
Textainer Group[258.475%], United Community[163.439%], Lakeland Bancorp[147.684%], Office Properties[146.649%], Dominion Midstream[118.502%], PDL BioPharma[112.645%], GTx [108.706%], Overseas Shipholding[77.0318%], PGT Innovations[65.2536%], Vimeo [60.9148%], Babcock & Wilcox Enterprises[53.2338%] Best Smallcap Stocks Daily:
AlloVir [16.9215%], Cara [14.3396%], Tyra Biosciences[14.26%], Zura Bio[13.71%], Assertio [12.692%], Fuelcell Energy[12.6657%], B. Riley[11.5556%], Bandwidth [10.7143%], Waldencast [10.6742%], Scilex Holding[10.6383%], P.A.M. Transportation[10.5477%]