
 Login Sign Up


| |||||
 |  | ||||

| 12Stocks.com Market Intelligence |
Best SmallCap Stocks
|
| In a hurry? Small Cap Stock Lists: Performance Trends Table, Stock Charts
Sort Small Cap stocks: Daily, Weekly, Year-to-Date, Market Cap & Trends. Filter Small Cap stocks list by sector: Show all, Tech, Finance, Energy, Staples, Retail, Industrial, Materials, Utilities and HealthCare Filter Small Cap stocks list by size: All Large Medium Small and MicroCap |
| 12Stocks.com Small Cap Stocks Performances & Trends Daily | |||||||||
|
|  The overall Smart Investing & Trading Score is 90 (0-bearish to 100-bullish) which puts Small Cap index in short term bullish trend. The Smart Investing & Trading Score from previous trading session is 100 and a deterioration of trend continues.
| ||||||||
Here are the Smart Investing & Trading Scores of the most requested small cap stocks at 12Stocks.com (click stock name for detailed review):
|


| 12Stocks.com: Investing in Smallcap Index with Stocks | |
|
The following table helps investors and traders sort through current performance and trends (as measured by Smart Investing & Trading Score) of various
stocks in the Smallcap Index. Quick View: Move mouse or cursor over stock symbol (ticker) to view short-term technical chart and over stock name to view long term chart. Click on  to add stock symbol to your watchlist and to add stock symbol to your watchlist and  to view watchlist. Click on any ticker or stock name for detailed market intelligence report for that stock. to view watchlist. Click on any ticker or stock name for detailed market intelligence report for that stock. |
12Stocks.com Performance of Stocks in Smallcap Index
| Ticker | Stock Name | Watchlist | Category | Recent Price | Smart Investing & Trading Score | Change % | YTD Change% |
| RBOT | Vicarious Surgical |   | Health Care | 7.06 | 80 | 27.21 | -48.99% |
| FCEL | Fuelcell Energy | | Industrials | 10.21 | 100 | 17.63 | -1.54% |
| SPWH | Sportsman's Warehouse | | Services & Goods | 2.88 | 30 | 17.07 | 12.06% |
| ZURA | Zura Bio | | Health Care | 3.93 | 51 | 13.71 | -20.40% |
| BLNK | Blink Charging | | Industrials | 1.99 | 100 | 13.07 | 32.67% |
| ALXO | Alx Oncology | | Health Care | 2.15 | 100 | 12.57 | 37.82% |
| GWH | ESS Tech | | Industrials | 1.72 | 60 | 12.42 | -71.66% |
| OVID | Ovid | | Health Care | 1.84 | 100 | 12.20 | 92.07% |
| PLCE | Childrens Place | | Services & Goods | 7.17 | 90 | 12.03 | -31.39% |
| PTSI | P.A.M. Transportation | | Transports | 21.80 | 100 | 10.55 | 0.00% |
| RLYB | Rallybio Corp | | Health Care | 0.56 | 70 | 9.62 | -40.98% |
| LUNG | Pulmonx Corp | | Health Care | 1.84 | 80 | 9.17 | -71.70% |
| FEAM | 5E Advanced | | Materials | 3.98 | 54 | 8.29 | -68.95% |
| CMBM | Cambium s | | Technology | 0.90 | 60 | 6.79 | 14.29% |
| ATOM | Atomera | | Technology | 4.97 | 90 | 6.65 | -61.59% |
| IRBT | Irobot Corp | | Services & Goods | 4.22 | 80 | 5.89 | -46.86% |
| SAVA | Cassava Sciences | | Health Care | 3.63 | 100 | 5.83 | 32.00% |
| VERI | Veritone | | Technology | 5.58 | 90 | 5.48 | 74.38% |
| AGEN | Agenus | | Health Care | 4.15 | 50 | 5.38 | 34.37% |
| PRPL | Purple Innovation | | Services & Goods | 0.95 | 60 | 4.86 | 27.31% |
| EHTH | eHealth | | Financials | 4.45 | 90 | 4.71 | -50.17% |
| CLPR | Clipper Realty | | Financials | 4.01 | 70 | 4.43 | -5.17% |
| PMVP | PMV | | Health Care | 1.44 | 70 | 4.35 | -5.88% |
| SST | System1 | | Industrials | 7.95 | 70 | 4.33 | -6.69% |
| DLTH | Duluth | | Services & Goods | 4.02 | 90 | 4.28 | 37.67% |
| For chart view version of above stock list: Chart View ➞ 0 - 25 , 25 - 50 , 50 - 75 , 75 - 100 , 100 - 125 , 125 - 150 | ||
 | Click To Change The Sort Order: By Market Cap or Company Size Performance: Year-to-date, Week and Day |  |
| Too many stocks? View smallcap stocks filtered by marketcap & sector |
| Marketcap: All SmallCap Stocks (default-no microcap), Large, Mid-Range, Small |
| Smallcap Sector: Tech, Finance, Energy, Staples, Retail, Industrial, Materials, & Medical |
|
Get the most comprehensive stock market coverage daily at 12Stocks.com ➞ Best Stocks Today ➞ Best Stocks Weekly ➞ Best Stocks Year-to-Date ➞ Best Stocks Trends ➞  Best Stocks Today 12Stocks.com Best Nasdaq Stocks ➞ Best S&P 500 Stocks ➞ Best Tech Stocks ➞ Best Biotech Stocks ➞ |
| Detailed Overview of SmallCap Stocks |
| SmallCap Technical Overview, Leaders & Laggards, Top SmallCap ETF Funds & Detailed SmallCap Stocks List, Charts, Trends & More |
| Smallcap: Technical Analysis, Trends & YTD Performance | |
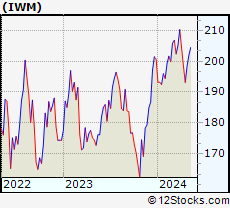
| SmallCap segment as represented by
IWM, an exchange-traded fund [ETF], holds basket of thousands of smallcap stocks from across all major sectors of the US stock market. The smallcap index (contains stocks like Riverbed & Sotheby's) is up by 11.7226% and is currently underperforming the overall market by -3.0979% year-to-date. Below is a quick view of technical charts and trends: | |
 IWM Weekly Chart |
|
| Long Term Trend: Very Good | |
| Medium Term Trend: Good | |
 IWM Daily Chart |
|
| Short Term Trend: Very Good | |
| Overall Trend Score: 90 | |
| YTD Performance: 11.7226% | |
| **Trend Scores & Views Are Only For Educational Purposes And Not For Investing | |
| 12Stocks.com: Top Performing Small Cap Index Stocks | ||||||||||||||||||||||||||||||||||||||||||||||||
 The top performing Small Cap Index stocks year to date are
Now, more recently, over last week, the top performing Small Cap Index stocks on the move are


|
||||||||||||||||||||||||||||||||||||||||||||||||
| 12Stocks.com: Investing in Smallcap Index using Exchange Traded Funds | |
|
The following table shows list of key exchange traded funds (ETF) that
help investors track Smallcap index. The following list also includes leveraged ETF funds that track twice or thrice the daily returns of Smallcap indices. Short or inverse ETF funds move in the opposite direction to the index they track and are useful during market pullbacks or during bear markets. Quick View: Move mouse or cursor over ETF symbol (ticker) to view short-term technical chart and over ETF name to view long term chart. Click on ticker or stock name for detailed view. Click on to add stock symbol to your watchlist and to view watchlist. |
12Stocks.com List of ETFs that track Smallcap Index
| Ticker | ETF Name | Watchlist | Recent Price | Smart Investing & Trading Score | Change % | Week % | Year-to-date % |
| IWM | iShares Russell 2000 ETF | | 245.83 | 90 | 0.741742 | 2.73309 | 11.7226% |
| IJR | iShares Core S&P Small-Cap ETF | | 120.08 | 90 | 0.451732 | 2.36126 | 5.14702% |
| VTWO | Vanguard Russell 2000 Index ETF | | 99.37 | 90 | 0.760495 | 2.6974 | 11.8093% |
| IWO | iShares Russell 2000 Growth ETF | | 325.46 | 90 | 0.605873 | 2.95457 | 12.9885% |
| IWN | iShares Russell 2000 Value ETF | | 179.44 | 90 | 0.78634 | 2.47858 | 10.3187% |
| IJS | iShares S&P Small-Cap 600 Value ETF | | 112.35 | 80 | 0.663023 | 3.11123 | 4.73083% |
| IJT | iShares S&P Small-Cap 600 Growth ETF | | 142.41 | 90 | 0.225209 | 1.7505 | 5.48811% |
| XSLV | Invesco S&P SmallCap Low Volatility ETF | | 46.28 | 50 | 0.333433 | 0.28169 | -0.600307% |
| SAA | ProShares Ultra SmallCap600 2x Shares | | 26.29 | 80 | 1.63024 | 5.37094 | 1.8906% |
| SDD | ProShares UltraShort SmallCap600 -2x Shares | | 12.82 | 10 | -1.27905 | -2.83607 | -15.2401% |
| SMLV | SPDR SSGA US Small Cap Low Volatility Index ETF | | 129.94 | 60 | 0.525298 | 0.541632 | 4.21465% |
| SBB | ProShares Short SmallCap600 -1x Shares | | 13.69 | 10 | -0.916688 | -2.59744 | -5.21974% |
| 12Stocks.com: Charts, Trends, Fundamental Data and Performances of SmallCap Stocks | |
|
We now take in-depth look at all SmallCap stocks including charts, multi-period performances and overall trends (as measured by Smart Investing & Trading Score). One can sort SmallCap stocks (click link to choose) by Daily, Weekly and by Year-to-Date performances. Also, one can sort by size of the company or by market capitalization. |
| Select Your Default Chart Type: | |||||
| |||||
| Click on stock symbol or name for detailed view. Click on to add stock symbol to your watchlist and to view watchlist. Quick View: Move mouse or cursor over "Daily" to quickly view daily technical stock chart and over "Weekly" to view weekly technical stock chart. | |||||

 | RBOT Vicarious Surgical Inc |
| Sector: Health Care | |
| SubSector: Medical Devices | |
| MarketCap: 33.87 Millions | |
| Recent Price: 7.06 Smart Investing & Trading Score: 80 | |
| Day Percent Change: 27.2072% Day Change: 0.48 | |
| Week Change: 28.5975% Year-to-date Change: -49.0% | |
| RBOT Links: Profile News Message Board | |
| Charts:- Daily , Weekly | |
| Add RBOT to Watchlist: View: Get Complete RBOT Trend Analysis ➞ | |
 | FCEL Fuelcell Energy Inc |
| Sector: Industrials | |
| SubSector: Electrical Equipment & Parts | |
| MarketCap: 92.3 Millions | |
| Recent Price: 10.21 Smart Investing & Trading Score: 100 | |
| Day Percent Change: 17.6267% Day Change: 0.05 | |
| Week Change: 29.5685% Year-to-date Change: -1.5% | |
| FCEL Links: Profile News Message Board | |
| Charts:- Daily , Weekly | |
| Add FCEL to Watchlist: View: Get Complete FCEL Trend Analysis ➞ | |
 | SPWH Sportsman's Warehouse Holdings Inc |
| Sector: Services & Goods | |
| SubSector: Specialty Retail | |
| MarketCap: 129.9 Millions | |
| Recent Price: 2.88 Smart Investing & Trading Score: 30 | |
| Day Percent Change: 17.0732% Day Change: -0.05 | |
| Week Change: -6.18893% Year-to-date Change: 12.1% | |
| SPWH Links: Profile News Message Board | |
| Charts:- Daily , Weekly | |
| Add SPWH to Watchlist: View: Get Complete SPWH Trend Analysis ➞ | |
 | ZURA Zura Bio Ltd |
| Sector: Health Care | |
| SubSector: Biotechnology | |
| MarketCap: 143.04 Millions | |
| Recent Price: 3.93 Smart Investing & Trading Score: 51 | |
| Day Percent Change: 13.71% Day Change: 0.24 | |
| Week Change: 15.7% Year-to-date Change: -20.4% | |
| ZURA Links: Profile News Message Board | |
| Charts:- Daily , Weekly | |
| Add ZURA to Watchlist: View: Get Complete ZURA Trend Analysis ➞ | |
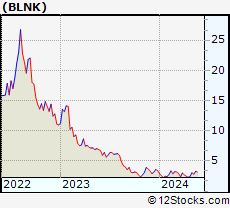 | BLNK Blink Charging Co |
| Sector: Industrials | |
| SubSector: Engineering & Construction | |
| MarketCap: 106.81 Millions | |
| Recent Price: 1.99 Smart Investing & Trading Score: 100 | |
| Day Percent Change: 13.0682% Day Change: -0.01 | |
| Week Change: 30.0654% Year-to-date Change: 32.7% | |
| BLNK Links: Profile News Message Board | |
| Charts:- Daily , Weekly | |
| Add BLNK to Watchlist: View: Get Complete BLNK Trend Analysis ➞ | |
 | ALXO Alx Oncology Holdings Inc |
| Sector: Health Care | |
| SubSector: Biotechnology | |
| MarketCap: 65.33 Millions | |
| Recent Price: 2.15 Smart Investing & Trading Score: 100 | |
| Day Percent Change: 12.5654% Day Change: 0.2 | |
| Week Change: 20.1117% Year-to-date Change: 37.8% | |
| ALXO Links: Profile News Message Board | |
| Charts:- Daily , Weekly | |
| Add ALXO to Watchlist: View: Get Complete ALXO Trend Analysis ➞ | |
 | GWH ESS Tech Inc |
| Sector: Industrials | |
| SubSector: Electrical Equipment & Parts | |
| MarketCap: 19.66 Millions | |
| Recent Price: 1.72 Smart Investing & Trading Score: 60 | |
| Day Percent Change: 12.4183% Day Change: -0.07 | |
| Week Change: -0.578035% Year-to-date Change: -71.7% | |
| GWH Links: Profile News Message Board | |
| Charts:- Daily , Weekly | |
| Add GWH to Watchlist: View: Get Complete GWH Trend Analysis ➞ | |
 | OVID Ovid Therapeutics Inc |
| Sector: Health Care | |
| SubSector: Biotechnology | |
| MarketCap: 87.46 Millions | |
| Recent Price: 1.84 Smart Investing & Trading Score: 100 | |
| Day Percent Change: 12.1951% Day Change: 0.01 | |
| Week Change: 30.4965% Year-to-date Change: 92.1% | |
| OVID Links: Profile News Message Board | |
| Charts:- Daily , Weekly | |
| Add OVID to Watchlist: View: Get Complete OVID Trend Analysis ➞ | |
 | PLCE Childrens Place Inc |
| Sector: Services & Goods | |
| SubSector: Apparel Manufacturing | |
| MarketCap: 120.59 Millions | |
| Recent Price: 7.17 Smart Investing & Trading Score: 90 | |
| Day Percent Change: 12.0312% Day Change: 0.19 | |
| Week Change: 8.47201% Year-to-date Change: -31.4% | |
| PLCE Links: Profile News Message Board | |
| Charts:- Daily , Weekly | |
| Add PLCE to Watchlist: View: Get Complete PLCE Trend Analysis ➞ | |
 | PTSI P.A.M. Transportation Services, Inc. |
| Sector: Transports | |
| SubSector: Trucking | |
| MarketCap: 136.915 Millions | |
| Recent Price: 21.80 Smart Investing & Trading Score: 100 | |
| Day Percent Change: 10.5477% Day Change: -9999 | |
| Week Change: 33.0079% Year-to-date Change: 0.0% | |
| PTSI Links: Profile News Message Board | |
| Charts:- Daily , Weekly | |
| Add PTSI to Watchlist: View: Get Complete PTSI Trend Analysis ➞ | |
 | RLYB Rallybio Corp |
| Sector: Health Care | |
| SubSector: Biotechnology | |
| MarketCap: 25.43 Millions | |
| Recent Price: 0.56 Smart Investing & Trading Score: 70 | |
| Day Percent Change: 9.61689% Day Change: -0.01 | |
| Week Change: -0.760927% Year-to-date Change: -41.0% | |
| RLYB Links: Profile News Message Board | |
| Charts:- Daily , Weekly | |
| Add RLYB to Watchlist: View: Get Complete RLYB Trend Analysis ➞ | |
 | LUNG Pulmonx Corp |
| Sector: Health Care | |
| SubSector: Medical Devices | |
| MarketCap: 70.9 Millions | |
| Recent Price: 1.84 Smart Investing & Trading Score: 80 | |
| Day Percent Change: 9.1716% Day Change: 0.02 | |
| Week Change: 7.89474% Year-to-date Change: -71.7% | |
| LUNG Links: Profile News Message Board | |
| Charts:- Daily , Weekly | |
| Add LUNG to Watchlist: View: Get Complete LUNG Trend Analysis ➞ | |
 | FEAM 5E Advanced Materials Inc |
| Sector: Materials | |
| SubSector: Specialty Chemicals | |
| MarketCap: 77.2 Millions | |
| Recent Price: 3.98 Smart Investing & Trading Score: 54 | |
| Day Percent Change: 8.29% Day Change: 0.35 | |
| Week Change: -3.59% Year-to-date Change: -69.0% | |
| FEAM Links: Profile News Message Board | |
| Charts:- Daily , Weekly | |
| Add FEAM to Watchlist: View: Get Complete FEAM Trend Analysis ➞ | |
 | CMBM Cambium Networks Corp |
| Sector: Technology | |
| SubSector: Communication Equipment | |
| MarketCap: 18.41 Millions | |
| Recent Price: 0.90 Smart Investing & Trading Score: 60 | |
| Day Percent Change: 6.7938% Day Change: 0 | |
| Week Change: -5.34545% Year-to-date Change: 14.3% | |
| CMBM Links: Profile News Message Board | |
| Charts:- Daily , Weekly | |
| Add CMBM to Watchlist: View: Get Complete CMBM Trend Analysis ➞ | |
 | ATOM Atomera Inc |
| Sector: Technology | |
| SubSector: Semiconductor Equipment & Materials | |
| MarketCap: 99.8 Millions | |
| Recent Price: 4.97 Smart Investing & Trading Score: 90 | |
| Day Percent Change: 6.65236% Day Change: -0.01 | |
| Week Change: 27.11% Year-to-date Change: -61.6% | |
| ATOM Links: Profile News Message Board | |
| Charts:- Daily , Weekly | |
| Add ATOM to Watchlist: View: Get Complete ATOM Trend Analysis ➞ | |
 | IRBT Irobot Corp |
| Sector: Services & Goods | |
| SubSector: Furnishings, Fixtures & Appliances | |
| MarketCap: 101.63 Millions | |
| Recent Price: 4.22 Smart Investing & Trading Score: 80 | |
| Day Percent Change: 5.88972% Day Change: -0.04 | |
| Week Change: 22.8198% Year-to-date Change: -46.9% | |
| IRBT Links: Profile News Message Board | |
| Charts:- Daily , Weekly | |
| Add IRBT to Watchlist: View: Get Complete IRBT Trend Analysis ➞ | |
 | SAVA Cassava Sciences Inc |
| Sector: Health Care | |
| SubSector: Biotechnology | |
| MarketCap: 104.35 Millions | |
| Recent Price: 3.63 Smart Investing & Trading Score: 100 | |
| Day Percent Change: 5.8309% Day Change: 0.01 | |
| Week Change: 17.0968% Year-to-date Change: 32.0% | |
| SAVA Links: Profile News Message Board | |
| Charts:- Daily , Weekly | |
| Add SAVA to Watchlist: View: Get Complete SAVA Trend Analysis ➞ | |
 | VERI Veritone Inc |
| Sector: Technology | |
| SubSector: Software - Infrastructure | |
| MarketCap: 147.02 Millions | |
| Recent Price: 5.58 Smart Investing & Trading Score: 90 | |
| Day Percent Change: 5.48204% Day Change: -0.01 | |
| Week Change: 0% Year-to-date Change: 74.4% | |
| VERI Links: Profile News Message Board | |
| Charts:- Daily , Weekly | |
| Add VERI to Watchlist: View: Get Complete VERI Trend Analysis ➞ | |
 | AGEN Agenus Inc |
| Sector: Health Care | |
| SubSector: Biotechnology | |
| MarketCap: 137.97 Millions | |
| Recent Price: 4.15 Smart Investing & Trading Score: 50 | |
| Day Percent Change: 5.37817% Day Change: 0.06 | |
| Week Change: 6.45897% Year-to-date Change: 34.4% | |
| AGEN Links: Profile News Message Board | |
| Charts:- Daily , Weekly | |
| Add AGEN to Watchlist: View: Get Complete AGEN Trend Analysis ➞ | |
 | PRPL Purple Innovation Inc |
| Sector: Services & Goods | |
| SubSector: Furnishings, Fixtures & Appliances | |
| MarketCap: 122.5 Millions | |
| Recent Price: 0.95 Smart Investing & Trading Score: 60 | |
| Day Percent Change: 4.85981% Day Change: -0.02 | |
| Week Change: 0.97406% Year-to-date Change: 27.3% | |
| PRPL Links: Profile News Message Board | |
| Charts:- Daily , Weekly | |
| Add PRPL to Watchlist: View: Get Complete PRPL Trend Analysis ➞ | |
 | EHTH eHealth Inc |
| Sector: Financials | |
| SubSector: Insurance Brokers | |
| MarketCap: 124.98 Millions | |
| Recent Price: 4.45 Smart Investing & Trading Score: 90 | |
| Day Percent Change: 4.71143% Day Change: 0.16 | |
| Week Change: 14.2674% Year-to-date Change: -50.2% | |
| EHTH Links: Profile News Message Board | |
| Charts:- Daily , Weekly | |
| Add EHTH to Watchlist: View: Get Complete EHTH Trend Analysis ➞ | |
 | CLPR Clipper Realty Inc |
| Sector: Financials | |
| SubSector: REIT - Residential | |
| MarketCap: 71.21 Millions | |
| Recent Price: 4.01 Smart Investing & Trading Score: 70 | |
| Day Percent Change: 4.42708% Day Change: -0.06 | |
| Week Change: 4.69974% Year-to-date Change: -5.2% | |
| CLPR Links: Profile News Message Board | |
| Charts:- Daily , Weekly | |
| Add CLPR to Watchlist: View: Get Complete CLPR Trend Analysis ➞ | |
 | PMVP PMV Pharmaceuticals Inc |
| Sector: Health Care | |
| SubSector: Biotechnology | |
| MarketCap: 77.37 Millions | |
| Recent Price: 1.44 Smart Investing & Trading Score: 70 | |
| Day Percent Change: 4.34783% Day Change: -0.01 | |
| Week Change: 2.85714% Year-to-date Change: -5.9% | |
| PMVP Links: Profile News Message Board | |
| Charts:- Daily , Weekly | |
| Add PMVP to Watchlist: View: Get Complete PMVP Trend Analysis ➞ | |
 | SST System1 Inc |
| Sector: Industrials | |
| SubSector: Specialty Business Services | |
| MarketCap: 77.04 Millions | |
| Recent Price: 7.95 Smart Investing & Trading Score: 70 | |
| Day Percent Change: 4.33071% Day Change: 0.31 | |
| Week Change: 8.31063% Year-to-date Change: -6.7% | |
| SST Links: Profile News Message Board | |
| Charts:- Daily , Weekly | |
| Add SST to Watchlist: View: Get Complete SST Trend Analysis ➞ | |
 | DLTH Duluth Holdings Inc |
| Sector: Services & Goods | |
| SubSector: Apparel Retail | |
| MarketCap: 142.42 Millions | |
| Recent Price: 4.02 Smart Investing & Trading Score: 90 | |
| Day Percent Change: 4.28016% Day Change: -0.03 | |
| Week Change: 11.6667% Year-to-date Change: 37.7% | |
| DLTH Links: Profile News Message Board | |
| Charts:- Daily , Weekly | |
| Add DLTH to Watchlist: View: Get Complete DLTH Trend Analysis ➞ | |
| For tabular summary view of above stock list: Summary View ➞ 0 - 25 , 25 - 50 , 50 - 75 , 75 - 100 , 100 - 125 , 125 - 150 | ||
| Click To Change The Sort Order: By Market Cap or Company Size Performance: Year-to-date, Week and Day | |
| Select Chart Type: | ||
| Too many stocks? View smallcap stocks filtered by marketcap & sector |
| Marketcap: All SmallCap Stocks (default-no microcap), Large, Mid-Range, Small & MicroCap |
| Sector: Tech, Finance, Energy, Staples, Retail, Industrial, Materials, Utilities & Medical |
|
Best Stocks Today 12Stocks.com |
© 2025 12Stocks.com Terms & Conditions Privacy Contact Us
All Information Provided Only For Education And Not To Be Used For Investing or Trading. See Terms & Conditions


One More Thing ... Get Best Stocks Delivered Daily!
Never Ever Miss A Move With Our Top Ten Stocks Lists
Find Best Stocks In Any Market - Bull or Bear Market
Take A Peek At Our Top Ten Stocks Lists: Daily, Weekly, Year-to-Date & Top Trends
Find Best Stocks In Any Market - Bull or Bear Market
Take A Peek At Our Top Ten Stocks Lists: Daily, Weekly, Year-to-Date & Top Trends
Smallcap Stocks With Best Up Trends [0-bearish to 100-bullish]: Montauk Renewables[100], Butterfly [100], SES AI[100], Fuelcell Energy[100], AlloVir [100], Cara [100], Archer Aviation[100], Erasca [100], Blink Charging[100], Alx Oncology[100], LSB Industries[100]
Best Smallcap Stocks Year-to-Date:
ThredUp [569.504%], Eagle [495.238%], FiscalNote [396.154%], Centrus Energy[363.862%], Global Medical[353.432%], 908 Devices[314.384%], Bloom Energy[286.35%], Planet Labs[285.642%], Celcuity [284.692%], Kratos Defense[264.556%], Digital Turbine[260.227%] Best Smallcap Stocks This Week:
Textainer Group[258.475%], United Community[163.439%], Lakeland Bancorp[147.684%], ClearPoint Neuro[125.164%], Dominion Midstream[118.502%], Bakkt [116.747%], PDL BioPharma[112.645%], GTx [108.706%], Overseas Shipholding[77.0318%], PGT Innovations[65.2536%], Eyenovia [50.3665%] Best Smallcap Stocks Daily:
Vicarious Surgical[27.2072%], Montauk Renewables[22.7723%], Butterfly [18.8776%], SES AI[17.7143%], Fuelcell Energy[17.6267%], Sportsman's Warehouse[17.0732%], Humacyte [17.0391%], AlloVir [16.9215%], Cara [14.3396%], Stratus Properties[13.899%], Zura Bio[13.71%]